- Introducing the Ichimoku trading system
- Description of Ichimoku Components
- Practical principles of Ichimoku in trading
- Ichimoku strategies
- Combination of Ichimoku with other indicators
Ichimoku, an indicator or a trading system?
Ichimoku is not just an indicator but is a trading system. Ichimoku Kinko Hyo forex is one of the most effective trading systems used with Japanese candlestick patterns . Ichimoku Cloud is a technical analysis tool widely used in Forex market trading. A Japanese trader named Goichi Hosoda developed this indicator in the 1930s. The Ichimoku Cloud is a complex indicator consisting of five different lines that provide traders with a comprehensive view of the trend, support, resistance levels, and potential entry and exit points.
What are the components of the Ichimoku indicator?
The indicator Ichimoku cloud is a versatile indicator that we can use to analyze the market in different time frames and to identify trends, momentum, and possible reversal areas. Ichimoku Cloud consists of five main components:
- Tenkan-sen
- Kijun-sen
- Chikou Span
- Senkou Span A
- Senkou Span B
Let’s take a closer look at each of these components.
Tenkan-sen (Conversion Line):
Tenkan-sen is the fastest and weakest line of the Ichimoku system and the moving average from the highest ceiling to the lowest floor in the last nine periods. They use it to identify short-term trends and potential reversal trends. The trend is bullish when the price is higher than the Tenkan-sen and bearish when it is lower.

Kijun Sen (Base Line):
Kijun-sen is a moving average from the highest ceiling to the lowest floor over the past 26 periods. They use it to identify mid-term trends and potential support and resistance levels. The trend is bullish when the price is higher than the Kijun Sen and bearish when it is lower.
Chikou Span (Lagging Line):
Chikou Span is the current price drawn 26 periods after that. They use it to confirm trend direction and potential support and resistance levels. When the Chikou Span is higher than the price, the trend is bullish and is bearish when lower.

Senkou Span A (Leading Span A):
Senkou Span A is the average of Tenkan Sen and Kijun Sen drawn 26 periods ahead. They use it to identify potential support and resistance levels in the future. When the price is higher than the Senkou Span A, the trend is bullish and bearish when it is lower.
Senkou Span B (Leading Span B):
Senkou Span B is the average of the highest ceiling and the lowest floor of the last 52 periods, drawn 26 periods ahead. They use it to identify potential support and resistance levels in the future. When the price is higher than the Senkou Span B, the trend is bullish and bearish when it is lower.
Kumo (Cloud) consists of the fourth and fifth components of the Ichimoku Kinko Hyo forex system, Senkou Span A and Senkou Span B. “Cloud” is the most distinctive feature of the Ichimoku system. This blob of paint on the screen is perhaps one of the cleverest applications of technical analysis theory because it is one of the few forms of technical analysis that actively projects non-trendline data into the future (essentially turning lagging analysis into leading analysis). Cloud is the space between the Senkou Span A and Senkou Span B lines. Most software will shade the area between these two lines. The span is green when Senkou Span A is above Senkou Span B. This area will be red if Senkou Span A is below Senkou Span B.
Ichimoku Strategy practical principles in Forex trading
Now that we have learned indicator Ichimoku’s components, let’s analyze how to use it effectively in Forex trading. This forex ichimoku trading system is used in the following techniques:
- Identifying trends
- Trend confirmation
- Identifying support and resistance levels
- Determining entry and exit points
Follow along for the explanation of these techniques.
Identifying Trends:
The first step in using the Ichimoku Cloud is identifying the trend. Traders can do this technique by looking at the price position relative to Tenkan-sen and Kijun-sen. If the price is above both lines, it is bullish, and bearish if it is below both lines. The trend is range or neutral when the price is between two lines.
Trend Confirmation:
The next step is to confirm the trend using Chikou Span. Chikou Span confirms an uptrend if it is above the price or a downtrend if it is below the price. It indicates the possibility of a price correction or reversal trend if it is in the opposite position.
Identifying support and resistance levels:
Senkou Span A and Senkou Span B can identify future potential support and resistance levels. When the price is above Senkou Span A and B, it indicates a strong uptrend, and a strong downtrend when it’s below both lines. If the price is between the two lines, it is a ranging market.
Determining entry and exit points:
Once you have identified and confirmed the trend, you can start looking for signals. The Ichimoku indicator provides several signals traders can use to enter or exit trades. These signals are:
- Kumo cloud breakout
- Tenkan-sen/Kijun-sen crossover
- Chikou span confirmation
- Senkou Spans’ crossover
We will explain these signals further.
Kumo cloud breakout:
when the price breaks the cloud upwards, it is a bullish signal, and the trader can enter into a buy trade, and when the price breaks the cloud downwards, it is a bearish signal and an opportunity for a sell trade.
Tenkan-sen/Kijun-sen Crossover:
It is a bullish signal when Tenkan-sen crosses above Kijun-sen, and when Tenkan-sen crosses below Kijun-sen, it is a bearish signal.
Chikou span Confirmation:
When the Chikou span goes above the price, it is a bullish signal, and when the line crosses below the price, it is a bearish signal.
Senkou Spans’ crossover:
When Senkou Span A crosses above Senkou Span B, it is a bullish signal, and when Senkou Span A crosses below Senkou Span B, it is a bearish signal.
It is important to note that traders should not rely only on the Ichimoku indicator in making trading decisions. Using Ichimoku with other technical and fundamental analysis tools is always better.
Ichimoku Trading Signals
The Ichimoku system generates clear trading signals through line crossovers, cloud interactions, and lagging span alignments. These signals help identify momentum shifts, support/resistance, and market trends.
Bullish Signals
A strong buy signal occurs when the Tenkan-sen (Conversion Line) crosses above the Kijun-sen (Base Line), especially above the cloud. Price breaking above the cloud (Senkou Span A > B) confirms upward momentum. The Chikou Span (Lagging Span) above the price action 26 periods ago adds conviction, signaling potential long entries.
Bearish Signals
Conversely, a sell signal forms when Tenkan-sen crosses below Kijun-sen, ideally below the cloud. Price piercing below the cloud (Senkou Span A < B) indicates downward pressure. Chikou Span below past price reinforces bearish bias, ideal for short positions.
Flat & Neutral Market Signals
In ranging markets, flat Tenkan and Kijun lines within or near the cloud suggest indecision. Price oscillating inside the cloud (Senkou Spans converging) warns of low volatility, suggesting to avoiding trades until a breakout.
Confirmation Signals
For reliability, seek multi-element alignment: e.g., bullish crossover + cloud breakout + Chikou clearance. Use volume or RSI for extra validation to filter false signals.
Ichimoku strategy
Trading with Ichimoku alone will not lead you to high trading levels, but some parts of this indicator have high analytical value. It is a good idea to take elements from Ichimoku and apply them to your system. However, these improvements are only a priority when you develop your risk and capital management and trading mindset. Ichimoku allows a beginner to expand all these requirements. It has enough components to cover the most significant aspects of trading and is also a foundation for capital management. Of course, creating the right mindset takes time and can only be created if you are disciplined. In this article, we will teach you some practical strategies. These strategies include:
- Ideal Ichimoku strategy
- K-cross Ichimoku strategy
Stay tuned for a thorough tutorial on these trading strategies.
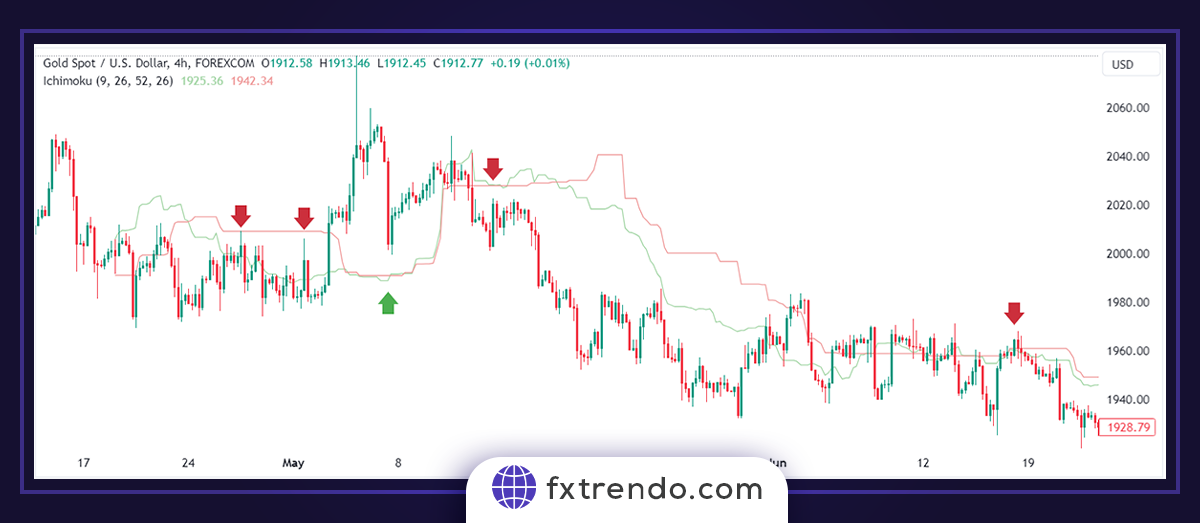
Ideal Ichimoku Strategy:
This trading technique is the first strategy of the Ichimoku system. We provided two trading setups for buy and sell.
For Buy
1- The price is above the cloud.
2- Tenkan sen is higher than Kijun sen.
3- The Chikou span is above the candles.
4- The future cloud is “green.”
5- The price is not far from Tenkan Sen or Kijun Sen.
6- Tenkan-Sen, Kijun-Sen, and Chikou Span should not be in a dense cloud.
Read More: Features of the Best Broker for Trading Gold.
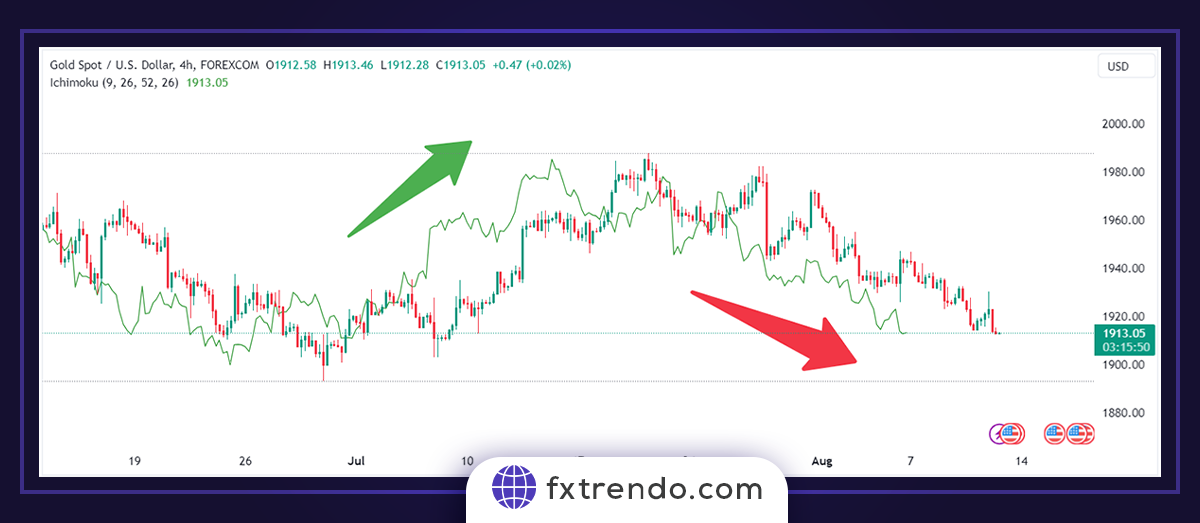
You can see the gold chart in the image below, which has all the conditions of an ideal strategy. So we can enter into a buy trade.

We can see the result in the next image.
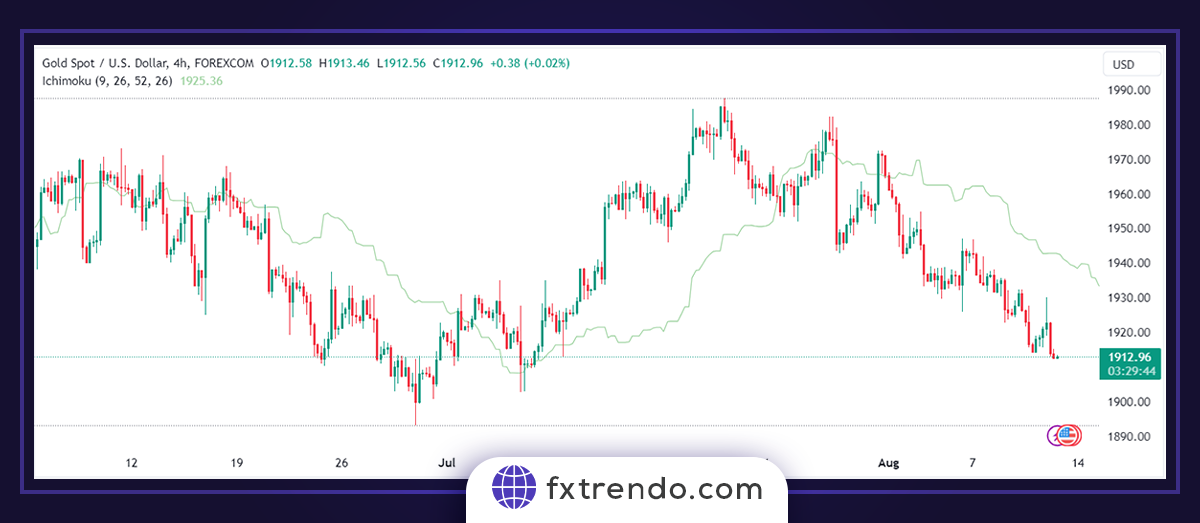
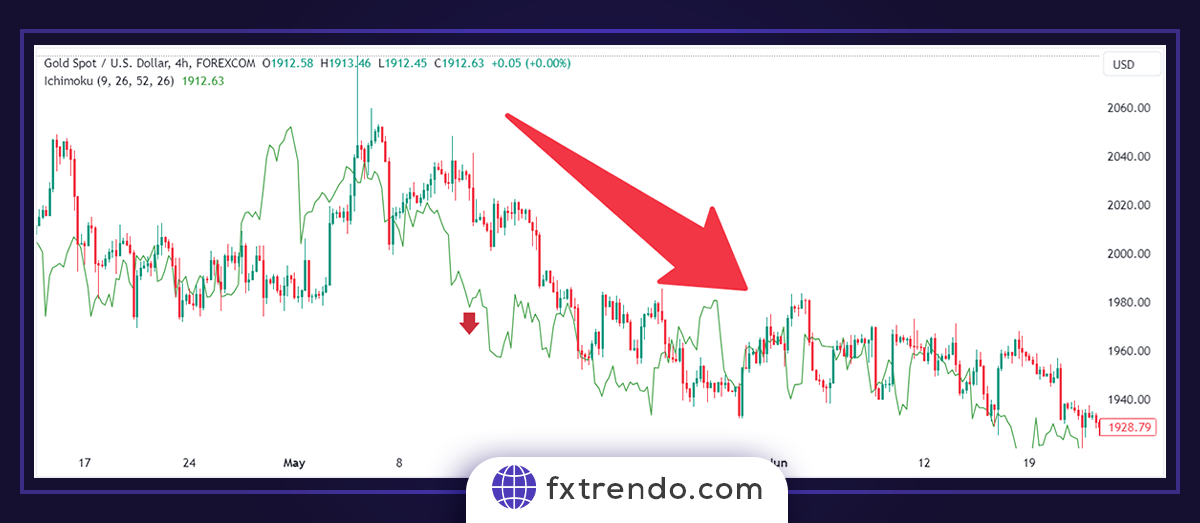
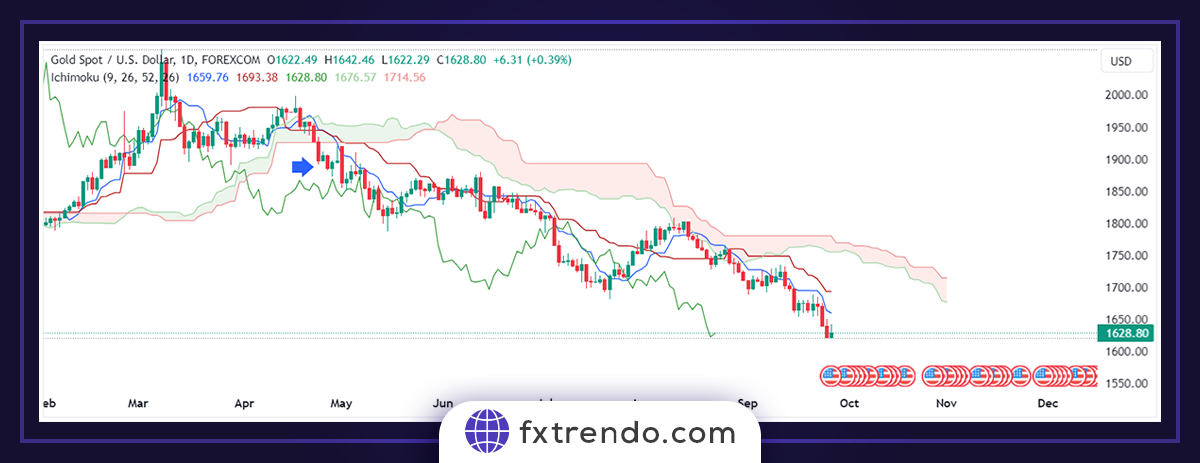
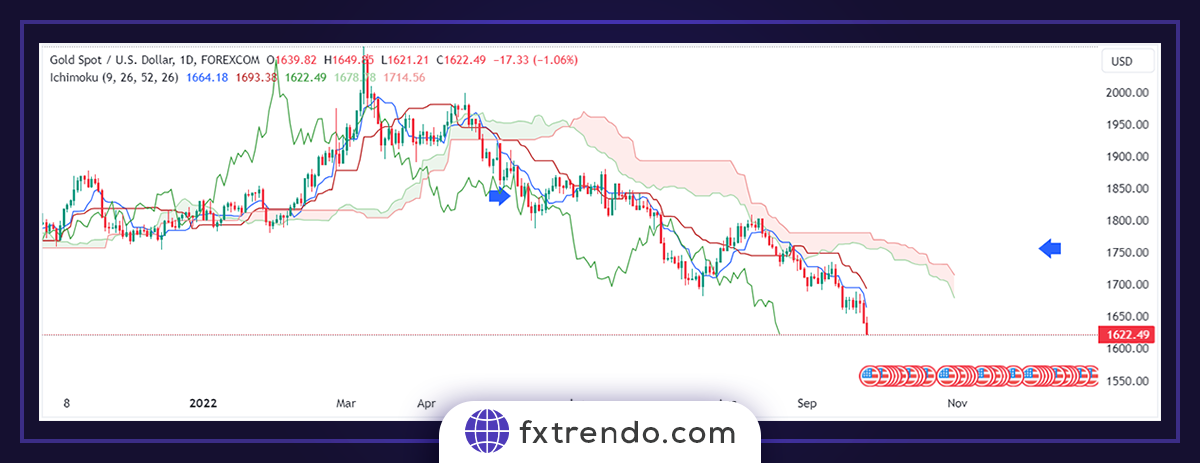
For Sell
1- The price is below the cloud.
2- Tenkan sen is below Kijun sen.
3- The Chikou span is above the candles.
4- The future cloud is “red.”
5- The price is not far from Tenkan Sen or Kijun Sen.
6- Tenkan-Sen, Kijun-Sen, and Chikou Span should not be in a dense cloud.
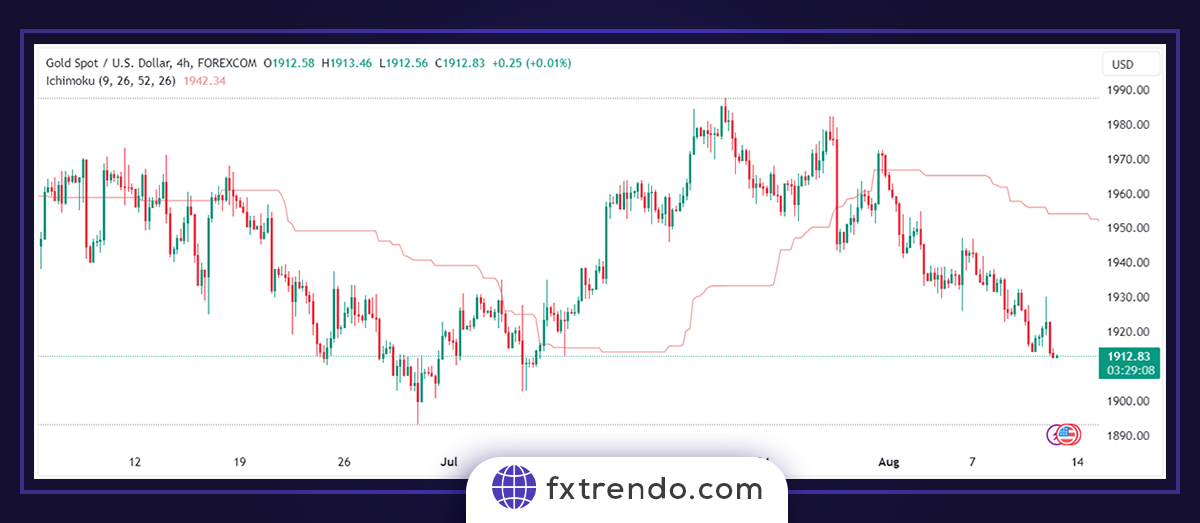
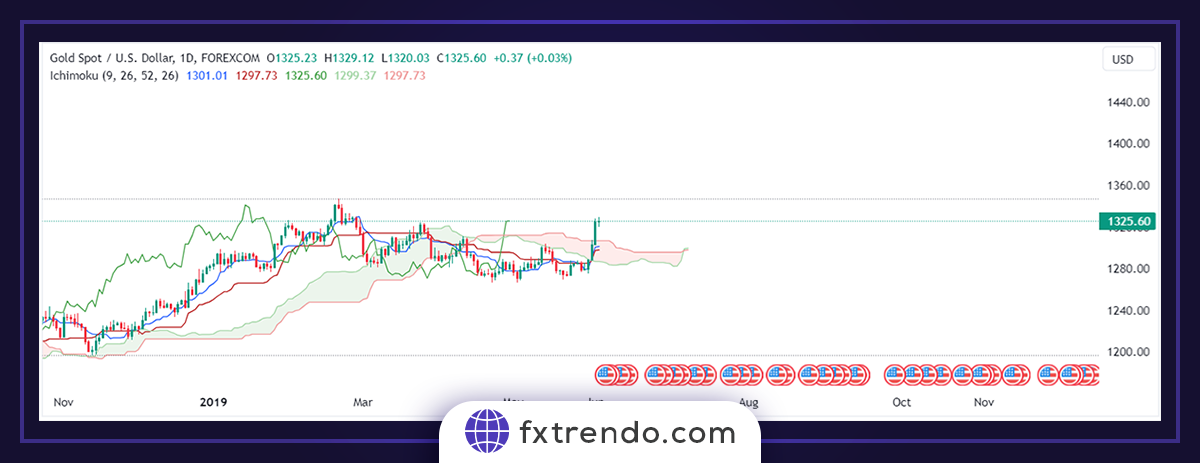
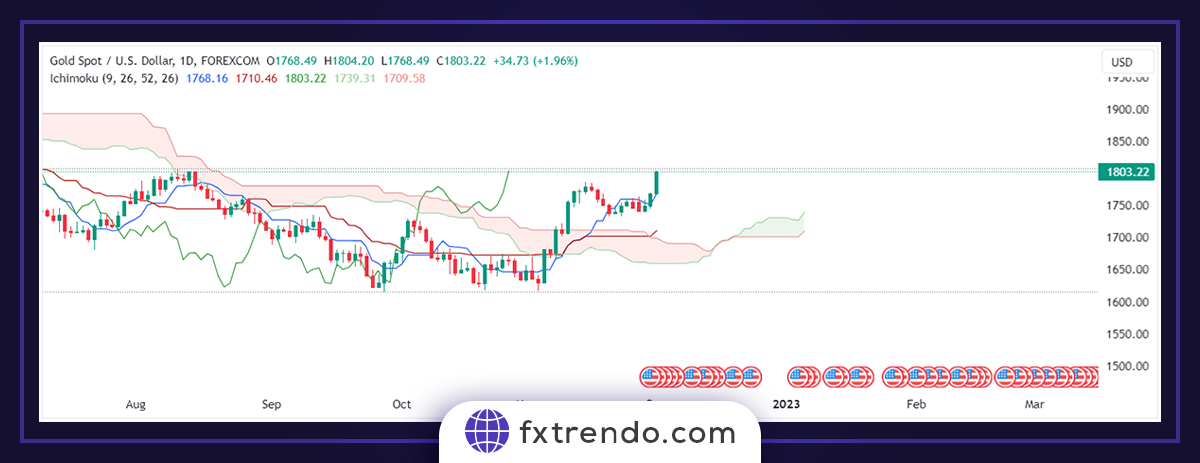
You can see the gold chart in the image below, which has all the conditions of an ideal Ichimoku strategy. So we can enter into a sell trade.
And we can see the result in the next image.
K-cross Ichimoku strategy:
The Kijun-Sen Crossover strategy is the second Ichimoku strategy. We provided two trading setups for buy and sell. This trading strategy has the lowest risk factor among all Ichimoku strategies, and its risk-to-reward ratio can be very high.
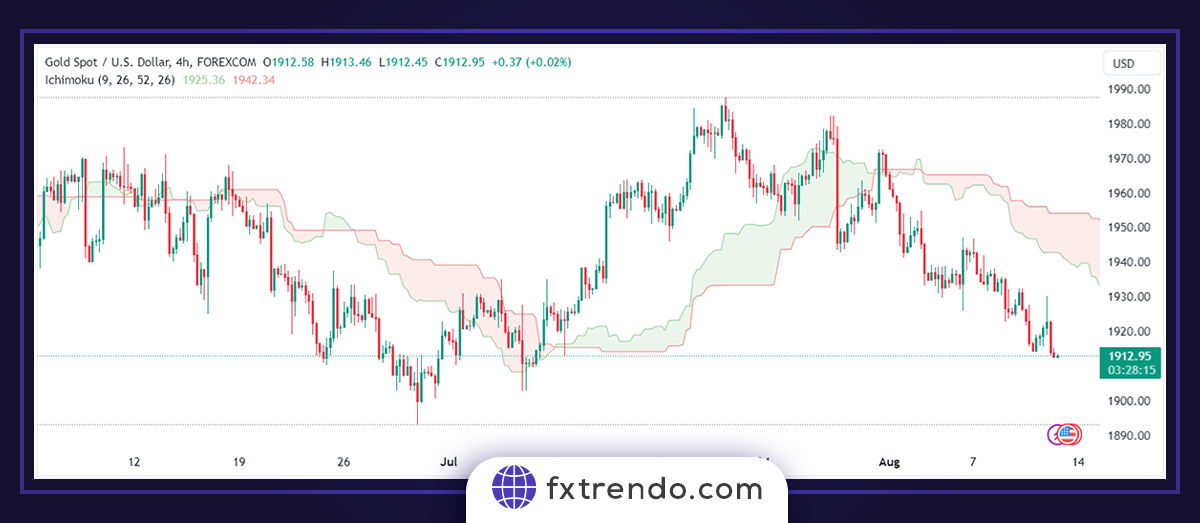
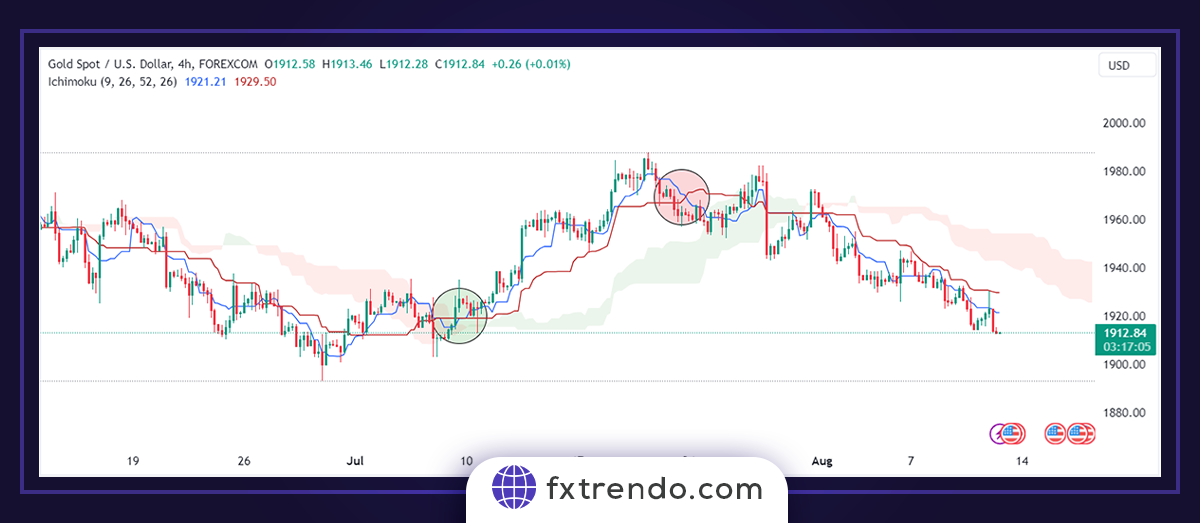
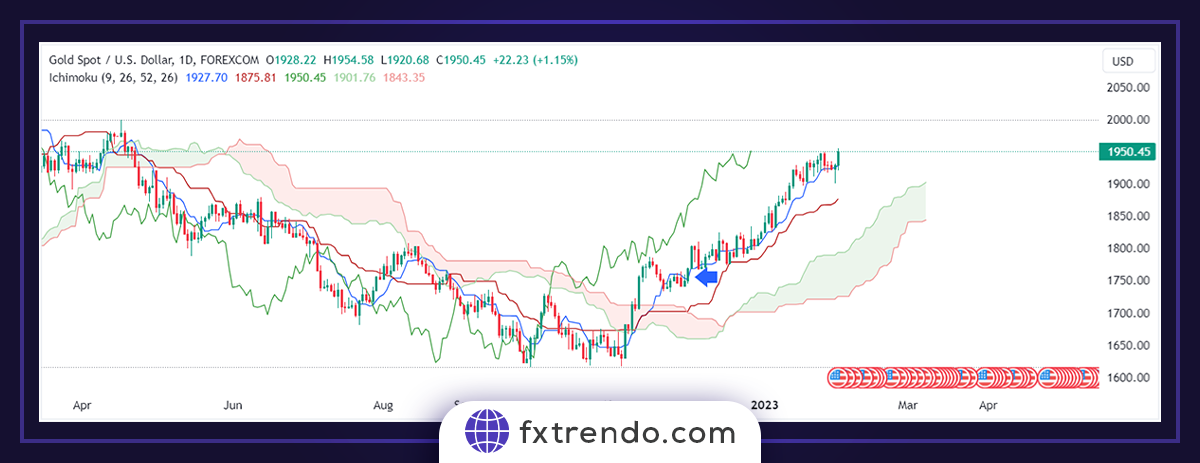
For Buy
1- The price crosses the Kijun-Sen upwards.
2- Tenkan sen is more than Kijun sen.
3- The Chikou Span is outside.
4- Future Senkou Span B is flat or upward.
5- Price, Tenkan-Sen, Kijun-Sen, and Chikou Span should not be in the Cloud. Otherwise, the cloud must be dense.
6- The price should not be far from Tenkan-Sen or Kijun-Sen.
7- The future cloud is not dense (optional).
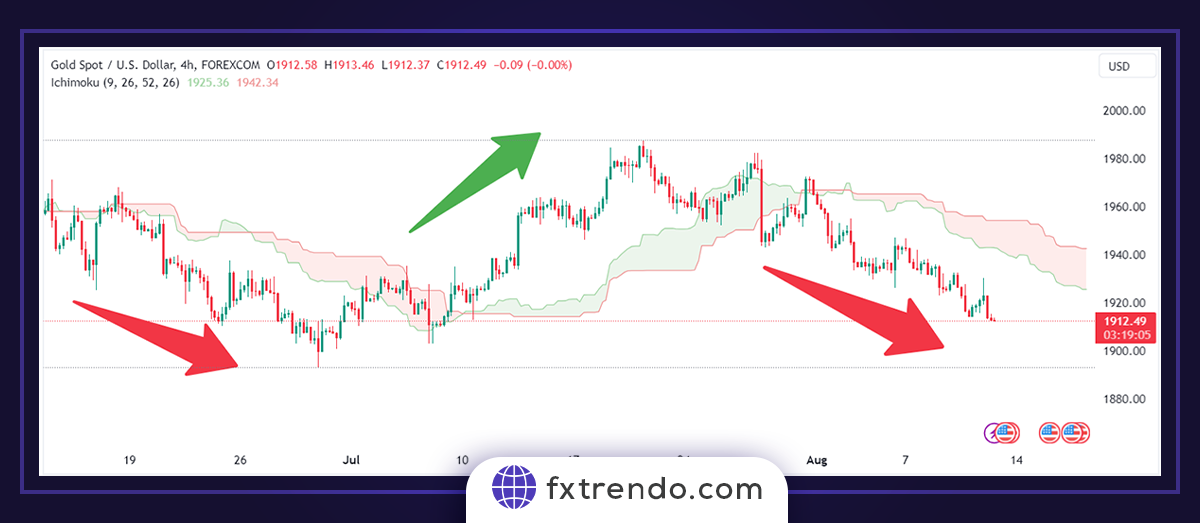
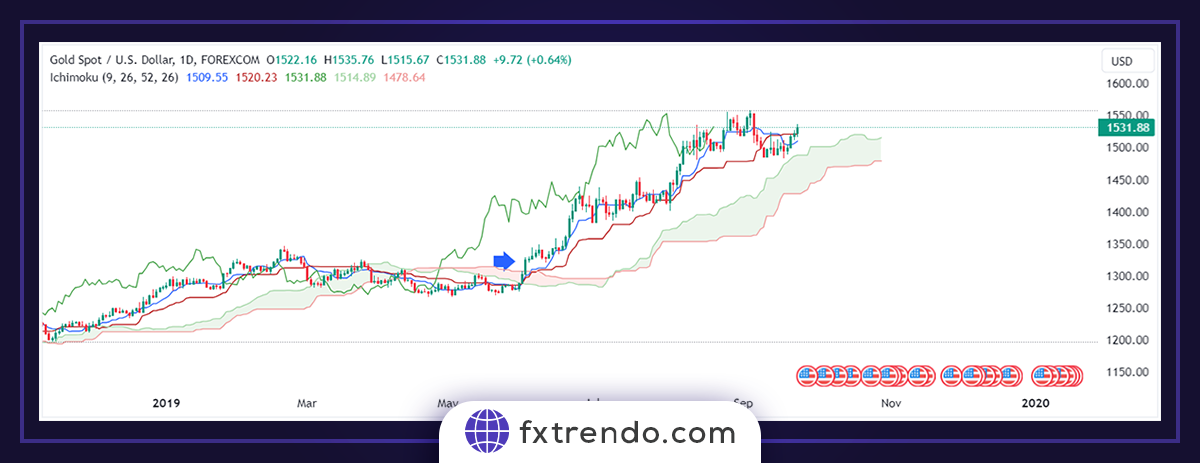
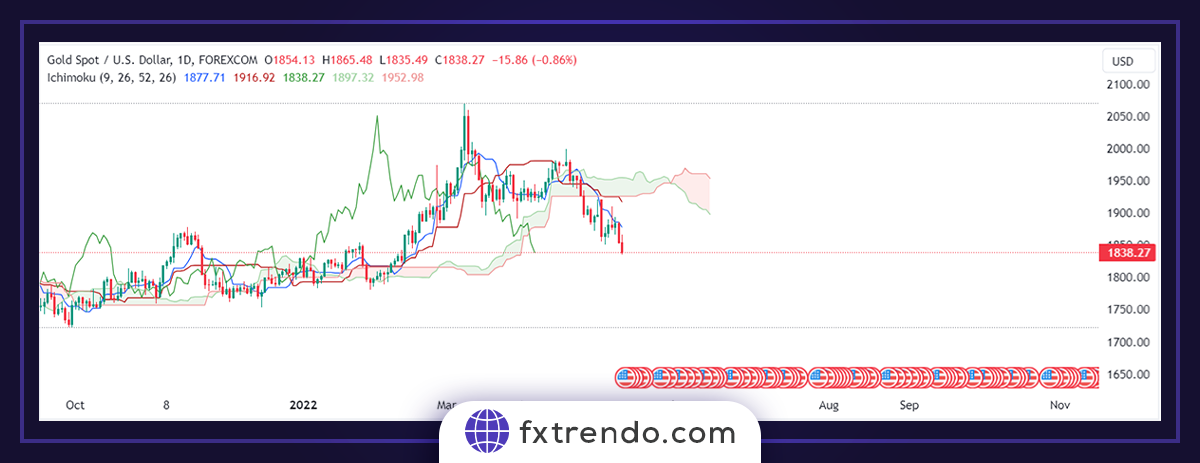
You can see the gold chart in the image below, which has all the conditions of the K-cross Ichimoku strategy. So we can enter into a buy trade.
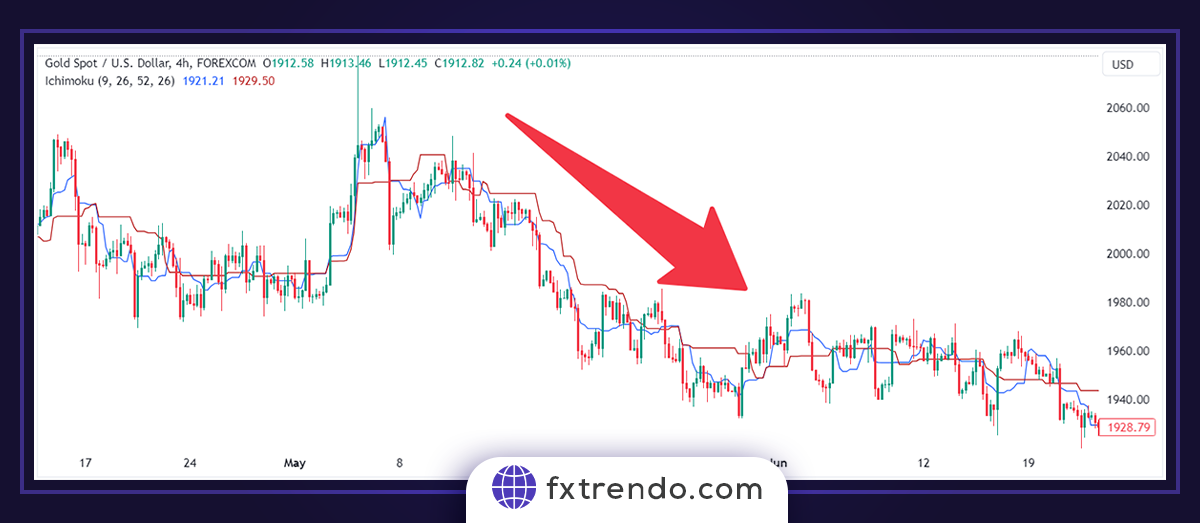
We can see the result in the next image.
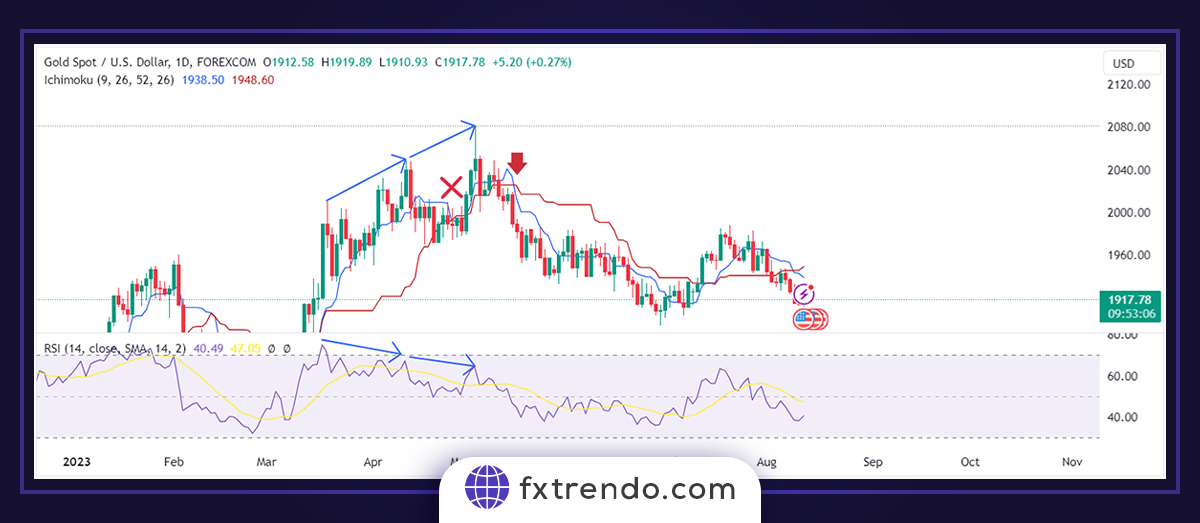
For Sell
1- The price crosses the Kijun-Sen downwards.
2- Tenkan sen is less than Kijun sen.
3- The Chikou Span is outside.
4- Future Senkou Span B is flat or downward.
5- Price, Tenkan-Sen, Kijun-Sen, and Chikou Span should not be in the Cloud. Otherwise, the cloud must be dense.
6- The price should not be far from Tenkan-Sen or Kijun-Sen.
7- The future cloud is not dense (optional).
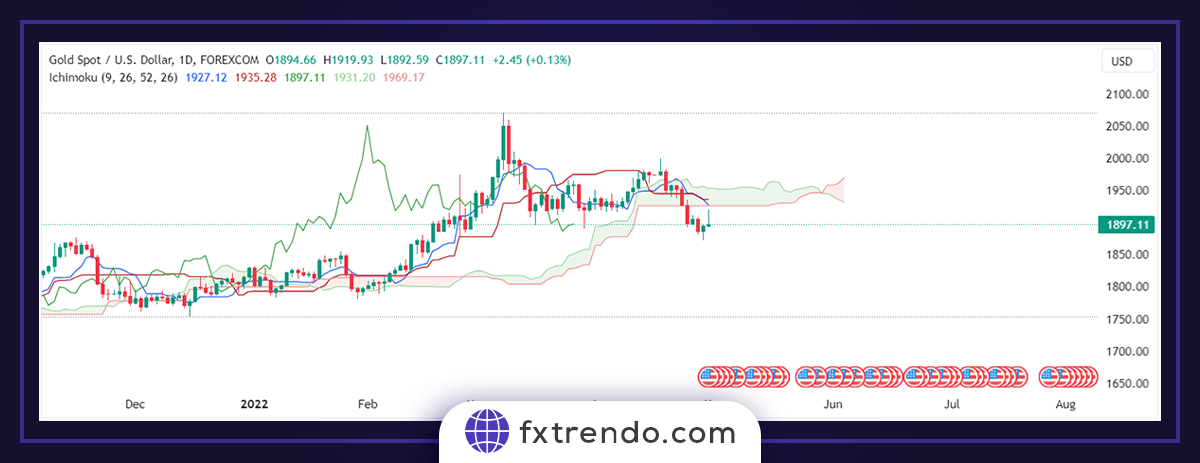
You can see the gold chart in the image below, which has all the conditions of the K-cross Ichimoku strategy. So we can enter into a sell trade.
We can see the result in the next image.
Ichimoku in Different Timeframes
Ichimoku’s strength lies in its adaptability across timeframes, allowing traders to align trades with broader trends while pinpointing entries. Start by analyzing higher timeframes for direction, then drill down for precision, in order to reduce whipsaws and boost win rates.
Multi-timeframe use
Employ a top-down approach: Scan the daily chart for overall trend (e.g., price above cloud = bullish bias). Switch to H4 for confirmation: look for Tenkan/Kijun crossovers aligning with the daily signal. Finally, drop to H1 for entry timing: entering only when the lower timeframe mirrors the higher one’s momentum. This filters noise: If daily shows a flat cloud, skip H1 signals. Backtest on the Trendo Trading platform to refine.
Signal differences at Daily, H4, and H1 timeframes
- Daily: Signals are robust for swing trades (hold 3-10 days). Cloud breaks signal major reversals; ignore minor crosses. Ideal for position sizing based on weekly pivots.
- H4: Balances trend and speed for intra-week trades. Crossovers here catch pullbacks—stronger than H1 but less laggy than daily. Use for 50-200 pip targets.
- H1: High-frequency signals for scalps (15-60 mins). Frequent but false-prone; only trade if cloud is thick and Chikou clears price decisively. Tight stop (10-20 pips) is essential.
Adapt settings minimally—default 9/26/52 works universally. Practice on demo accounts to spot timeframe-specific quirks.
Ichimoku and other indicators
Professional traders like to combine the Ichimoku indicator with other tools. Here, we introduce two popular combined strategies. These strategies include:
- Ichimoku and RSI
- Ichimoku and 200 moving average
You can read the definition of these strategies below. Consider that you must do the ichimoku training for a long time to ba a pro and use it effectively.
Ichimoku and RSI:
This combination is believed to help traders take full advantage of trends and identify reversals in market trends. RSI divergence allows us to see the floor and ceiling of the market, and we will discover potential entry points with the Ichimoku cloud.
Read More: Relative Strength Index (RSI) indicator and teaching its use in technical analysis.
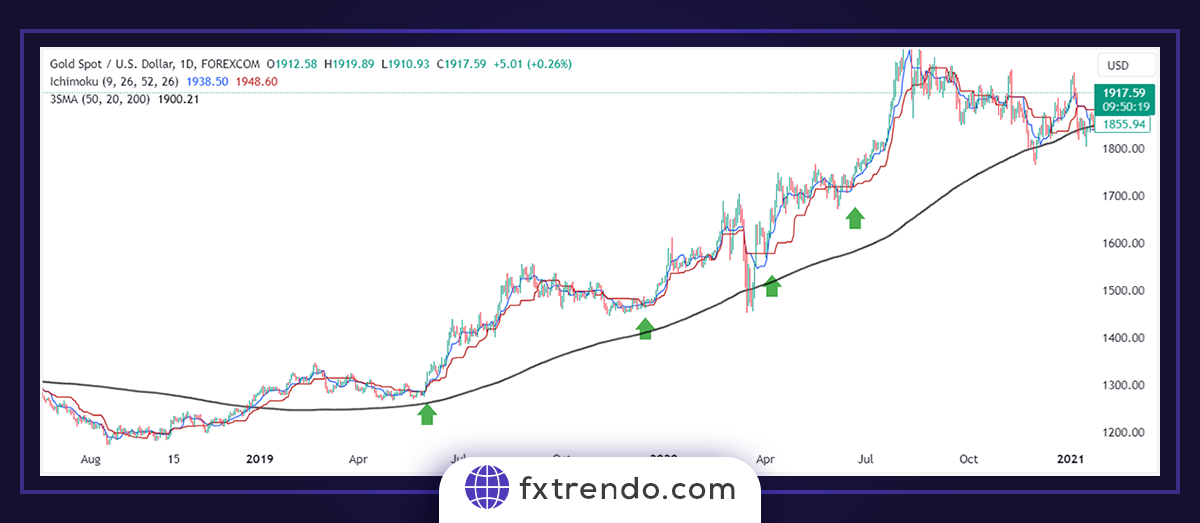
Ichimoku and 200 moving average:
There is a downtrend if the moving average line is above the price. Likewise, if the moving average line is below the price, the market is in an uptrend. In this combination, if the MA falls below the price, we should wait for the Tenkan and Kijun lines to cross below the price to enter the buy trade. Likewise, if the MA is above the price, we look for Ichimoku lines to cross the price upward.
Read More: Moving average indicator, a powerful tool in technical analysis.
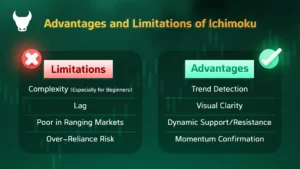
Advantages and Limitations of Ichimoku
Ichimoku offers a holistic view of market dynamics, but like any tool, it has trade-offs. Weigh these to integrate it effectively into the Ichimoku strategy.
Key Advantages of the Ichimoku Strategy
- Trend Detection: Instantly identifies bullish (price above cloud) or bearish (below cloud) trends, outperforming single-line indicators for directional bias.
- Visual Clarity: Delivers a “one-glance” chart overview with integrated lines and cloud, minimizing analysis time and emotional decisions.
- Dynamic Support/Resistance: Cloud edges provide adaptive levels that evolve with price, aiding precise stop-loss and target placement.
- Momentum Confirmation: Crossovers and Chikou Span alignments filter weak signals, boosting trade accuracy in trending markets.
Key Limitations of the Ichimoku Strategy
- Complexity (Especially for Beginners): Five intertwined components overwhelm novices—requires 50+ hours of practice to interpret signals confidently.
- Lag: 26-period calculations delay entries in volatile markets, often missing early reversals like Chikou trailing behind price.
- Poor in Ranging Markets: Generates false signals (whipsaws) inside thin clouds during low-volatility periods—avoid in choppy pairs like EUR/CHF.
- Over-Reliance Risk: Ignores fundamentals; customization can lead to curve-fitting without backtesting.
Common Mistakes When Trading with Ichimoku Strategy
Even seasoned traders trip over Ichimoku pitfall; here’s how to sidestep them for more accurate setups and fewer blowups. Focus on discipline and journal your trades to spot patterns.
- Early Entry on Weak Signals: Jumping in on a Tenkan/Kijun crossover without cloud confirmation leads to whipsaws.
Point: Wait for the price to close above/below the Kumo edge.
Example: If crossover happens inside the cloud, hold off because backtests show 40% false signals here. Use Chikou Span clearance as your green light.
- Trading in Ranging Markets: Forcing trends when lines flatten and price hugs the thin cloud drains accounts via chop.
Point: Measure cloud thickness (Senkou A-B spread >20 pips on H4); skip if under. Pair with ADX (>25 for trends) to filter—demo this on EUR/USD ranges for practice.
- Ignoring Other Confirmations: Solo Ichimoku reliance misses context, like news spikes overriding signals.
Point: Layer RSI (over 50 for longs) or volume surges. For crossovers, check higher timeframes first—e.g., H1 entry only if daily cloud aligns. This cuts losses by 25%.
- Overcomplicating with Custom Settings: Tweaking 9/26/52 for “edge” often curve-fits to noise.
Point: Stick to defaults; test deviations on 200+ historical charts. If adapting for crypto (shorter periods), validate with walk-forward analysis.
Summary
Trading with the ichimoku forex can be a profitable and effective strategy for traders who understand this indicator and how to use it. The forex Ichimoku trading system provides a comprehensive market view and helps traders identify potential trends, support and resistance levels, and entry and exit points. However, traders should always use proper risk management techniques and not rely only on the Ichimoku indicator to make trading decisions.