

The forex market is a vast and dynamic financial ecosystem where trillions of dollars move daily, providing many opportunities for traders. However, operating in the complex forex world requires more than a basic understanding of currency pairs and trading strategies.
Understanding what is market structure in trading and learning how to properly analyze market structure is one of the most valuable skills any forex trader can develop—it provides a clear, objective framework for identifying market structure in forex with precision and confidence.
This comprehensive article provides a step-by-step guide to understanding market structure forex, mastering the fundamentals of how to analyze market structure, and applying practical market structure trading strategies that can be used in your daily trading activities.
What Is Market Structure in Forex?
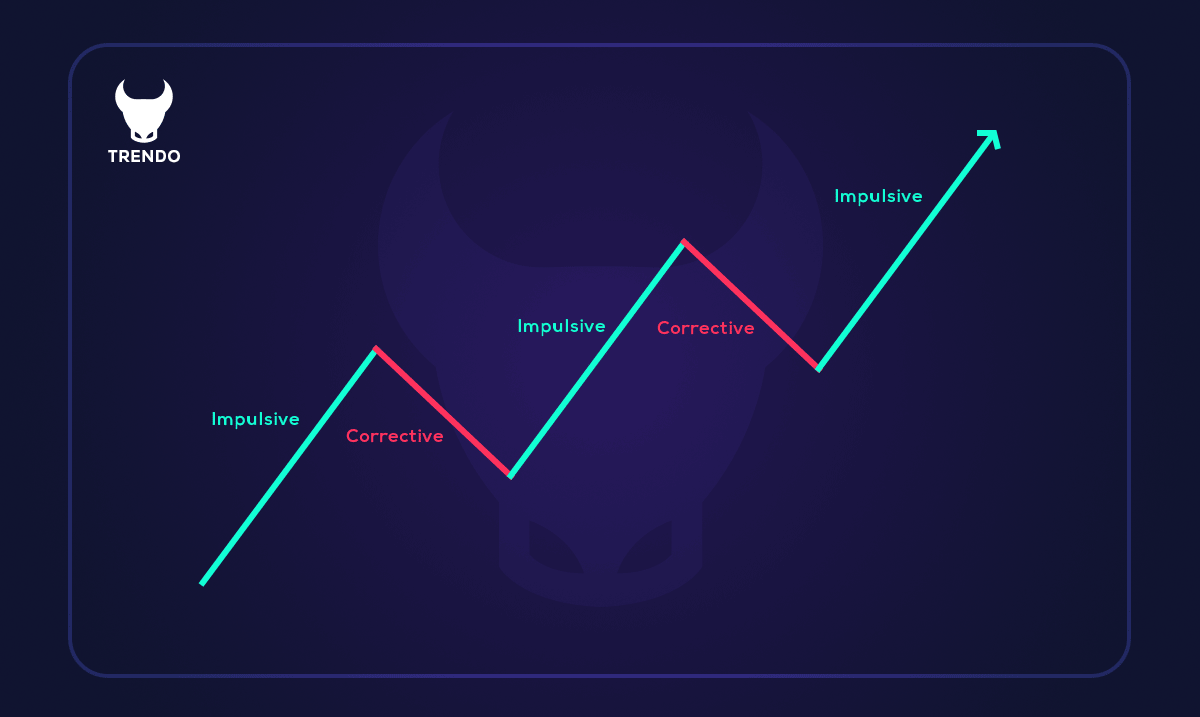
Market structure is the price-action “blueprint” of the market—the sequence of swing highs and lows that maps which side (buyers or sellers) has control at any moment. If you’re asked what is market structure in forex trading, picture a live chart forming stair-steps: higher-high/higher-low ladders signal a bullish phase, lower-low/lower-high ladders a bearish one, and flat tops and bottoms a range. Price itself builds this structure because every executed order shifts the balance of supply and demand; the pattern we see is simply the running total of those imbalances.
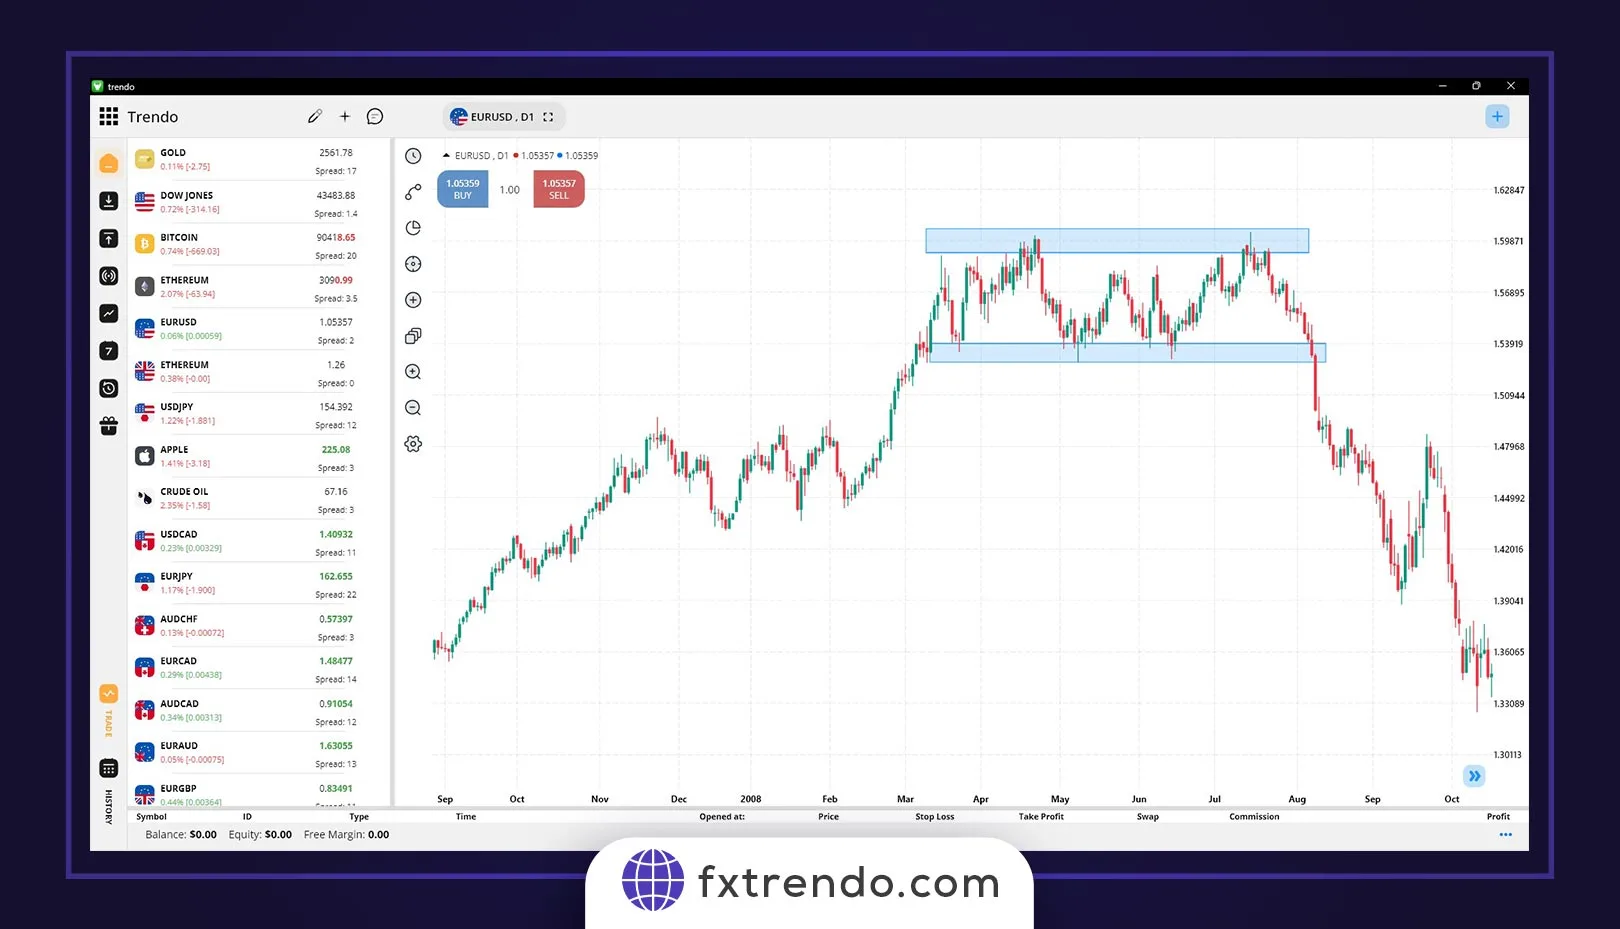
That blueprint is not random. Large institutions—banks, funds, and liquidity providers—must accumulate positions gradually. Their buying pushes price up through prior highs, and their profit-taking or hedging drives it down through prior lows. Reading fx market structure therefore offers a real-time window into institutional behaviour: impulsive moves mark aggressive accumulation or distribution, while corrective pullbacks reveal areas where they reload. The accompanying image of alternating bullish and bearish waves illustrates this ebb-and-flow—notice how each break of a previous swing level confirms which group is in command and gives retail traders a logical reference for entries, stops, and targets. In the example below, you can see what we explained. In the example below, you can see what we explained.
Read More: Fractal approach and key rules in Elliott wave theory
Types of Trends
In market structure trading, correctly identifying whether price is trending up, trending down, or consolidating in a range lays the foundation for every trade decision that follows.
Uptrend
In an uptrend, price prints a series of higher highs and higher lows—one of the clearest forex market structure patterns. Each bullish swing shows that demand is outpacing supply. Traders using market structure trading look for pullbacks that respect the last higher low: if the retracement holds above that level and volume fades, it signals institutions are still accumulating, and the trend is intact.
Downtrend
A downtrend is the mirror image: lower lows and lower highs reveal persistent selling pressure. The structure warns that rallies are likely to be short-lived distribution phases rather than true reversals. Stops often sit above the last lower high, so a clean break there hints that sellers have lost control and the bias may flip.
Ranging Market
When neither side dominates, price oscillates between horizontal support and resistance, forming a box-style range. Recognising this “pause” in market structure in forex trading helps you avoid chasing false breakouts. Smart money typically accumulates inside the range’s lower half and distributes near the top, setting the stage for the next trending leg once price finally escapes the box.
Key Elements of Market Structure
Swing Highs & Swing Lows
The backbone of market structure forex analysis is the zig-zag of swing highs and swing lows. Each peak or trough marks a point where the balance of orders flipped. Plotting these turning points lets you see forex market structure patterns—bullish stair-steps, bearish cascades, or flat-topped ranges—and judge whether momentum or exhaustion is building.
Support and Resistance Levels
Connect two or more aligned swings and you reveal horizontal barriers where price reacts repeatedly. Support (floor) emerges where buyers absorb supply; resistance (ceiling) forms where sellers cap demand. Knowing what is forex market structure means treating these levels as potential entry zones, profit targets, or invalidation points rather than fixed “must-hold” lines.
Supply and Demand Zones
Zoom out from single levels to clusters of unfilled orders. A demand zone sits below price after a sharp rally—evidence of aggressive institutional buying. A supply zone rests above price after a steep drop, signalling distribution. When price revisits such zones, it often pauses or reverses as pending orders get filled, offering high-probability trade locations.
Liquidity Areas (Equal Highs/Lows)
Equal highs or lows attract liquidity: breakout traders stack stop orders just beyond, while larger players eye those pools to fill size. A sweep through equal highs may spike upward, grab stops, then reverse if underlying structure remains bearish. Spotting these “magnet” levels helps you avoid being the liquidity and position yourself with it.
Phases of the Market
Every price cycle moves through accumulation, manipulation, and distribution—three phases that expose how institutional order-flow molds fx market structure before the next trend emerges.
Accumulation
After a down-move, smart money often buys quietly within a tight range, leaving price flat while volume shows subtle upticks. This “inventory-loading” phase is invisible to most retail traders but is critical to grasp when asking what is market structure in forex trading—it sets the stage for the next trend.
Manipulation (liquidity grabs)
Once positions are built, large players frequently sweep nearby stops to harvest liquidity. A fast spike below range lows (or above highs) entices breakout traders, then snaps back. Recognising this trap inside fx market structure keeps you from chasing false moves and instead positions you with the institutions.
Distribution
After the markup, price stalls again while volume stays elevated; this is the mirror image of accumulation. Smart money off-loads longs into late buyers, printing lower highs inside the range. A decisive breakdown from the distribution zone signals the transition into a bearish trend, completing the classic Wyckoff cycle.
Breakdown of Structure (BOS)
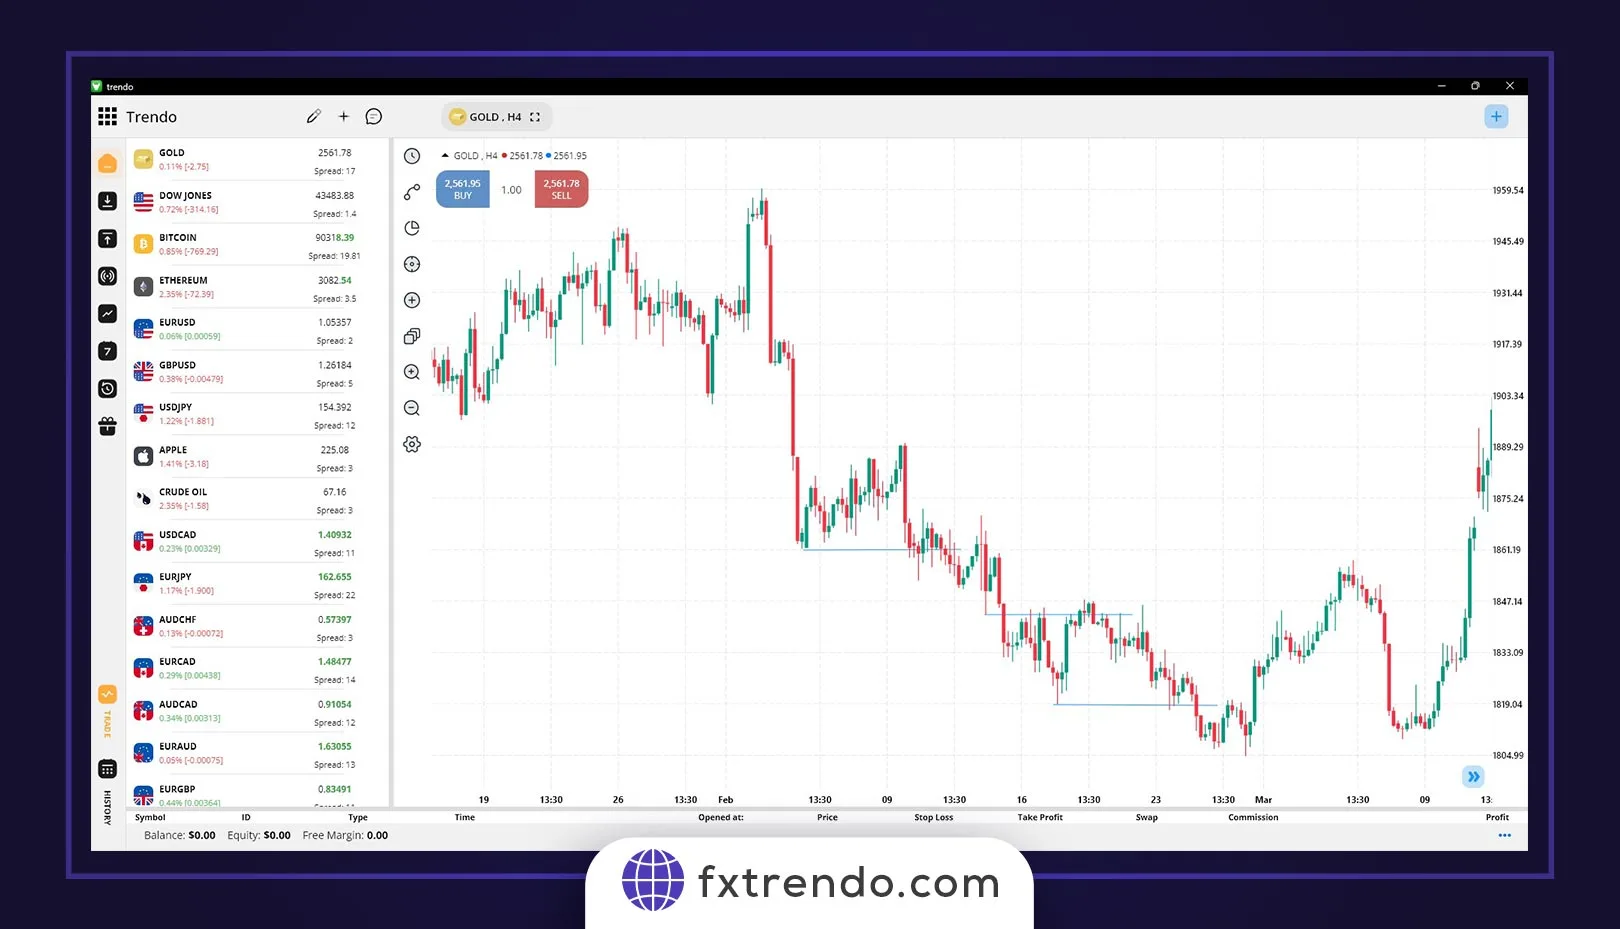
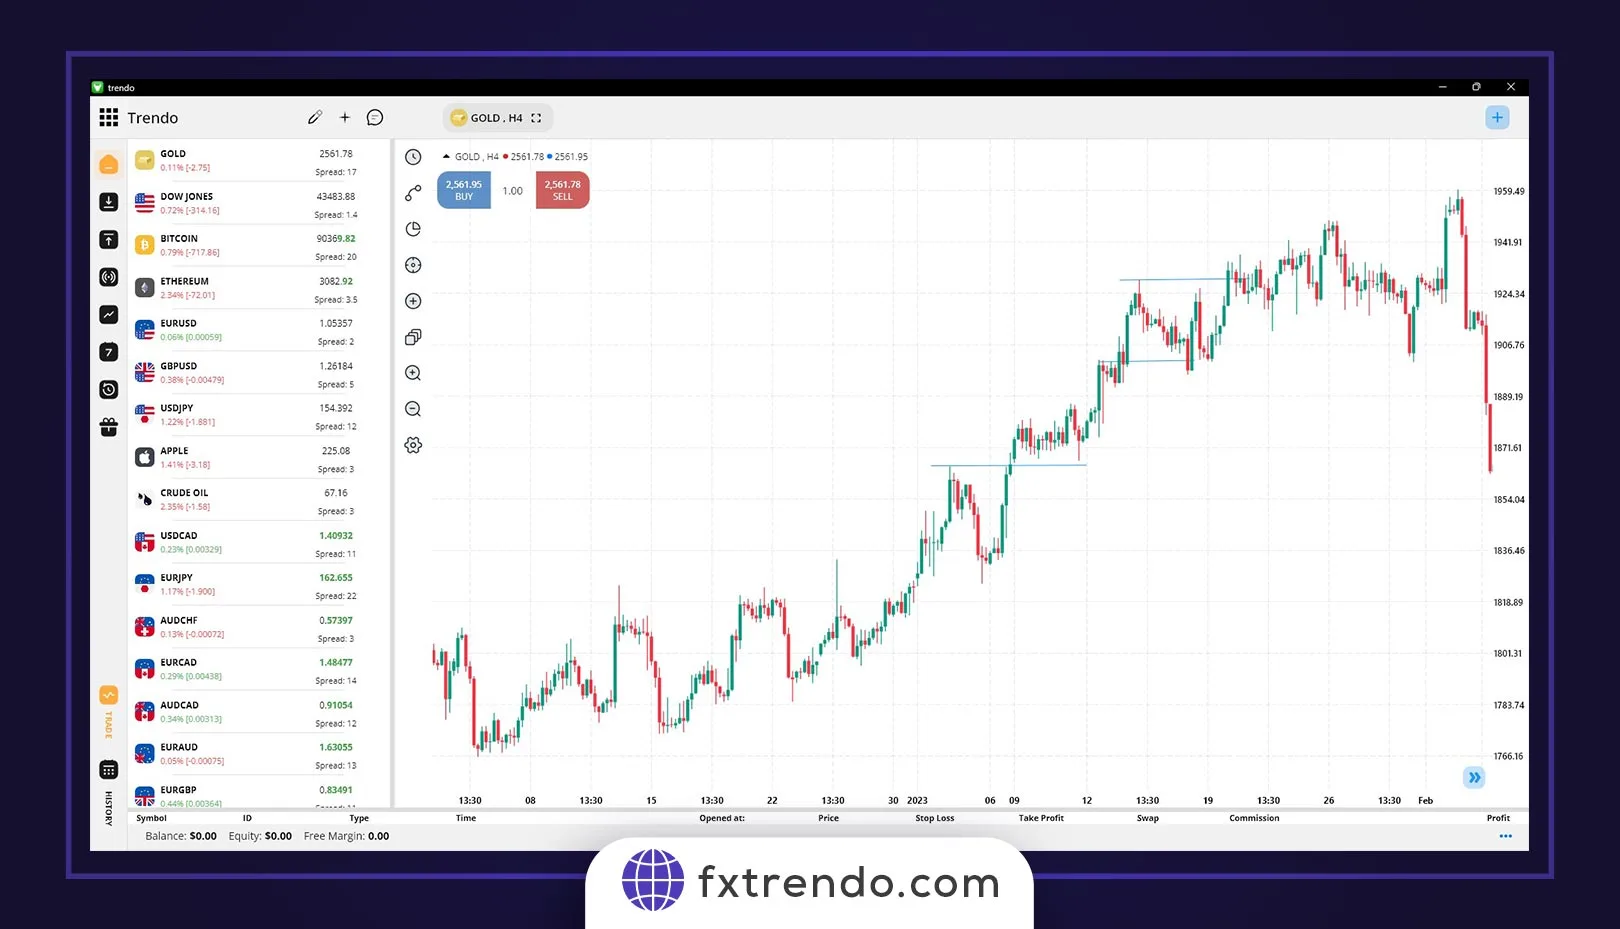
In a specific trend, for example, in a downtrend, when the price crosses the previous floor to create a new floor (LL), a breakdown of structure has occurred, and similarly, in an uptrend, a break in A structure or BOS occurs when the price rises and rejects its most recent high. The crucial point in identifying the trend is that we need at least one BOS to confirm a trend. Note that the previous ceiling or floor’s crossing must occur with the close of one candle, and we need to close at least one candle after that level to create and confirm a BOS. Stay further with two examples of descending and ascending BOS. We see a long-term bearish trend in the first example, which is from the global symbol of gold (XAUUSD). Maybe you want to do trades on gold, but your concern is to find a broker for trading gold . You can easily use the services of Trendo Broker to trade in gold by registering with the Broker.
Change Of Character (CHOCH)
Change of Character is another concept you should know in structureology. A change in the structure is the first sign of a change in the trend. In other words, a process ends with CHOCH. For example, in a downtrend, the price moves down with the BOS of the price floor. The presence of BOS during a trend indicates the strength of that trend. But suddenly, the price rises and rejects the last formed ceiling. In this case, a change in the structure (CHOCH) has occurred, and we can say that the market structure has changed from bearish to bullish, but it does not mean that you should enter into a buy trade. In fact, after creating CHOCH, you have to wait until a BOS is created for the uptrend and the uptrend is confirmed. Note that to confirm a CHOCH, unlike BOS, we do not necessarily need a candle close, and crossing the previous ceiling or floor with the candle shadow is also sufficient. Below, you can see examples of descending and ascending CHOCHs:

Range Market
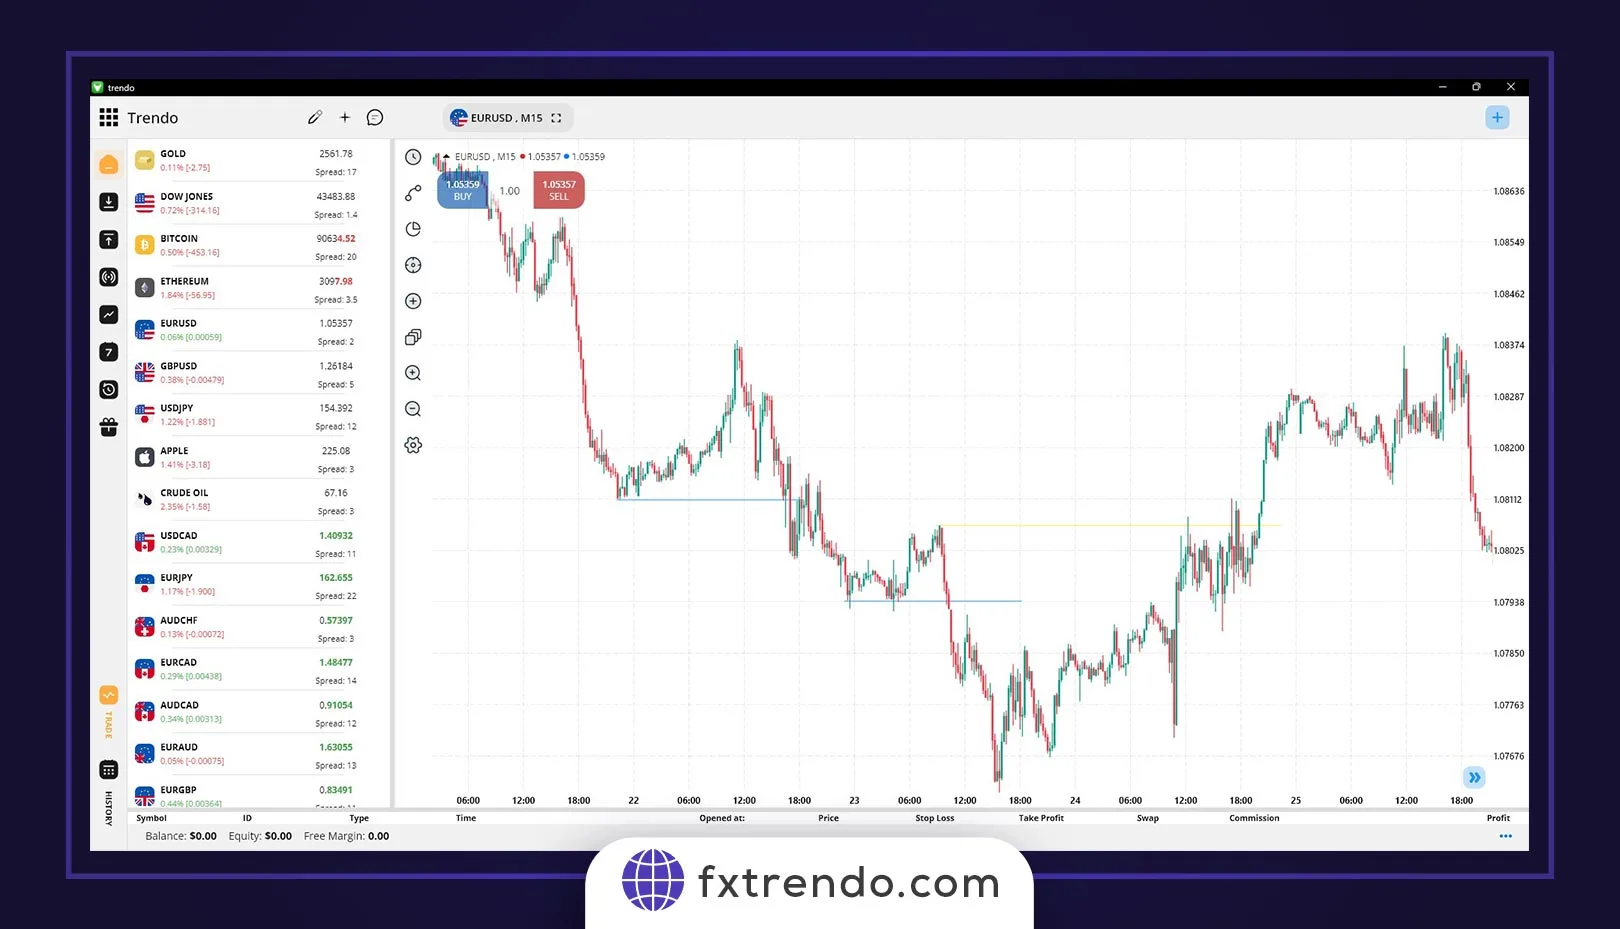
In addition to the bullish structure and the bearish structure we introduced, the third mode created in most cases in the market is the ranging or turbulent structure. In this case, the power of buyers and sellers is almost equal, and there is no special trend in the market. Many traders believe that the market is ranging 80% of the time. So, you must be very patient to start a trend. The crucial point in trading is that if you cannot easily determine the market trend, it is probably a ranging market, and in this case, it is better not to enter the trade, but if you are going to trade in a ranging market, the conventional strategy is to sell at the last high and buy on the last low. In short, BLSH (Buy Low, Sell High). For example, in the image below of the EURUSD currency pair, we see a range structure in the 30-minute timeframe that you could make a good profit with the BLSH strategy. However, note that trading in the ranging market requires a lot of skill and experience, and we recommend that you do these trades with a low volume at first.
How to Analyze Market Structure: A Step-by-Step Guide
While analyzing market structure in forex trading may seem overwhelming at first glance, a structured, methodical approach transforms it into a simple yet incredibly powerful trading tool. This section provides a practical, actionable guide that any trader—whether beginner or professional—can apply to any currency pair and any timeframe. Understanding what is market structure and mastering the skills to identify it separates successful forex traders from those who struggle.
Step 1: Identify and Mark Swing Points
The first and most fundamental step in analyzing market structure is identifying the key highs and lows on your price chart—these are called Swing Highs and Swing Lows. These points form the geometric foundation of your entire forex market structure analysis and should never be overlooked.
- Open the timeframe you’ve chosen for trading (for example, a 4-hour or daily chart). Consistency in timeframe selection is crucial when learning how to analyze market structure.
- Mark the local highs (where price has risen to a peak and then reversed downward) and local lows (where price has fallen to a trough and then reversed upward) using circles, arrows, or horizontal lines on your chart.
- Connect these points mentally or with drawn lines to visualize the overall geometric pattern and trend of the market structure. This visual representation will make it easier to understand the flow of price.
Practical Example: Suppose you’re analyzing the EURUSD daily chart and you observe consecutive swing highs at 1.0850, 1.0920, and 1.0980. These ascending highs represent the first clear indication of an uptrend market structure forming, showing that buyers are consistently pushing price higher.
Step 2: Identify Trend Direction
Now that you’ve marked your swing points, the next step in how to analyze market structure is determining which direction the overall market structure is moving:
- If swing highs and lows are both increasing over time (each new high is above the previous high, and each new low is above the previous low), the market structure is in an uptrend or bullish market structure.
- If swing highs and lows are both decreasing over time (each new high is below the previous high, and each new low is below the previous low), the market structure is in a downtrend or bearish market structure.
- If highs and lows are fluctuating within a fixed horizontal range without consistently moving higher or lower, the market structure is in consolidation or a range-bound phase.
Key Point: This is critical when analyzing market structure: Do not change your interpretation of the overall market structure direction based on minor price fluctuations. Wait for a clear, confirmed break of structure (BOS) before concluding that the primary market structure has shifted.
Step 3: Recognize Pullbacks and Corrections
One of the most practical and profitable applications of market structure analysis in trading is identifying corrections—temporary price movements against the primary trend direction. These pullbacks often create the best low-risk entry opportunities for traders aligned with the main market structure.
- After a strong impulsive move in the direction of the primary trend (sometimes called an “impulse wave”), wait for price to pull back temporarily in the opposite direction. This is entirely normal and expected market behavior.
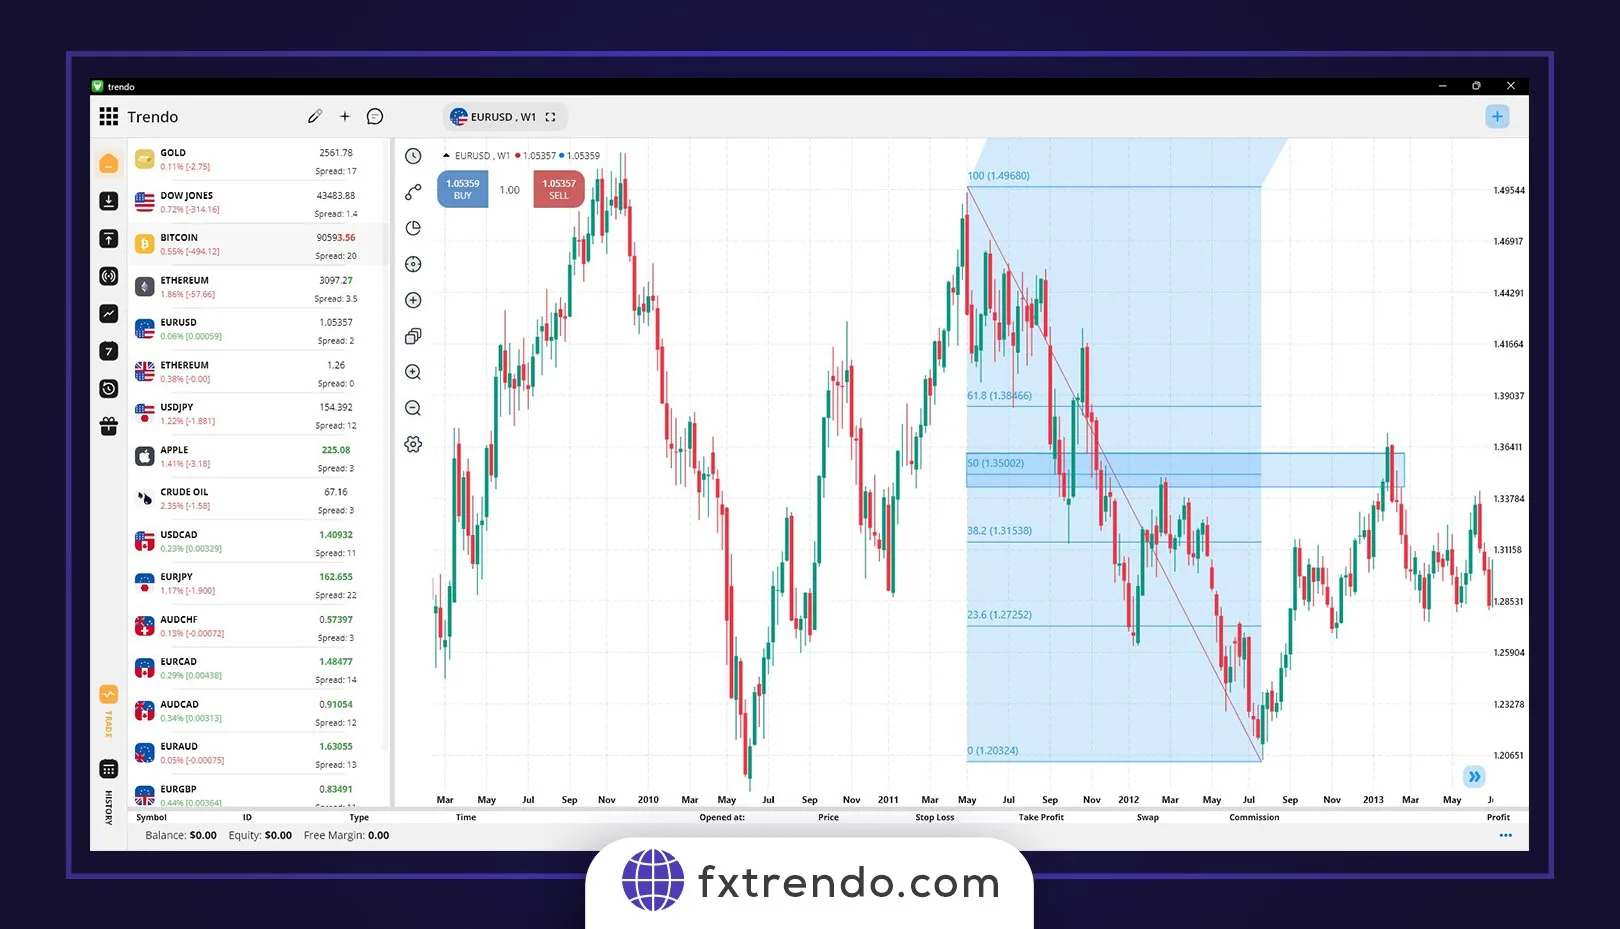
- Use Fibonacci retracement levels to anticipate where the pullback may conclude—pullbacks typically end between the 23.6% and 61.8% retracement levels of the last impulsive move within the market structure.
- Look for confirmation signals at the suspected pullback area, such as specific candlestick patterns (Pin Bar, Engulfing, Hammer, or Shooting Star) or price bouncing off a previously established support or resistance level.
Practical Example: Imagine gold (XAUUSD) rallies strongly from $2,050 to $2,100 USD (a clear impulsive move in the uptrend market structure), then pulls back to approximately $2,075 USD (representing a 50% Fibonacci retracement). If at this level a bullish Hammer or Pin Bar candlestick pattern forms, this is a high-probability pullback entry setup fully within your bullish market structure analysis.
Step 4: Spot Breaks of Structure (BOS)
A break of structure is the moment where the market structure formally confirms the continuation of the existing trend or signals the beginning of a new phase. Understanding how to identify BOS is absolutely essential to trading market structure correctly.
- In an uptrend market structure: A BOS occurs when price closes above the most recent swing high with a complete candlestick. This shows the bullish market structure is continuing.
- In a downtrend market structure: A BOS occurs when price closes below the most recent swing low with a complete candlestick. This confirms the bearish market structure is intact.
- Critical Point: Do not consider a break of structure confirmed until: (1) the candle that breaks the level has fully closed, and (2) ideally one or more subsequent candles have also closed beyond the broken level. Premature entry based on incomplete candles will damage your trading results.
Practical Example: On the EURUSD daily chart, the previous swing high was established at 1.0850. Price then rises and closes above this level (say at 1.0865) with a complete daily candlestick. The next day, the candlestick also remains above 1.0865. This is a confirmed bullish break of structure—you now have clear evidence that the uptrend market structure is continuing higher.
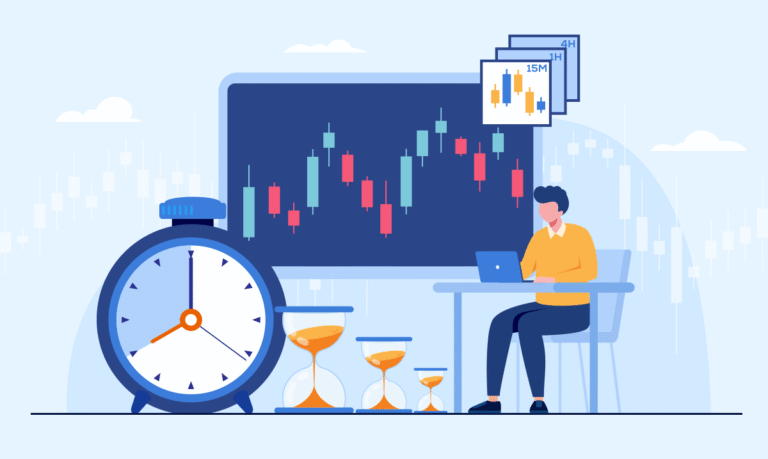
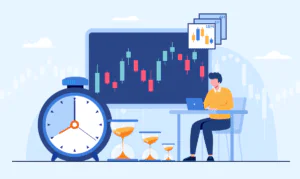
Step 5: Confirm with Multi-Timeframe Analysis
One of the most critical—and most frequently ignored—mistakes traders make is analyzing market structure in isolation on a single timeframe. Multi-timeframe analysis dramatically increases the probability and quality of your trades:
- First, identify the primary market structure on a larger timeframe (e.g., the 4-hour or daily chart) to understand the major trend direction. This becomes your reference point.
- Then zoom to a smaller timeframe (e.g., 1-hour or 15-minute chart) to find precise entry points using pullbacks and BOS that align perfectly with the larger timeframe’s primary trend.
- Critical Rule: If the larger timeframe shows uptrend market structure but the smaller timeframe shows downtrend market structure, do not trade yet. Wait for alignment. Trading against the primary market structure often results in losses.
Practical Example: The GBPUSD daily chart clearly shows uptrend market structure with higher highs and higher lows. However, when you zoom to the 15-minute chart, you notice that price is currently in a downtrend correction—lower highs and lower lows on that smaller timeframe. Instead of entering a trade immediately on the 15-minute downtrend, wait for a break of structure on the 15-minute chart that realigns it with the uptrend on the daily chart. Once you see that bullish BOS on the 15-minute chart confirming the primary uptrend from the daily, that’s the high-probability moment to enter your trade with maximum confidence.
How to enter the trade
Now that we analyzed the market structure and identified the trend. How should we enter into the trade?
It’s simple! After identifying and confirming the trend, you should try to enter a trade in the trend direction at the end of a corrective movement. But the main question is how to recognize the end of a corrective movement. Further, we intend to address this point.
The following methods are usually used to identify the end of a corrective movement:
- Block order
- Fibonacci 50% and 61.8%
- Moving Average
- Trend lines
Block order: When we are in a confirmed trend, and the price starts to correct, identify block orders in the last impulsive move. These price levels have a high potential for price reversals, and usually, corrective movements end by hitting a block order, and a new impulsive movement begins.
Fibonacci 50% and 61.8%: One of the other crucial levels that can return the price and end corrective movements are the 50% and 61.8% Fibonacci levels. Simply put, when the price corrects 50 or 61.8% of its last impulsive movement, we can expect a reversal and the start of a new impulsive movement. For example, in the image below of the gold symbol (XAUUSD), we see a bearish trend in the daily timeframe. Further, the price has retraced to the 61.8% level of the last movement, and since, the price has reached a strong resistance level (gray area) in addition to the 61.8% Fibonacci level, traders have entered a sell trade in the trend direction with more confidence after the confirmation candle closes.
Moving Average: Some traders use moving averages with usually 50 or 100 periods to identify the end of corrective movements. So, the price hitting these levels in the corrective phase is considered a sign of the corrective movement’s end.
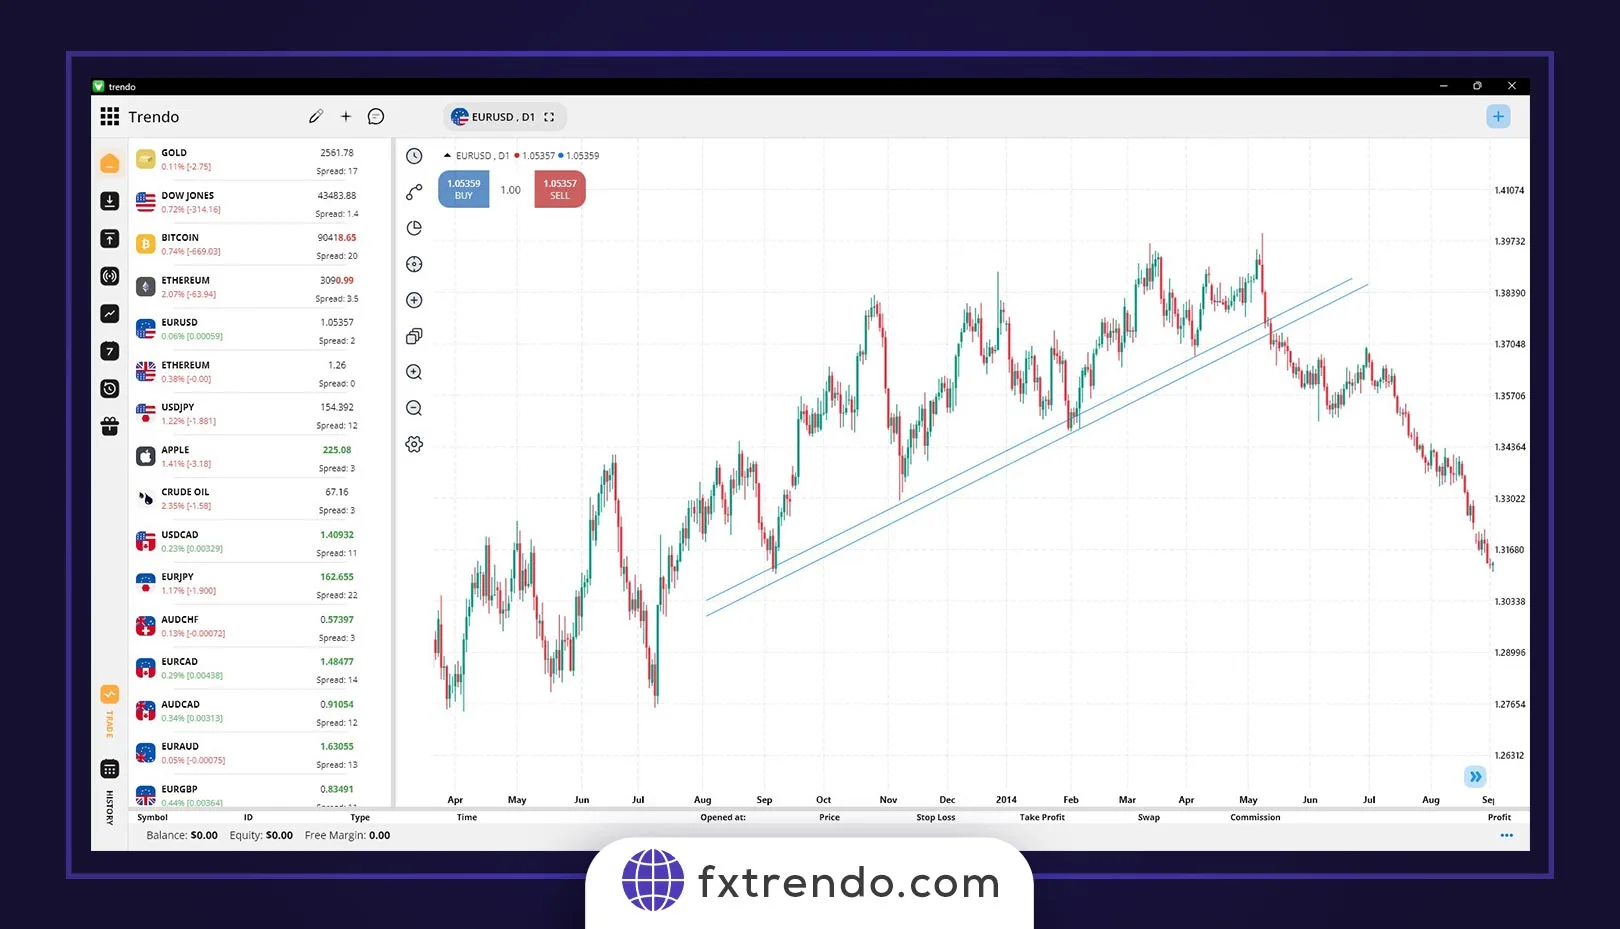
Trend lines: Another tool to find the possible correction endpoint is where the price meets the trend line, which is drawn with the help of the trend’s previous two lows or two highs. For example, in the image below of the SPX500 index, we see an uptrend in the one-hour time frame. Further, the price has corrected up to the trend line drawn from the main floors, and traders at this level have entered into a buy trade after closing the confirmation candle.
Here, we introduced helpful methods for identifying the end of a corrective movement. Note that in most of these methods, candlestick patterns are used to confirm the final entry into the trade after the price hits the determined level.
Key points in identifying market structure
- Recognizing the end of a corrective movement requires experience, patience, and a lot of practice.
- After creating a BOS, we usually expect a pullback.
- The structure of larger time frames is more valid than smaller time frames.
- Always trade in the trend direction. Trading against the trend will eventually take you out of the market.
- Never enter a trade before identifying a trend. You’re probably in a ranging market when you can’t identify a market trend. In such cases, the best thing to do is to wait to start a new trend.
Common Mistakes for Beginners
Even a solid market-structure plan can unravel quickly if beginners misidentify swings, chase false BOS moves, tunnel-vision on tiny charts, or trade patterns divorced from the wider market context.
Mislabeling Swings
New traders often tag every minor retrace as a swing high or low, crowding the chart and warping trend bias. Focus on the clearest pivot that actually broke structure; ignore wiggles that don’t shift control.
Confusing BOS with Liquidity Sweep
A single spike through a prior high is not a true Breakdown of Structure if price snaps back moments later. Wait for a candle close and follow-through; otherwise you’ve just watched institutions harvest stops.
Over-zooming on Small Timeframes
Dropping straight to the 1-minute chart magnifies random noise that has little bearing on the 4-hour trend. Anchor your bias on a higher timeframe, then refine entries one or two steps lower.
Ignoring Market Context
Structure doesn’t live in a vacuum—news releases, session overlaps, and macro levels all shape behaviour. A textbook pattern printed during the quiet Asian session may collapse once London liquidity hits. Always confirm that the broader context supports the idea.
Summary
In this article, we embarked on a journey to understand the concept of market structure in forex and explored ways to identify market highs and lows, breakouts of structure (BOS), and change of character (CHOCH). Also, we provided discussions on how to enter trades and confirm them. Generally, understanding the market structure is of great importance. With a deep understanding of the market structure and the ability to recognize trends and their changes, traders can make better decisions and increase their probability of success.