In financial markets, the core idea behind Fibonacci retracements and extensions is based on the theory that price movements follow specific ratios derived from the Fibonacci sequence. The most commonly used ratios in this context are 23.6%, 38.2%, 50%, 61.8%, and 100%. These levels are critical when identifying potential reversal zones in both upward and downward trends.
Whether you’re a beginner or a seasoned trader, understanding this concept could help you make more informed and confident decisions in your market strategies. Let’s dive in and explore how these powerful techniques come together.
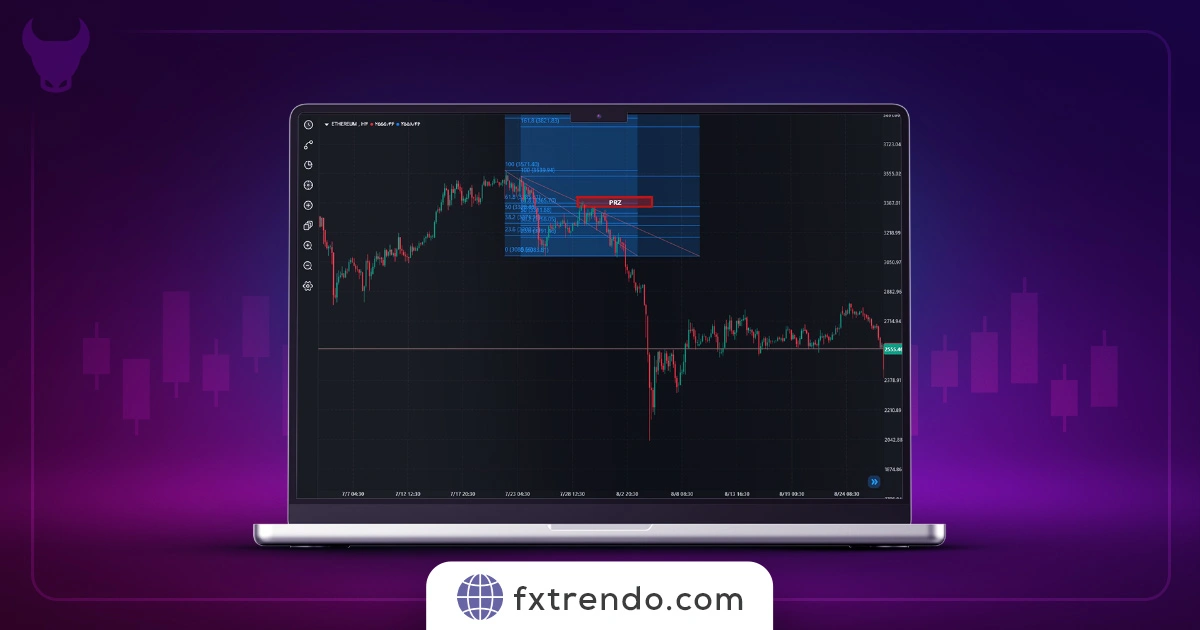
How Does Fibonacci Help Identify the PRZ Zone?
Fibonacci levels are powerful tools in technical analysis because they help traders identify potential areas where price reversals may occur. These levels are calculated based on previous price movements and show areas where the price is likely to experience a reversal or retracement. When multiple Fibonacci levels converge in a specific area, that zone is considered a PRZ, indicating a higher probability that the price will change direction.
The key to identifying a PRZ with Fibonacci lies in the convergence of different Fibonacci levels. The more Fibonacci levels that overlap in a specific range, the stronger the potential for a price reversal at that point. For example, if both Fibonacci retracement and Fibonacci extension levels align in the same area, the likelihood of a reversal increases significantly.
Fibonacci retracement levels are typically used to identify potential reversal points during a price correction. These levels help pinpoint areas where the price might pause or change direction as it moves temporarily against the prevailing trend. On the other hand, Fibonacci extensions are used to project potential price targets during strong, trending movements. When both of these Fibonacci tools align in the same zone, it signals a high probability of price reversal, creating a stronger PRZ.
By using Fibonacci in this way, traders can effectively identify key price zones where trends may reverse, allowing them to enter or exit trades with greater confidence and accuracy.
Applications of Fibonacci in Identifying the PRZ Zone
Applications of Fibonacci in Identifying the PRZ Zone
Fibonacci tools are invaluable for traders when identifying PRZs. By using various Fibonacci levels, traders can pinpoint areas on price charts where the likelihood of a reversal is high. Let’s take a look at how three key Fibonacci tools—Retracement, Extension, and Projection—are applied to identify PRZs.
Fibonacci Retracement
Fibonacci retracement is widely used to identify potential reversal points within a price correction. During an uptrend, for example, when the price begins to correct downward, traders use Fibonacci retracement levels to determine where the price might reverse and continue upward.
The key Fibonacci retracement levels to watch are typically 38.2%, 50%, and 61.8%. When these levels are close together in a specific range, it increases the likelihood of a price reversal from that area. The closer these levels align, the stronger the potential PRZ becomes. This tool is particularly helpful when the market is in a temporary correction within a larger trend.
Fibonacci Extension
Fibonacci extension is used by traders to forecast the next potential price target after a price has bounced from a retracement level and resumed its original trend. While retracement levels help identify possible reversal points within a correction, Fibonacci extension levels project where the price may move once it continues its trend.
Key extension levels include 127.2% and 161.8%, and when these levels coincide with other technical indicators or support and resistance areas, the chances of a price reversal increase significantly. Traders rely on these levels to predict where price movements might reach their next high or low.
Fibonacci Projection
Fibonacci projection is another important tool for identifying PRZs, particularly when it comes to determining the end of one price wave and the beginning of the next. This tool is widely used in harmonic patterns, where it helps traders predict the completion of specific price cycles.
When Fibonacci projection levels overlap with other Fibonacci tools—such as retracements or extensions—it creates a strong signal for a PRZ. This overlap serves as an indicator that a reversal may be on the horizon, making the PRZ more reliable.
Combining Fibonacci Tools for Stronger Signals
The true power of Fibonacci in identifying PRZs comes from combining these tools. When Fibonacci retracement, extension, and projection levels align in the same zone, it strengthens the potential for a price reversal. By recognizing these confluence points, traders can improve their chances of accurately predicting price movements and make more informed trading decisions.
Importance of Combining Fibonacci with Other Technical Tools
While Fibonacci tools are powerful in identifying PRZs, relying on them alone may not be enough to make informed trading decisions. To enhance the accuracy of Fibonacci-based analysis, traders should combine Fibonacci levels with other technical tools such as candlestick patterns, divergences, and volume indicators. These additional tools provide crucial confirmation and validation, making the identified PRZ more reliable.
Candlestick Patterns for Confirmation
Candlestick patterns are highly effective in confirming potential reversals. For instance, if the price approaches a key Fibonacci retracement level, and at the same time, a reversal candlestick pattern like a Bullish Engulfing or Hammer forms in that zone, it strengthens the probability of a price reversal.
Candlestick patterns are visual signals that help traders identify market sentiment, and when they appear near Fibonacci levels, they act as confirmation that the price may indeed reverse in that area. Combining Fibonacci with candlestick patterns offers a more robust prediction of where price changes could occur.
Divergence
Divergence is another powerful tool for validating a PRZ. Divergence occurs when the price moves in one direction, but technical indicators (such as the Relative Strength Index or MACD) move in the opposite direction. This mismatch can signal a weakening trend and a potential reversal.
When divergence occurs near a Fibonacci level or a PRZ, it acts as a strong indication that a change in trend is imminent. For example, if the price continues to make higher highs but an oscillator like the RSI shows lower highs, this divergence suggests the uptrend may be losing momentum, increasing the likelihood of a reversal.
Volume Analysis for Increased Accuracy
Volume analysis is also crucial when using Fibonacci to identify PRZs. A reversal at a Fibonacci level with high trading volume indicates strong market interest in the price change, making the reversal more likely to hold. On the other hand, low volume during a potential reversal might signal a weak price move that may not sustain itself. When volume and Fibonacci levels align, it provides extra confidence in the validity of the PRZ, giving traders more assurance in their decision-making process.
Combining These Tools for a More Reliable Strategy
By combining Fibonacci retracements, extensions, or projections with other technical indicators like candlestick patterns, divergence, and volume, traders can enhance the reliability of their analysis. These tools help confirm each other, reducing the chances of false signals and increasing the likelihood of a successful trade.
The confluence of multiple technical signals in a PRZ zone offers a more complete picture of market behavior, allowing traders to make well-informed decisions and improve their trading strategies.
Fibonacci Convergence Zones
One of the strongest signals for price reversal occurs when multiple Fibonacci levels converge at a single point. These points are referred to as Fibonacci convergence zones. These zones are typically identified by drawing multiple Fibonacci retracements and extensions across different waves. When these levels intersect, they indicate a high-probability area for a price reversal.
For instance, if within a specific area, the 38.2% Fibonacci retracement level and the 161.8% Fibonacci extension level converge, this area is recognized as a strong Potential Reversal Zone. The presence of multiple Fibonacci levels in such a zone significantly increases the likelihood of a trend change, providing traders with greater confidence to enter trades.
In trading, identifying these convergence zones can be a powerful tool. They act as a beacon, signaling that a significant move might be imminent. Traders often use these zones to set up entry and exit points, helping them to optimize their trading strategies and enhance their potential for profitability. Understanding and utilizing Fibonacci convergence zones can therefore be a valuable skill for any trader looking to improve their market analysis and decision-making.
So, keep an eye on these convergence zones, as they can be pivotal in spotting key market movements and making informed trading decisions!
Important Tips in Using Fibonacci to Find the PRZ Zone
When using Fibonacci analysis to identify the Potential Reversal Zone, there are several important tips to consider:
1. Combine Technical and Fundamental Analysis:
Alongside technical analysis using Fibonacci levels, incorporating fundamental analysis can serve as a confirming factor. If the fundamental analysis indicates a favorable condition for the asset, and the Fibonacci levels confirm that the price is in a reversal zone, the likelihood of a successful trade increases significantly.
2. Timing Matters:
Timing plays a crucial role in identifying the PRZ. The longer it takes for Fibonacci patterns to form, the more likely the reversal zone will be valid. For instance, analysis on higher timeframes, such as four-hour or daily charts, typically provides more accurate results.
By integrating these tips into your trading strategy, you can improve your ability to identify PRZ zones and make more informed trading decisions. Remember, a successful trading strategy often involves a combination of technical, fundamental, and time-based analysis.