The Dow Jones Index, after reaching new highs around 47,049 USD earlier this month, has experienced volatility and is currently trading within the 46,100–46,300 USD range. In this analysis by the Trendo educational team, we examine both the technical and fundamental aspects of the market to provide a more precise outlook on the current situation and future trends of the Dow Jones. You can also use the Trendo trading platform with its advanced analytical tools, professional charting features, and comprehensive trading capabilities to conduct your analyses with greater accuracy and confidence.
Technical Analysis of the Dow Jones Index
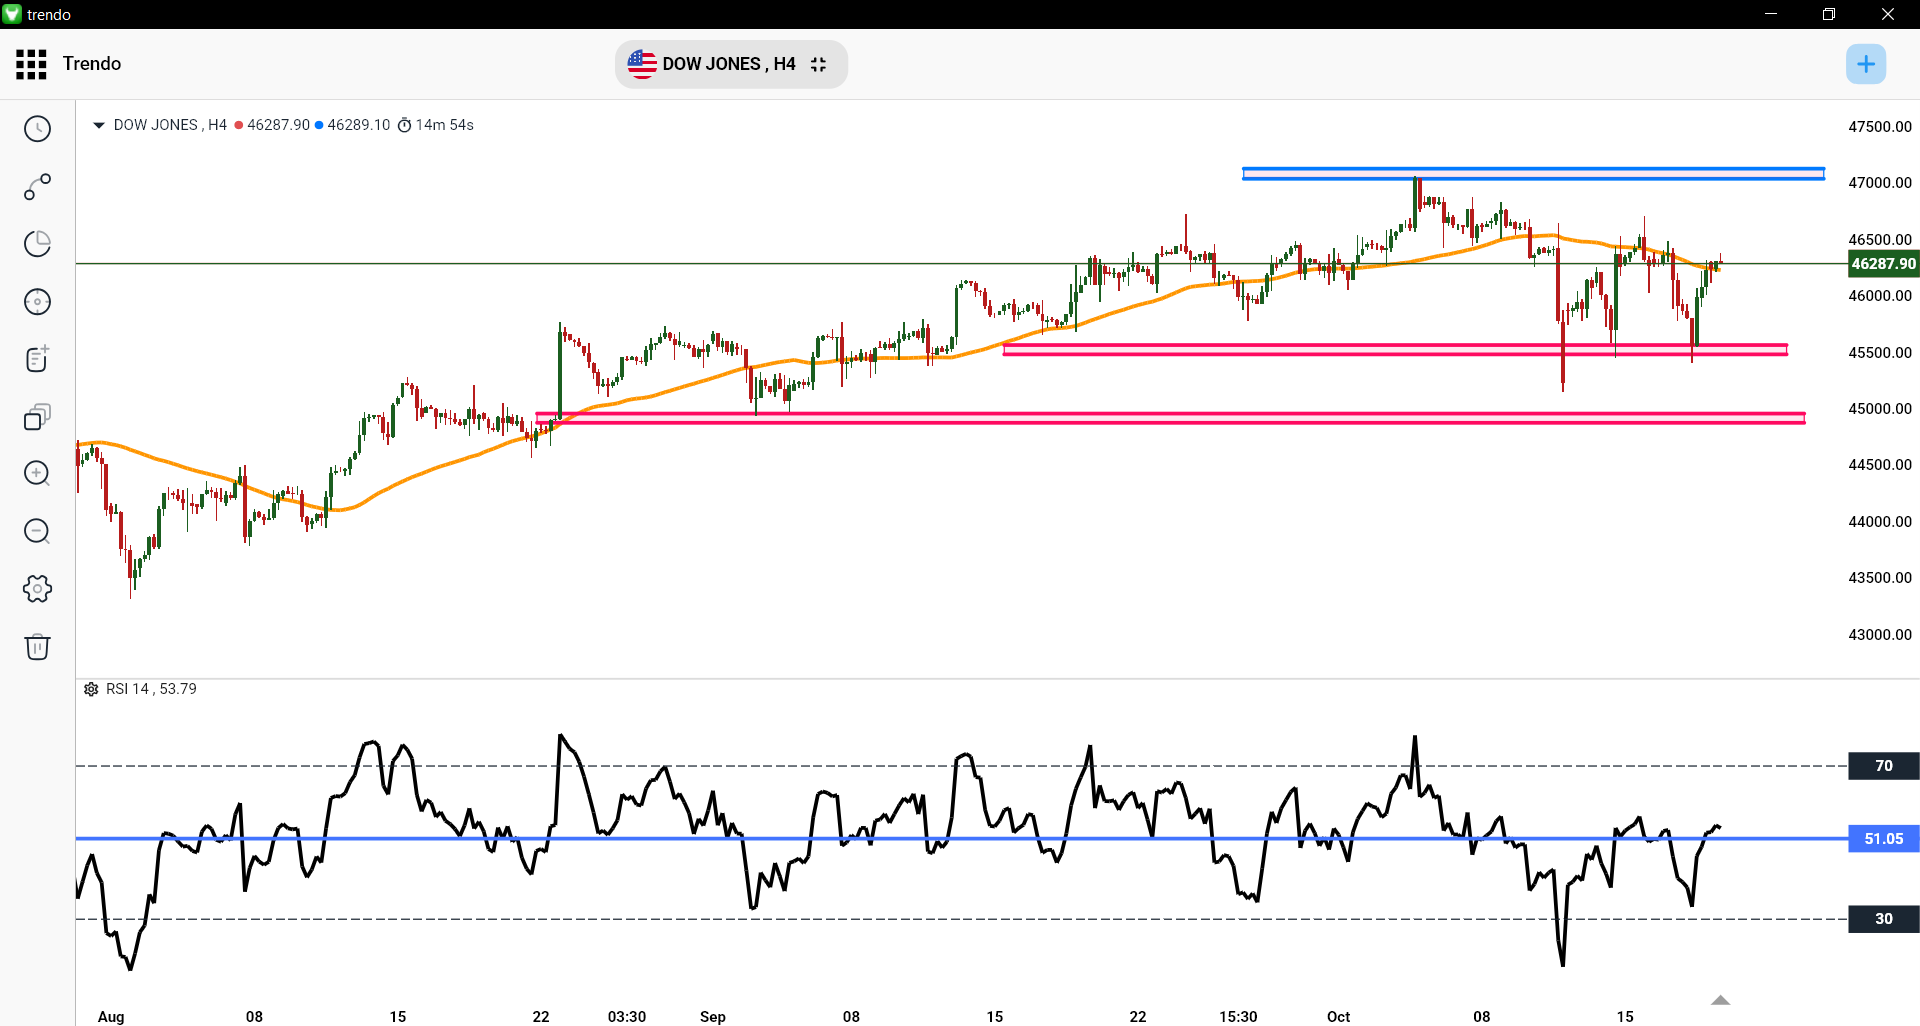
The Dow Jones Index is trading above the 50-period Simple Moving Average (SMA-50), a level currently acting as dynamic support, reinforcing the short-term bullish outlook on the 4-hour chart.
The RSI indicator, turning upward and stabilizing above the 50 level, signals improving momentum and increasing demand.
A broader evaluation of indicators shows a strong bullish condition:
Eight buy signals—including RSI at 61.74, a positive MACD, and ADX at 38.41—all support the continuation of the upward trend. Furthermore, all simple and exponential moving averages have issued buy signals, highlighting the potential for further growth.
Key Support and Resistance Levels:
- Support: 45,523 and 44,922
- Resistance: 47,049
Technical Analysis – Dow Jones (Trendo Trading Platform, H4 Timeframe)
Overall, while the medium-term outlook remains positive, alternative scenarios should also be considered, as ongoing geopolitical and trade uncertainties may lead to increased market volatility.
Fundamental Analysis of the Dow Jones Index
The Dow Jones is facing fluctuations amid uncertainty surrounding a potential U.S. government shutdown and delays in key economic data releases such as the Consumer Price Index (CPI). Inflation is expected to remain around 3.1%, and the Federal Reserve is likely to cut interest rates by 25 basis points in upcoming meetings. Meanwhile, a decline in two-year bond yields and a rise in the VIX volatility index reflect growing investor concerns.
During the Q3 earnings season, around 78% of S&P 500 companies have reported results exceeding expectations, with earnings growth projected at 8%. However, concerns persist regarding high-risk loans, and challenges remain in the real estate and automotive sectors. In addition, heavy tariff threats from Donald Trump against China have exerted downward pressure on the Dow Jones. The Fear & Greed Index, standing at 29, indicates declining market confidence. Upcoming data releases and the Federal Reserve’s rate decision on October 29 will determine the market’s next direction.
To stay updated, you can access the Trendo Economic Calendar, which provides news and economic data along with their exact release dates and times.
Final Remarks
Given the current conditions, the Dow Jones Index remains in a short-term uptrend, but the continuation of this movement depends on upcoming economic data and Federal Reserve decisions. In such an environment, risk management and continuous monitoring of economic news are of critical importance. You can trade the Dow Jones with the lowest spreads and commissions through the Trendo comprehensive platform, using advanced technical and fundamental analysis tools for an ideal trading experience.
Download the Trendo Platform and Trade with the Lowest Spreads
Please note that this analysis is provided solely for educational and informational purposes and does not constitute financial advice or a recommendation to buy, sell, or invest. Any trading decision should be based on careful risk management and remains the sole responsibility of the trader.


