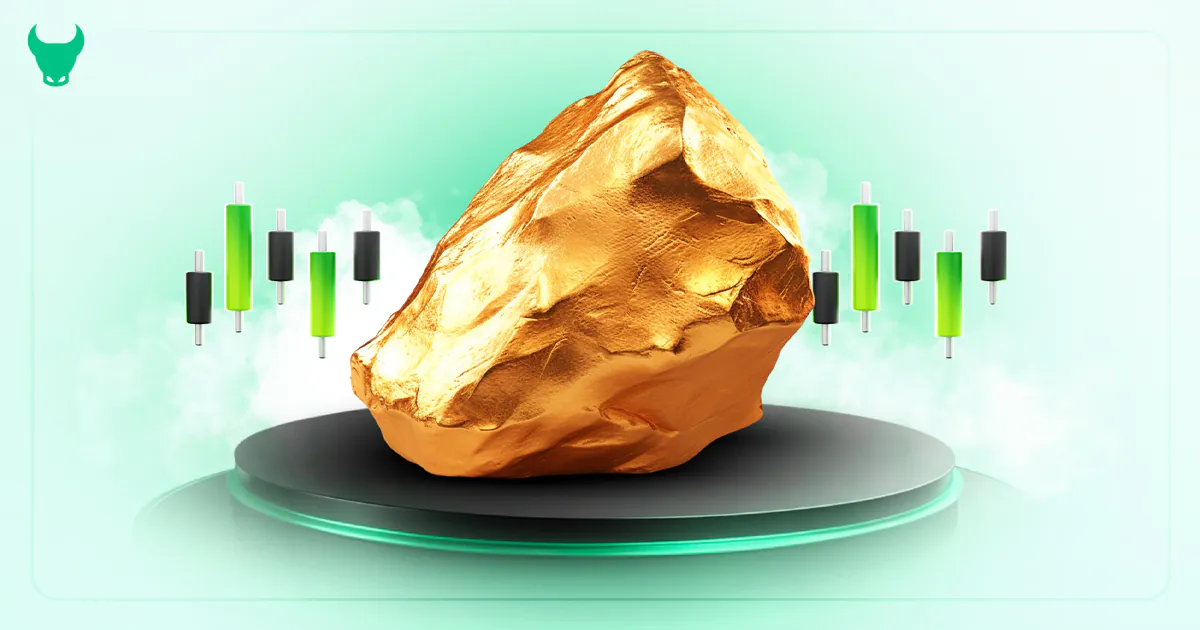


After gold’s historic rally above $4,200 in October, the market experienced one of the sharpest corrections in recent years yesterday. Today, however, part of that decline has been recovered, with prices fluctuating around $4,140.
In this analysis, the Trendo broker’s educational team examines both the technical and fundamental aspects of the market to provide a clearer outlook on the current situation and gold’s potential future trends. You can also use the Trendo trading platform and its advanced analytical tools to perform your own analyses with greater accuracy and confidence.
Technical Analysis of Gold (October 22)
From a technical perspective, gold reached a new all-time high near $4,378 this week before facing heavy selling pressure that pushed prices down to $4,004. This sharp drop drove the hourly RSI into the deep oversold area, forming a bullish divergence on the chart — a factor that triggered today’s short-term rebound.
Currently, the $4,000 level is considered a key psychological and technical support, while the $4,200 zone serves as a major resistance area. A confirmed breakout and consolidation above $4,200 could pave the way for another test of the record high. Conversely, if the $4,000 support fails, a deeper correction toward $3,950–$3,900 is likely.
Signs of heightened short-term volatility are also evident: gold fell more than 5% yesterday but recovered part of that loss today as the U.S. dollar weakened — a pattern typically accompanied by wider price swings and mixed technical indicator signals.
Overall, most recent technical analyses suggest that the current movements are part of a temporary correction within a broader bullish trend.
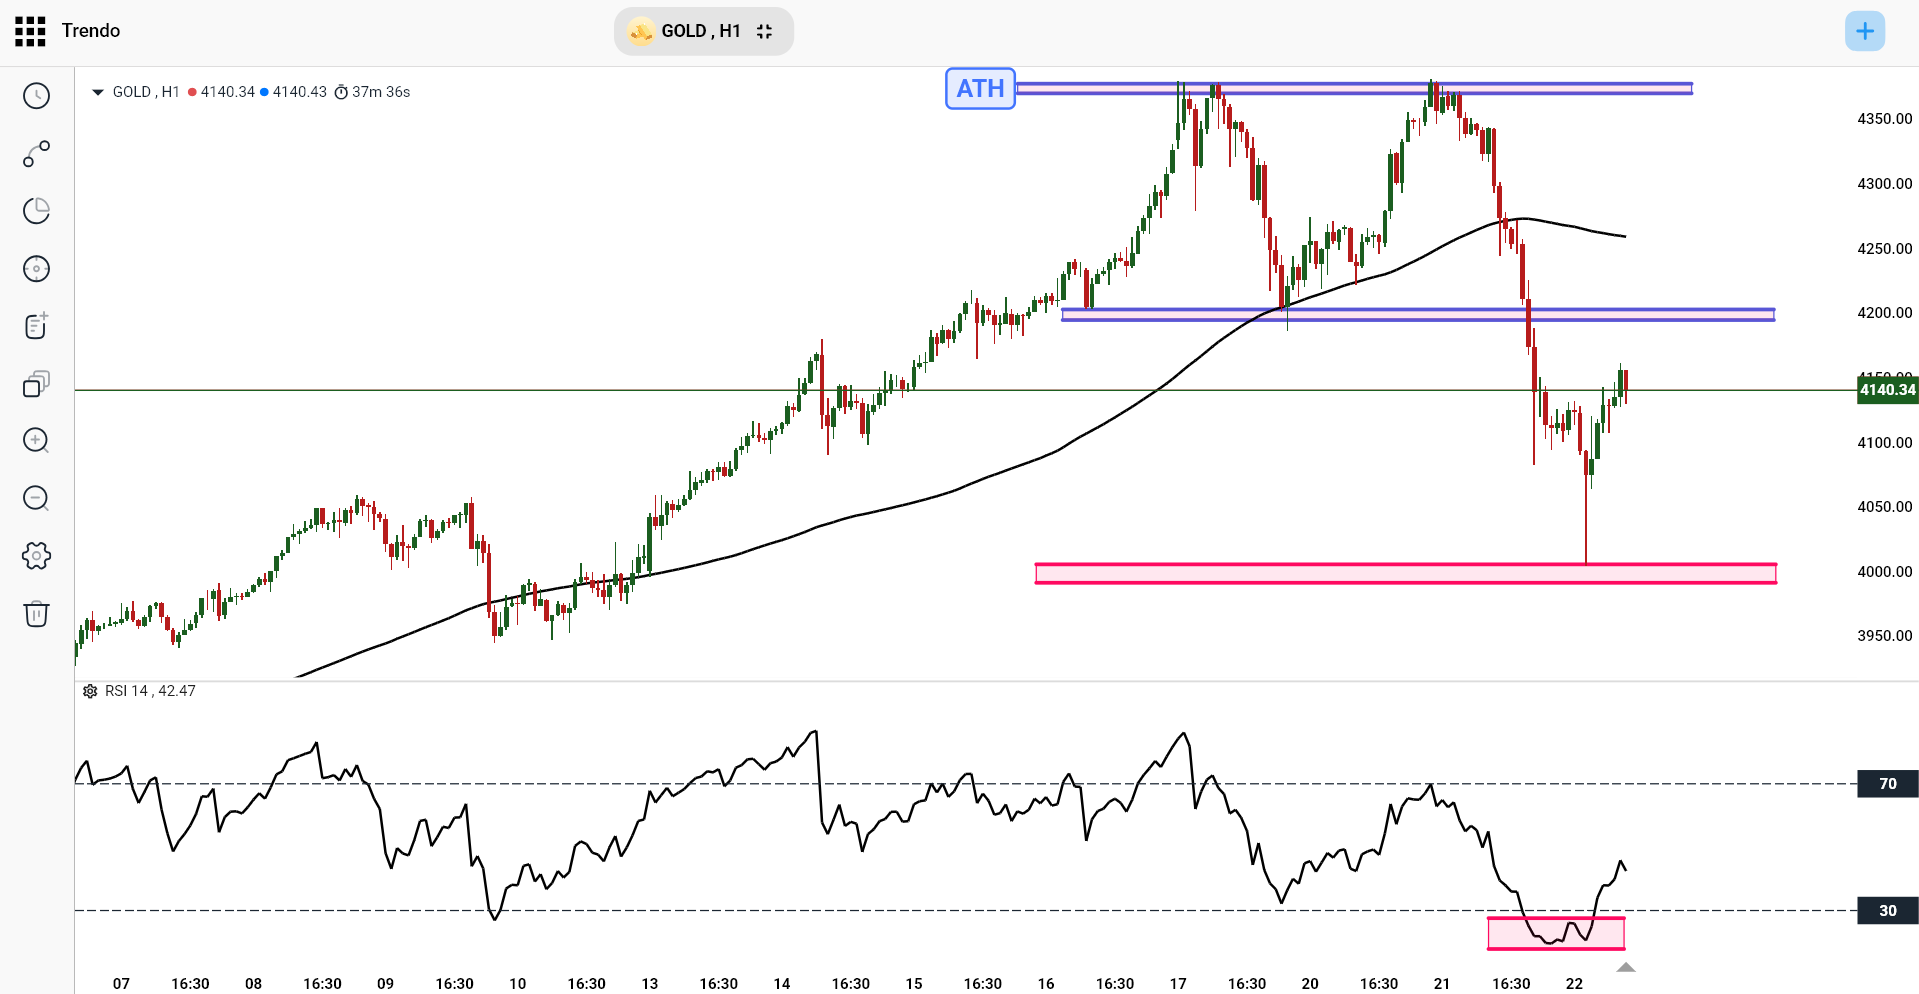
Gold Technical Chart – October 22 (Trendo Platform, H1 Timeframe)
Fundamental Analysis of Gold (October 22)
The main driver behind gold’s rally this year has been shifting expectations toward U.S. interest rate cuts and continued central bank purchases. Markets are still pricing in the possibility of a rate cut in the October and even December meetings. However, alongside this optimism, investors are also warning about the risk of overly aggressive policy easing. Meanwhile, the U.S. government shutdown has created a data vacuum, making it harder for the Federal Reserve to assess economic conditions — a situation that has significantly increased market sensitivity to any new data or official remarks.
In the short term, attention is now focused on Friday’s U.S. inflation data, which could shape expectations for monetary policy — and, in turn, the direction of the U.S. dollar and Treasury yields. Softer-than-expected inflation would strengthen gold’s fundamental backdrop, while a stronger-than-expected reading could trigger profit-taking and a renewed price correction.
Possible Gold Market Scenarios (October 22)
Bullish Scenario: If gold stabilizes above $4,100 and breaks through the $4,200–$4,220 resistance area, a weaker dollar and lower bond yields could pave the way for a retest of the all-time high and potentially extend the upward wave to higher levels. This scenario aligns with the prevailing market narrative of rate cuts expected between October and December meetings.
Neutral / Range-Bound Scenario: If the price consolidates between $4,000 and $4,200 before key data releases, the market is likely to enter a tight consolidation phase — reflecting both yesterday’s sharp correction and traders’ caution ahead of the inflation figures.
Conclusion
The overall picture remains bullish but volatile. For today’s session, the $4,000 level acts as the key support, while the $4,200–$4,220 zone serves as the strategic resistance. A confirmed breakout or breakdown beyond these levels may determine the direction of the trading session. In such conditions, risk management becomes increasingly important, as short-term volatility is high and Friday’s inflation report could define gold’s next major move with greater clarity.
For more precise market analysis and low-spread, low-commission trading, you can use the comprehensive Trendo platform, equipped with advanced technical and fundamental analysis tools for a more professional trading experience. Please note: this analysis is for educational and informational purposes only and should not be considered as financial advice or a buy/sell recommendation.
Download the Trendo Platform and Trade with the Lowest Spread and Commission