
If you have ever stared at a price chart and felt overwhelmed by all those colored bars flickering up and down, you are not alone. Most new traders spend weeks trying to make sense of it all. The good news? Once you understand how to read candlestick charts, what once looked like noise starts to reveal a clear picture of who is in control, buyers or sellers, and where the price is likely to go next.
This article covers everything: the anatomy of a single candle, how to read patterns in context, how to combine candlesticks with tools like RSI and moving averages, and the most common mistakes traders make. Whether you trade forex, stocks, crypto, or commodities, the principles here apply everywhere.
Ready to put candlestick reading into practice? Open a free Trendo demo account and follow along on a live chart as you read.
What Is a Candlestick Chart?
A candlestick chart is a type of financial chart that displays price movements over a chosen time period using individual “candles.” Each candle represents one unit of time (one minute, one hour, one day, or any other interval) and shows four key data points: the open, high, low, and close of that period.
Candlestick charts originated in 18th-century Japan, where rice merchants used them to track market prices and sentiment. They were introduced to Western trading by Steve Nison in the 1990s and have since become the most widely used chart type among professional traders worldwide.
Compared to simple line charts or bar charts, candlesticks offer far more visual detail at a glance. Knowing how to read candlestick charts gives you a direct window into market psychology, something no line chart can offer. They allow traders to read market sentiment, not just price direction, which makes them an essential tool in technical analysis. That is exactly why knowing how to read candlestick charts is considered a foundational skill for anyone who trades actively.
Understanding the Anatomy of a Candlestick
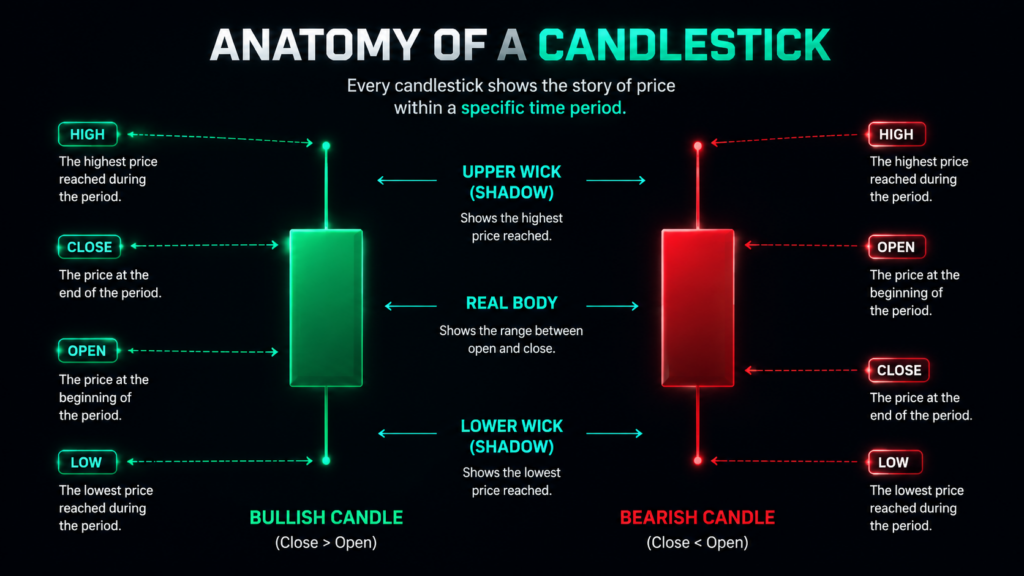
Before you can read candlestick charts effectively, you need to understand what each part of a candle actually means. Every candle is made up of three components: a real body, an upper wick (shadow), and a lower wick (shadow). Once you understand these three parts, how to read candlestick charts becomes far less intimidating.
The Real Body: What It Represents
The real body is the wide rectangular section of the candle. It represents the range between the opening price and the closing price of that period.
- Green (or white) body: The close was higher than the open; buyers were in control. This is a bullish candle.
- Red (or black) body: The close was lower than the open; sellers dominated. This is a bearish candle.
The size of the body matters. A large body signals strong conviction. A small body suggests indecision or a near-equal balance between buyers and sellers.
Upper Wick (Shadow): What It Tells You
The upper wick extends above the real body, showing the highest price reached during the period. A long upper wick means the price was pushed up significantly, but could not hold those gains; sellers rejected the higher prices and drove it back down.
Lower Wick (Shadow): What It Tells You
The lower wick extends below the real body, representing the lowest price reached. A long lower wick signals that sellers pushed the price down aggressively, but buyers reversed the move before the candle closed. This type of candle often appears at support zones.
The Open, High, Low, and Close (OHLC) Explained
Every candle encodes four prices:
- Open (O): The price at the beginning of the time period
- High (H): The highest price reached during the period
- Low (L): The lowest price reached during the period
- Close (C): The price at the end of the time period
When combined, these four data points tell a complete story of what buyers and sellers did during that candle, who was winning, who was losing, and who had the last word.
Bullish Candle vs Bearish Candle: Key Differences
| Feature | Bullish Candle | Bearish Candle |
| Color | Green / White | Red / Black |
| Close vs Open | Close > Open | Close < Open |
| Body position | The body is higher | The body is lower |
| Market signal | Buyers in control | Sellers in control |
How to Read a Single Candlestick?
Reading one candle in isolation is the first skill to develop. While a single candle rarely tells the whole story, it gives you important clues about momentum and intent.
Reading the Body Size (Large vs Small Body)
A large body candle means there was strong, sustained directional pressure throughout the period. A large green candle tells you buyers dominated from open to close with very little resistance. A small body candle suggests the market was indecisive; neither buyers nor sellers could gain a significant edge.
Reading the Wick Length (Long vs Short Wicks)
Long wicks are rejection signals. A long upper wick on a bearish candle at resistance is a classic bearish rejection. A long lower wick on a bullish candle at support tells you buyers defended that level aggressively. Short wicks generally indicate that the price moved smoothly in one direction with little pushback.
What a Candle with No Wick Means
A candle with no upper wick is called a Marubozu. On a bullish Marubozu, the open was the low and the close was the high — price moved up the entire period without pulling back. This signals extreme buying pressure. Marubozu candles in the direction of a trend are powerful momentum signals.
What a Candle with No Body Means (Doji)
A Doji forms when the opening and closing prices are almost identical, leaving the candle with essentially no body, just wicks on both ends. A Doji signals indecision. Neither side won. A Doji appearing after a strong trend often warns that momentum may be fading.
How to Identify Market Sentiment from One Candle
To quickly assess sentiment from a single candle, ask yourself three questions:
- Where did it close relative to its open? (Bullish or bearish direction)
- How large is the body? (Strength of conviction)
- Where are the wicks, and how long are they? (Rejection or acceptance of price levels)
How to Read Candlestick Charts Step by Step
Now that you understand individual candles, it is time to put them together. How to read candlestick charts as a whole (not just one candle at a time) is where the real trading edge comes from.
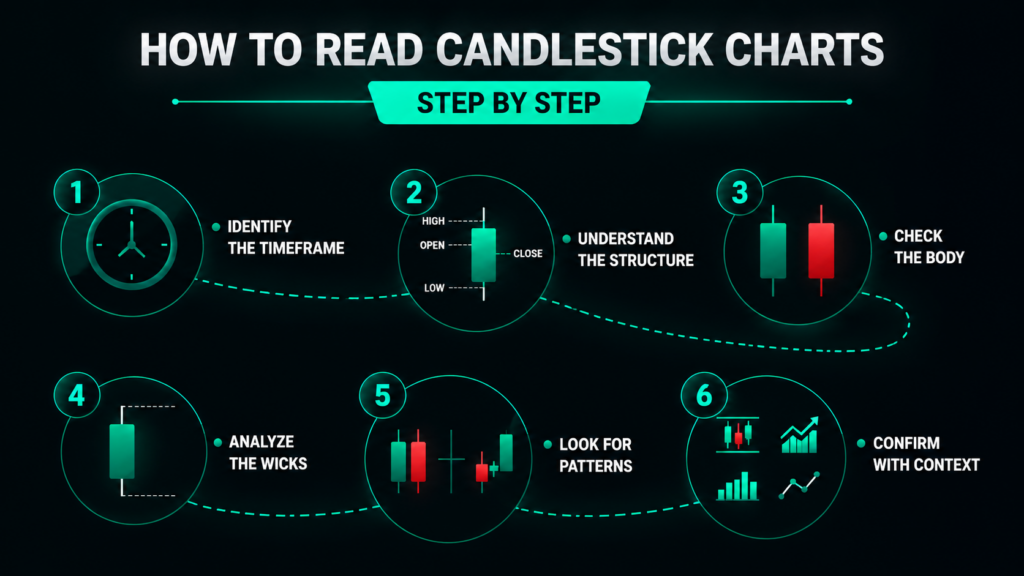
Step 1: Identify the Trend Direction
Before looking at any candle or pattern, zoom out and determine the overall direction of the market. Is the price making higher highs and higher lows? That is an uptrend. Lower lows and lower highs? That is a downtrend. If the price moves sideways, that is a consolidation phase. The trend is your most important context.
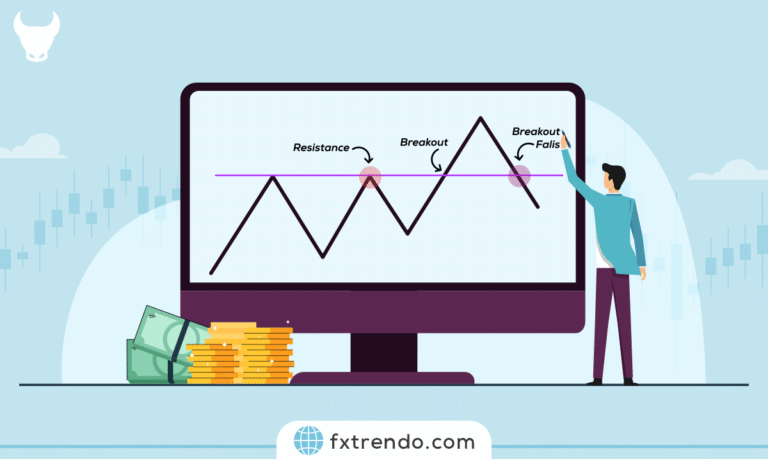
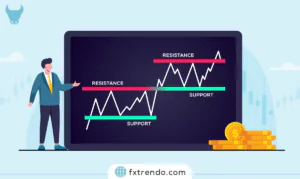
Step 2: Spot Key Support and Resistance Levels
Support and resistance levels are the areas on the chart where price has previously reversed or stalled. These zones act as a kind of market memory; traders remember prices where strong buying or selling occurred, and those areas tend to matter again in the future. Mark out significant horizontal levels before reading any candlestick patterns.
Step 3: Read Individual Candles in Context
With the trend and key levels identified, start reading each candle in relation to its surroundings. Are bullish candles getting larger and bearish candles getting smaller? That suggests increasing buying pressure. Pay particular attention to candles that form right at support and resistance levels.
Step 4: Identify Candlestick Patterns
Once you can read individual candles, you can recognize multi-candle patterns. Some of the most widely recognized include:
- Hammer / Inverted Hammer: Single candles with long lower wicks at the bottom of a downtrend, signaling potential bullish reversal
- Shooting Star: A candle with a long upper wick at the top of an uptrend, signaling potential bearish reversal
- Bullish / Bearish Engulfing: A two-candle pattern where the second candle completely engulfs the first, showing a decisive shift in sentiment
- Morning Star / Evening Star: Three-candle reversal patterns showing a clear transition from one sentiment to another
- Doji at key levels: A Doji at support or resistance can precede a sharp move in either direction
Step 5: Confirm Signals with Volume
Volume is the number of contracts or units traded during a candle’s period. A strong candlestick pattern accompanied by high volume is far more reliable than the same pattern on thin volume. High volume on a key reversal candle indicates genuine participation behind the move.
Step 6: Wait for Pattern Completion Before Trading
Always wait for the candle to close before acting on a pattern. A candle that looks like a perfect Hammer with 10 minutes left in its period might close as a completely different shape. The signal is only valid once the candle has fully formed and closed.
How to Read Candlestick Timeframes
The timeframe you choose dramatically changes what you see on a candlestick chart. A 5-minute chart gives you a close view of short-term fluctuations. A weekly chart shows the big picture of long-term structure. The same candle pattern can mean different things depending on the timeframe.
Multi-Timeframe Analysis Explained
Professional traders rarely rely on a single timeframe. They use multi-timeframe analysis, reading the higher timeframe to understand the trend and structure, then switching to a lower timeframe for precise entry points.
- Higher timeframe (daily or 4-hour): Determine the trend and mark key support/resistance levels
- Middle timeframe (1-hour): Identify the forming pattern and confirm the signal direction
- Lower timeframe (15-minute): Fine-tune the entry point and set stop-loss placement
How to Read Candlestick Charts in the Stock Market
In stock markets, candlestick charts work the same way as in forex or crypto. That said, how to read candlestick in stock market conditions does require awareness of a few stock-specific factors. However, there are important differences that stock traders should understand.
Key Differences Between Stock and Forex Candlesticks
Stock markets have fixed trading hours (usually 9:30 AM to 4:00 PM in the US), so price data is only available when the market is open. Forex and crypto markets operate around the clock. For stock traders, candlestick patterns that form near the close of trading carry extra weight, the final hour often reflects institutional positioning.
How Gaps Appear in Stock Candlestick Charts
When a stock closes at one price and opens the next day significantly higher or lower, the chart shows a gap, a space with no candlestick between two price levels. A gap up after a strong candle reinforces bullish momentum. A gap down signals aggressive overnight selling. Unfilled gaps often act as support or resistance when the price returns to that zone.
How to Read Candlestick Charts for Beginners
If you are looking for how to read candlesticks for beginners, the answer is always the same: start with structure, not patterns. The key is to start simple. You do not need to memorize dozens of patterns to begin reading charts effectively.
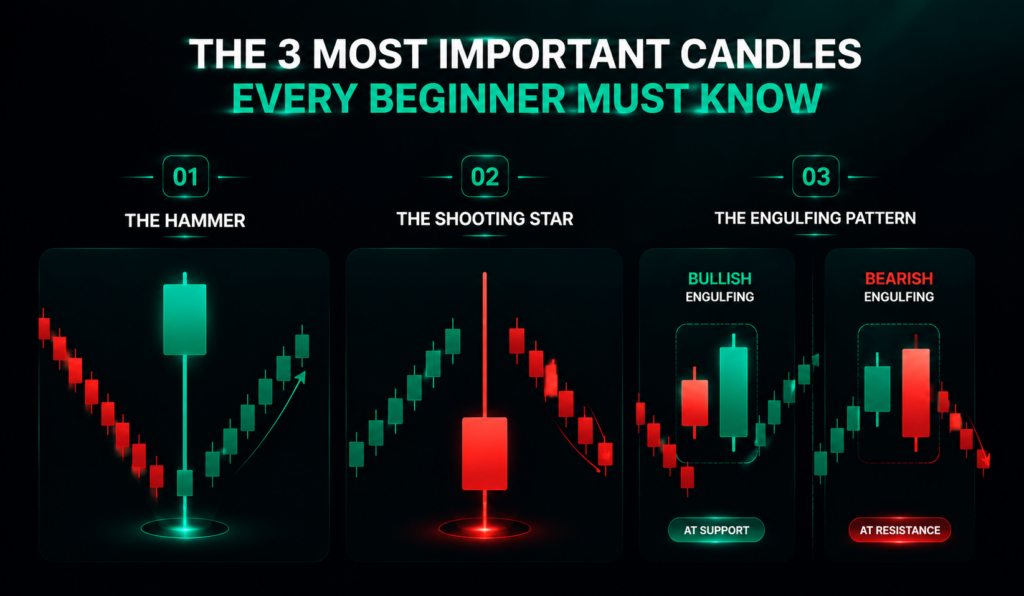
The 3 Most Important Candles Every Beginner Must Know
- The Hammer: A small body at the top of the candle with a long lower wick. Found at the bottom of a downtrend, it tells you buyers pushed back hard against sellers. It is one of the clearest early signs of a potential reversal.
- The Shooting Star: A small body at the bottom of the candle with a long upper wick. Found at the top of an uptrend, it shows sellers rejected the push to higher prices. Often precedes a bearish move.
- The Engulfing Pattern: A two-candle pattern where the second candle’s body completely covers the first. A Bullish Engulfing at support is a strong buy signal; a Bearish Engulfing at resistance is a strong sell signal.
Common Beginner Mistakes When Reading Candlesticks
- Trading every pattern you see, filter by trend and key levels first
- Ignoring the bigger picture, a reversal candle means nothing against a strong trend
- Acting on candles before they close, patterns change dramatically in the final minutes
- Using only candlesticks without any other confirmation tool
Read Trendo’s free Technical Analysis Starter Kit, candlestick guides, pattern references, and video walkthroughs.
How to Combine Candlestick Charts with Technical Analysis
Candlestick patterns are much more powerful when used alongside other technical tools. Think of candlesticks as the “what” and technical indicators as the “why” together, they paint a more complete picture of market conditions.
Using Candlesticks with Support and Resistance
This is the most fundamental combination in all of technical analysis. A reversal candlestick pattern forming at a strong support or resistance zone significantly increases the probability of a successful trade. The zone tells you where the market is likely to react; the candle tells you how it is reacting. Always look for at least two or three prior tests of a level before treating it as significant.
Using Candlesticks with Moving Averages
Moving averages (MAs) are trend-following tools that smooth out price data over a defined period. When price returns to a rising moving average and forms a bullish candle — such as a Hammer or Bullish Engulfing — it can be a high-probability buy signal. The moving average acts as dynamic support; the candle confirms that buyers are defending it.
Using Candlesticks with RSI
The Relative Strength Index (RSI) is a momentum oscillator that measures the speed and magnitude of price changes. When the RSI is in oversold territory (below 30) and a bullish reversal candle forms, the combination is a much stronger buy signal than either one alone. RSI divergence is also valuable: if price makes a new high but the RSI makes a lower high, a bearish candlestick pattern in this context carries extra weight.
Using Candlesticks with MACD
The MACD (Moving Average Convergence Divergence) is another popular momentum indicator. A bullish MACD crossover combined with a bullish candlestick pattern is a particularly reliable buy signal. The MACD gives you momentum confirmation; the candle gives you timing precision.
Using Candlesticks with Volume Indicators
Volume is the raw fuel of any price move. Strong candlestick patterns should be accompanied by above-average volume to carry conviction. Tools like On-Balance Volume (OBV) and VWAP can further refine your read on whether the volume behind a candlestick pattern is genuinely significant.
Candlestick Reading Strategy for Different Markets
The core principles of how to read candlestick stock charts, forex pairs, and crypto assets are essentially the same, but each market has its own characteristics that affect how you apply them.
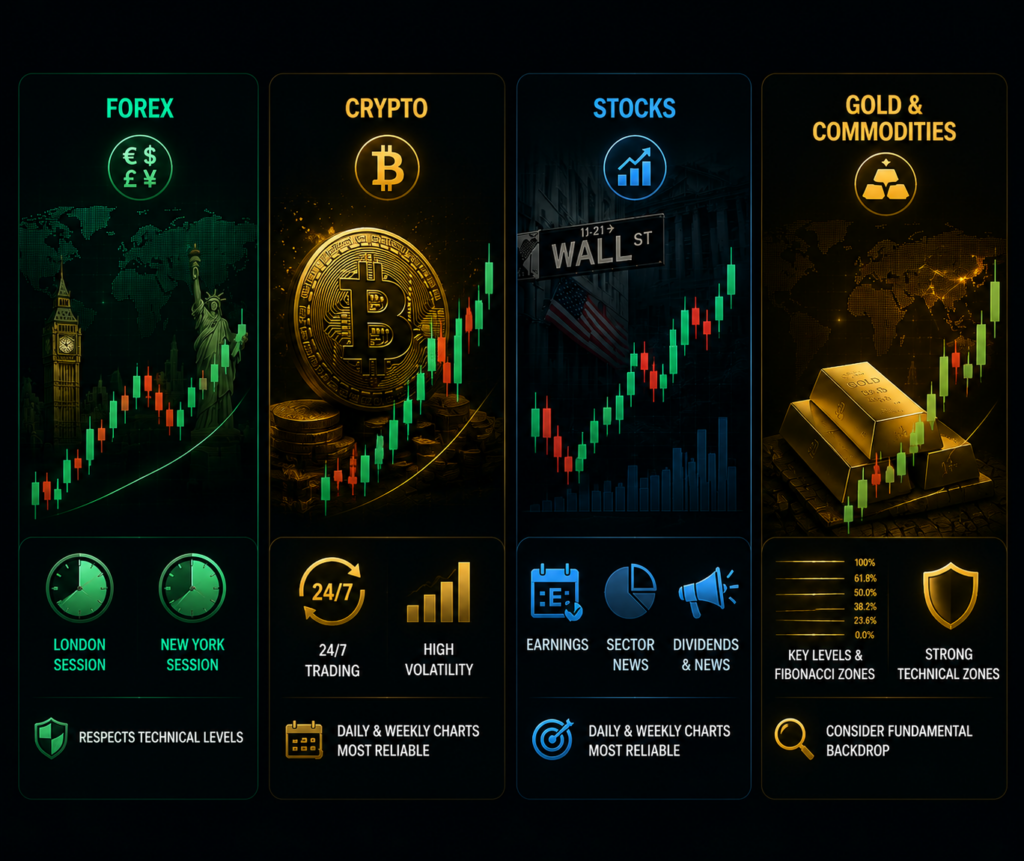
Reading Candlestick Charts in Forex Trading
Forex markets trade 24 hours a day, five days a week, which means candlestick charts have very few gaps and generally smooth price flows. The most important sessions for candlestick reading are the London and New York sessions, which generate the highest volume and the most reliable patterns. Key currency pairs — EUR/USD, GBP/USD, USD/JPY, tend to respect technical levels very well.
Reading Candlestick Charts in Crypto Trading
Cryptocurrency markets trade 24/7 without interruption. Crypto markets are also more volatile, which means candles are often larger and more dramatic. Bitcoin’s candlestick behavior on the daily and weekly chart tends to be the most reliable, as it reflects institutional participation and broader market sentiment.
Reading Candlestick Charts in the Stock Market
In the stock market, always consider earnings announcements, dividends, and sector-wide news when reading candlesticks — a large candle may be driven by a fundamental event rather than pure technical pressure. The most reliable candlestick setups in stocks form on daily or weekly charts.
Reading Candlestick Charts for Gold and Commodities
Gold is particularly well-suited to candlestick analysis due to its high liquidity and well-defined technical levels. Reversal patterns on the daily gold chart near major round-number levels or key Fibonacci zones tend to play out reliably. Always factor in the fundamental backdrop when reading gold’s price action.
Get Trendo’s Weekly Market Analysis, candlestick setups, key levels, and trade ideas on forex, gold, and crypto every week.
Common Mistakes When Reading Candlestick Charts
- Trading Patterns Without Trend Context
- Ignoring Support and Resistance Zones
- Over-Relying on a Single Candle Signal
- Not Waiting for Candle Close
- Skipping Volume Confirmation
- Using Wrong Timeframes for Your Strategy
Trading Patterns Without Trend Context
A candlestick pattern means very little without knowing the trend. Always establish the trend before interpreting any pattern. A bearish candle at resistance in a downtrend is a high-probability signal. The same candle appearing randomly mid-trend is largely noise.
Ignoring Support and Resistance Zones
The most common beginner error is spotting a Hammer or Engulfing pattern and immediately trading it, without checking whether it formed at a meaningful level. Patterns forming between key zones are far less reliable than those appearing precisely at support or resistance.
Over-Relying on a Single Candle Signal
One candle can lie. A single Hammer does not guarantee a reversal. Price action should always be confirmed by at least one additional factor, a key level, an indicator reading, a volume spike, or a multi-candle pattern. The more confluence you have, the higher the probability.
Not Waiting for Candle Close
Trading a candle before it closes is one of the most common and costly mistakes in technical analysis. With five minutes left on a 4-hour candle, what looks like a strong bullish setup can transform into a bearish engulfing. The signal is only valid at candle close.
Skipping Volume Confirmation
A strong-looking reversal candle on very low volume suggests a lack of real conviction — the pattern may fail. Always glance at the volume histogram when evaluating a candlestick signal.
Using Wrong Timeframes for Your Strategy
Match your timeframe to your trading style and holding period. If you are unsure, learn how to use multi-timeframe analysis to bridge the gap between bigger-picture context and precise entries.
Conclusion: How to read candlestick charts
Learning how to read candlestick charts is not about memorizing dozens of patterns. It is about developing a consistent, structured way of looking at price, understanding what buyers and sellers are doing in real time, and acting on that knowledge with discipline.
Patterns are not rules. They are probabilities, and probability only pays when you manage risk properly.
Key Takeaways for Reading Candlestick Charts
- Every candlestick tells a story through its body size, wick length, and color
- The trend and key levels always come before the pattern
- Candle close is the only valid signal. Never trade a forming candle
- Use at least one additional confirmation tool (RSI, support/resistance, volume)
- Match your timeframe to your strategy and stick to it
- Consistency and risk management matter more than any single candle signal
Get started with Trendo today and receive a $100 welcome bonus on registration! Create your account in minutes and begin trading.