مبادئ تشكيل مستويات الدعم و المقاومة على أساس العرض و الطلب
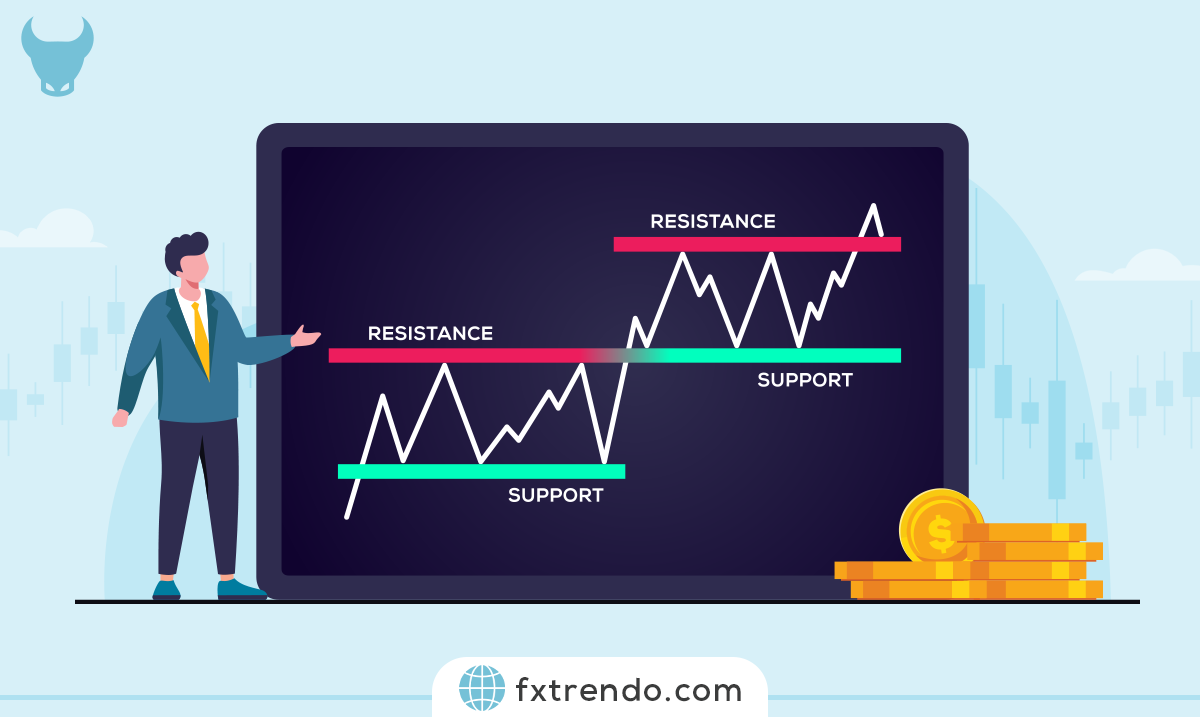
قبل أن ندخل في التفاصيل، يجب أن نفهم مناطق الدعم و المقاومة بشكل كامل. يعتبر الدعم و المقاومة من المفاهيم الأساسية في التحليل الفني المستخدم لتحديد مستويات الأسعار التي تفاعل فيها السوق تاريخياً مع تلك المنطقة.
في الاتجاه الهبوطي، تنخفض الأسعار مع انخفاض الأسعار، و يصبح السعر أكثر جاذبية للمشترين الذين باعوا بكميات أعلى، و يدخل المزيد من المشترين إلى السوق تدريجيًا حتى يصل العرض و الطلب إلى المساواة النسبية في منطقة ما. إذا كانت قوة المشترين أكبر من قوة البائعين، فسوف يتسبب ذلك في عودة السعر، و هو ما يسمى منطقة الدعم.
و من ناحية أخرى، تبدأ قيمة الأسهم في الارتفاع في السوق بسبب ارتفاع الطلب، و يدخل البائعون إلى السوق تدريجياً مع زيادة الأسهم، و يحدث عكس ما شرحناه عن مناطق الدعم. و في هذه الحالة تكون قوة البائعين أكبر من قوة المشترين. و مع العودة الهبوطية للسعر، يتم تشكيل منطقة المقاومة
أنواع مناطق الدعم و المقاومة
تنقسم مناطق الدعم والمقاومة إلى الفئتين التاليتين وفقًا لما إذا كانت نطاق سعري ثابت أو مناطق متغيرة:
- مناطق الدعم والمقاومة الثابتة
- مناطق الدعم والمقاومة الديناميكية
وفقا للإطار الزمني للتداول و ما إذا كان السوق في نطاق تداول أو اتجاه، فإن تطبيق كل منهما يختلف، و هو ما سنشرحه بالتفصيل فيما يتعلق بكل واحد.
اقرا مزید.
كيفية رسم مستويات الدعم والمقاومة بشكل صحيح
إن إتقان كيفية رسم الدعم والمقاومة أمر أساسي لتحقيق نتائج تداول متسقة. تمثل مستويات الدعم و المقاومة المناطق السعرية الرئيسية حيث يدور الصراع بين المشترين والبائعين، مما يؤدي غالباً إلى انعكاسات أو توقف أو اختراقات في الدعم و المقاومة. إليك دليلاً عملياً حول كيفية رسم خطوط الدعم و المقاومة يمكنك تطبيقه فوراً على الرسوم البيانية الخاصة بك. استخدم حاسبة الدعم والمقاومة لتسريع عملية تحديد مستويات الدعم و المقاومة.
الدعم والمقاومة الأفقي
ابدأ على إطار زمني 4 ساعات أو اليومي. ابحث عن مناطق واضحة انعكس فيها السعر بقوة عدة مرات. لرسم خطوط الدعم والمقاومة، اربط على الأقل بين اثنين (ومن الأفضل ثلاثة) من القيعان المتأرجحة للدعم أو القمم المتأرجحة للمقاومة. ركز على أجسام الشموع بدلاً من الظلال فقط للحصول على مستويات أنظف. تكون المستويات الأقوى هي التي لها لمسات أكثر من الجانبين في المقاومة والدعم.
خطوط الدعم والمقاومة الثابتة
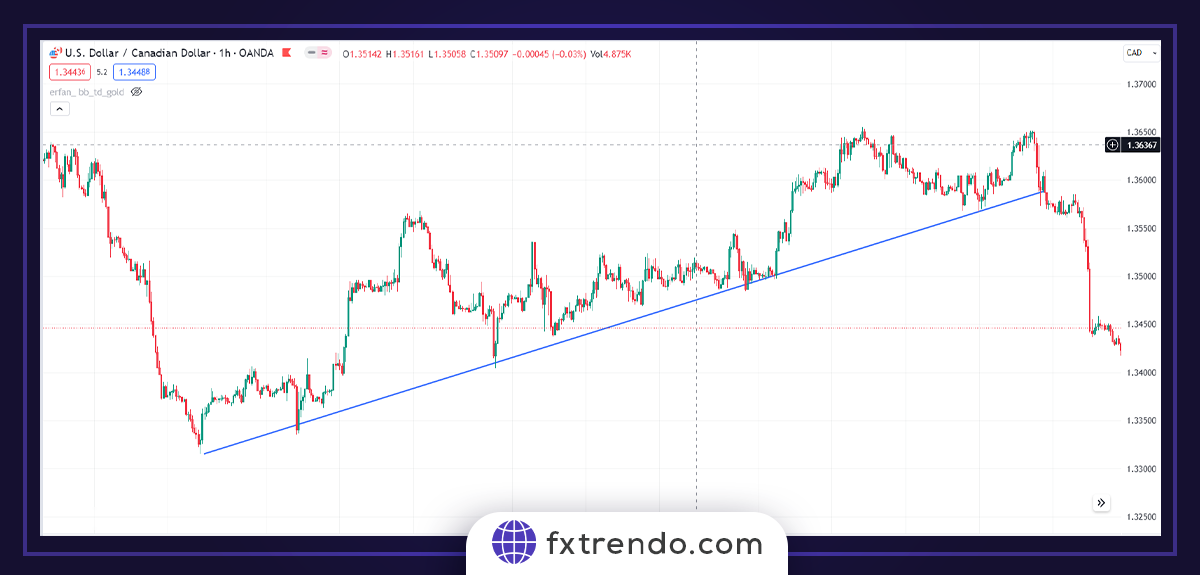
خطوط الاتجاه للدعم والمقاومة
تُعد خطوط الاتجاه ضرورية في الأسواق المتجهة. في الاتجاه الصاعد، استخدم أداة الخط لربط اثنين أو أكثر من القيعان المتأرجحة الأعلى لتشكيل خطوط المقاومة والدعم الصاعدة. في الاتجاه الهابط، اربط القمم المتأرجحة الأدنى. اضبط الخط بحيث يلامس أكبر عدد ممكن من نقاط السعر دون اختراق الشموع بشكل مفرط. تعمل هذه الخطوط الديناميكية لرسم المقاومة والدعم بشكل أفضل عندما يكون الاتجاه واضحاً في الدعم والمقاومة.
المستويات الديناميكية (المتوسطات المتحركة)
أضف المتوسطات المتحركة الأسية لـ50 و200 فترة إلى الرسم البياني الخاص بك. تعمل هذه كـمستويات الدعم والمقاومة التي تتحرك مع السعر. خلال الاتجاهات الصاعدة، يرتد السعر غالباً من المتوسط المتحرك الصاعد كـالدعم والمقاومة. وفي الاتجاهات الهابطة، يعمل المتوسط المتحرك الهابط كمقاومة. هذه واحدة من أسهل الطرق لتحديد المقاومة و الدعم الديناميكية. هذا النوع من المقاومة و الدعم أقل صلاحية من النوع الثابت، وقد تختلف طريقة رسمه من متداول لآخر بناءً على خبرة كل متداول واستراتيجيته الشخصية.
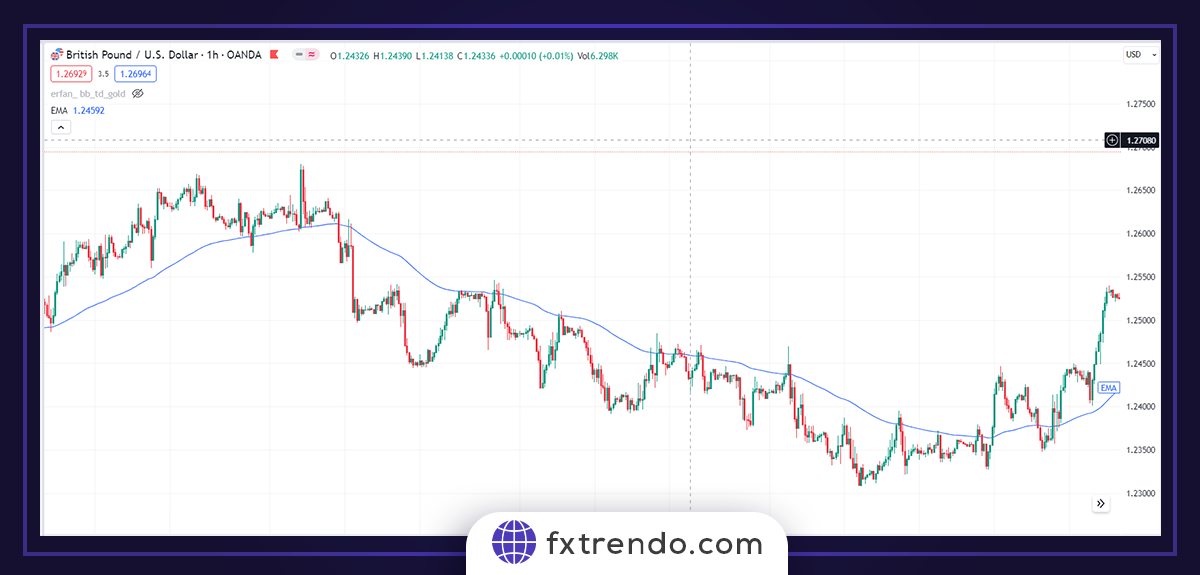
تساعد المتوسطات المتحركة في تحديد مناطق المقاومة و الدعم. إذا كان السعر أعلى من المتوسط المتحرك، يلعب دور الدعم والمقاومة، وإذا كان أقل، يلعب المتوسط المتحرك دور المقاومة.
اقرأ المزيد: مؤشر المتوسط المتحرك
الأرقام الدائرية والمستويات النفسية
قم بوضع علامات يدوياً على الأرقام الدائرية الرئيسية مثل 1.2500 أو 100.00 أو 50,000. تجذب هذه مستويات الدعم و المقاومة النفسية تدفقات طلبات كبيرة وتسبب ردود أفعال قوية غالباً. احترم دائماً هذه الأرقام عند رسم الدعم و المقاومة على أي أصل. يمكنك الاستعانة بـحاسبة المقاومة و الدعم لحساب نقاط الدعم والمقاومة يوميا بجانب هذه الأرقام.
استخدام القمم والقيعان المتأرجحة
حدد القمم المتأرجحة (قمة مع قمم أقل على اليسار واليمين) والقيعان المتأرجحة (قاع مع قيعان أعلى حولها). اربط التقلبات المهمة الأخيرة لرسم خطوط الدعم والمقاومة. تعطيك هذه الطريقة أدق وأعلى احتمالية مستويات الدعم و المقاومة. تحقق دائماً من الأطر الزمنية الأعلى للتأكيد. استخدم حاسبة الدعم و المقاومة للتحقق من نقاط الدعم والمقاومة يوميا بناءً على هذه النقاط.
مارس رسم خطوط الدعم و المقاومة يومياً على أزواج وأطر زمنية مختلفة حتى يصبح أمراً طبيعياً.
الدعم والمقاومة في أطر زمنية مختلفة
يُعد فهم الدعم والمقاومة عبر أطر زمنية متعددة أمراً حاسماً للتداول عالي الاحتمالية. تتغير كيفية رسم خطوط حسب الإطار الزمني الذي تحلله، حيث يقدم كل إطار رؤى مختلفة حول سلوك السوق في الدعم و المقاومة.
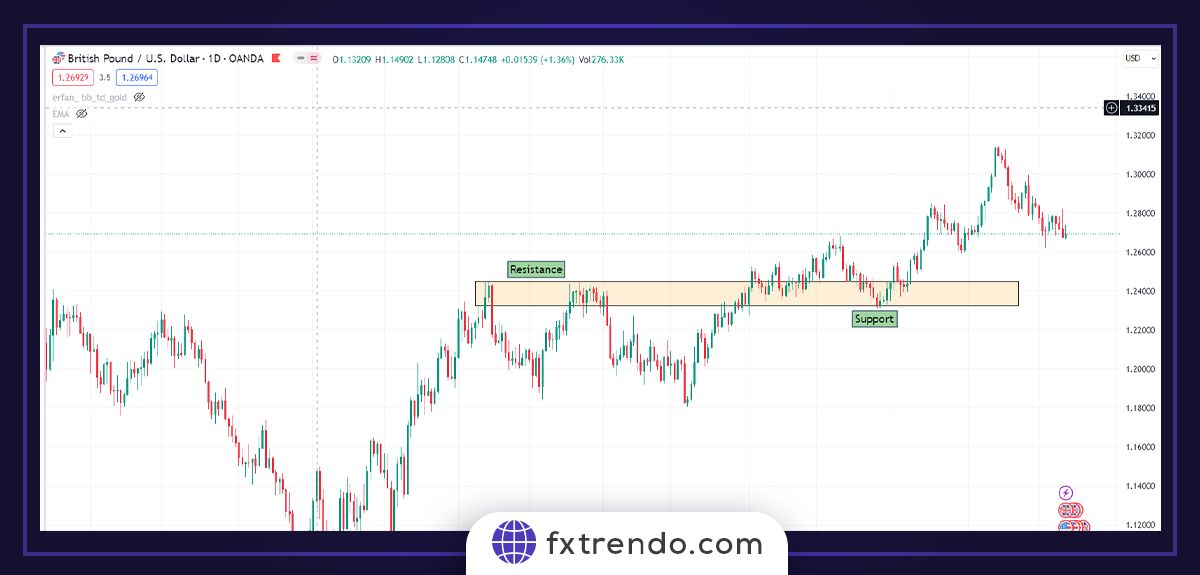
الدعم والمقاومة على الأطر الزمنية العليا (يومي/أسبوعي)
تنتج الأطر الزمنية العليا مثل اليومي والأسبوعي أقوى مستويات الدعم و المقاومة. تحظى هذه المستويات باحترام المؤسسات واللاعبين الكبار. لرسم خطوط المقاومة و الدعم هنا، اربط بين القمم والقيعان المتأرجحة الرئيسية التي تم اختبارها عدة مرات. غالباً ما تعمل هذه المناطق كنقاط انعكاس رئيسية ويجب أن تكون مرجعك الأساسي لـنقاط الدعم والمقاومة يوميا.
الدعم والمقاومة على الأطر الزمنية المنخفضة (ساعة واحدة/15 دقيقة)
على الرسوم البيانية لساعة واحدة و15 دقيقة، تكون مستويات الدعم و المقاومة أكثر تكراراً ولكنها أضعف وأكثر ضجيجاً. استخدمها بشكل أساسي للدخول والخروج الدقيق من الصفقات. عند رسم الدعم والمقاومة على الأطر الزمنية المنخفضة، ركز على الحركة السعرية الأخيرة واحترم اتجاه الإطار الزمني الأعلى.
التأكيد متعدد الأطر الزمنية للدعم والمقاومة
النهج الأقوى هو التأكيد متعدد الأطر الزمنية. أولاً، ارسم مستويات الدعم و المقاومة على الرسم البياني اليومي لتحديد المناطق الرئيسية. ثم انتقل إلى إطار ساعة أو 15 دقيقة للعثور على نقاط دخول دقيقة قرب هذه المستويات. عندما تتوافق مستويات الدعم و المقاومة على الإطار الزمني المنخفض مع مناطق الإطار العلوي، يزداد احتمالية صفقتك بشكل كبير. استخدم حاسبة المقاومة و الدعم للتحقق السريع من نقاط الدعم والمقاومة يوميا.
استراتيجيات الدعم والمقاومة للتداول
يأتي الميزة الحقيقية في التداول عندما تجمع بين مستويات الدعم و المقاومة واستراتيجيات واضحة وقابلة للتكرار. إليك خمسة أساليب عملية يمكنك البدء في تطبيقها اليوم في المقاومة و الدعم.
الدعم والمقاومة مع أنماط الشموع
ضع علامة على مستوى الدعم والمقاومة الرئيسي على الرسم البياني. انتظر وصول السعر إلى المنطقة. ابحث عن شمعة انعكاسية قوية: مطرقة صاعدة أو pin bar أو engulfing عند الدعم والمقاومة → اشترِ عند الإغلاق. نجمة شهاب أو pin bar هابط أو engulfing عند المقاومة → بِع عند الإغلاق. ضع وقف الخسارة من 5-15 نقطة خلف المستوى واستهدف المستوى المقابل التالي. يعطيك هذا توقيت دخول دقيق ويصفي الإشارات الضعيفة في تداول الدعم والمقاومة.
الدعم والمقاومة مع تداخل فيبوناتشي
ارسم تصحيح فيبوناتشي من أحدث قمة متأرجحة رئيسية إلى قاع متأرجح (أو العكس). تتشكل أقوى المناطق حيث يتوافق مستوى 50% أو 61.8% مع مستويات الدعم والمقاومة الأفقية. عندما يختبر السعر منطقة التداخل هذه، انتظر شمعة رد فعل واضحة ثم ادخل. تقدم إعدادات التداخل حركات أنظف ومعدلات فوز أعلى من المستويات المنفردة في الدعم والمقاومة.
الدعم والمقاومة مع تأكيد الحجم
تحقق دائماً من أشرطة الحجم عندما يقترب السعر من مستوى الدعم و المقاومة. ابحث عن حجم متزايد على شمعة الانعكاس الصاعدة — هذا يظهر اهتمام شرائي حقيقي. عند المقاومة، يؤكد الحجم العالي على الرفض الهابط سيطرة البائعين. تخطَ أي مستوى يكون فيه الحجم منخفضاً أو متوسطاً. الحجم هو أفضل مرشح لإعدادات المؤسسية.
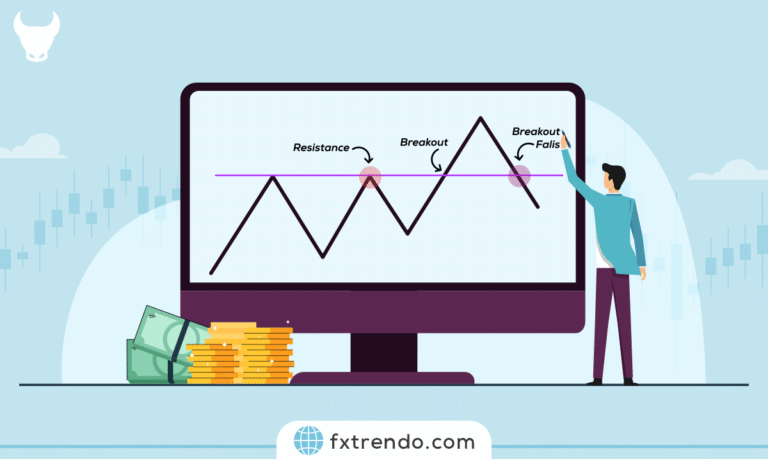
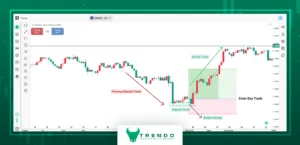
استراتيجية الاختراق والارتداد
انتظر إغلاقاً حاسماً فوق المقاومة. لا تطارد — انتظر عودة السعر وإعادة اختبار المستوى المكسور. تصبح المقاومة القديمة دعماً و مقاومة جديداً (أو العكس). ادخل في اتجاه الاختراق على أول شمعة قوية عند إعادة الاختبار. ضع وقف الخسارة خلف النقطة المتطرفة لإعادة الاختبار؛ واستهدف المستوى التالي أو نسبة 1:2. تلتقط هذه الاستراتيجية الاتجاهات القوية بمكافأة مخاطر ممتازة في المقاومة و الدعم.
السكالبينج باستخدام الدعم والمقاومة
انتقل إلى إطارات M5 أو M15 خلال جلسات لندن أو نيويورك. حدد مستويات الدعم و المقاومة الثانوية من آخر 20-40 شمعة. خذ ارتدادات سريعة: اشترِ عند الدعم والمقاومة أو بِع عند المقاومة عند اللمسة الأولى أو الثانية. استخدم وقف خسائر ضيقة (5-12 نقطة) واستهدف نسب 1:1.5 إلى 1:2. اخرج بسرعة إذا تلاشى الزخم. مثالي للجلسات الجانبية أو الاتجاهية الخفيفة باستخدام المقاومة و الدعم.
مارس هذه الإعدادات على الحساب التجريبي أولاً، ثم انتقل إلى الحساب الحقيقي مع حجم صفقات مناسب.
أدوات للمساعدة في تحديد مستويات الدعم والمقاومة
بينما يُعد الرسم اليدوي الأساس، فإن الأدوات المناسبة تجعل تحديد وتمييز مستويات الدعم والمقاومة أسرع وأدق بكثير. إليك أكثر الأدوات فائدة التي يعتمد عليها المتداولون المحترفون يومياً.
أدوات الرسم
ركز فقط على هذه الأدوات الأساسية المدمجة الثلاث:
- أداة الخط الأفقي: الأداة المخصصة للمستويات الثابتة. انقر مرة واحدة عند قاع تأرجحي واضح للدعم أو قمة تأرجحية للمقاومة، ثم مد الخط عبر الرسم البياني. أضف تنبيهات حتى لا تفوت أي اختبار.
- أداة خط الاتجاه: مثالية للدعم والمقاومة الديناميكية. في الاتجاه الصاعد، اربط قاعين تأرجحيين أعلى أو أكثر؛ وفي الاتجاه الهابط، اربط القمم التأرجحية الأقل. اضبط الخط بحيث يلامس السعر بشكل نظيف دون قطع من خلال الشموع.
- القنوات (Channels): تُظهر حركة السعر داخل حدود متوازية، وهي مفيدة للتداول في النطاقات والتوجهات.
- أداة المستطيل: استخدم هذه الأداة لتمييز الدعم والمقاومة كمناطق بدلاً من خطوط رفيعة. ارسم من أطراف ذيول الشموع الانعكاسية لتسليط الضوء على المنطقة بأكملها حيث من المحتمل أن يتفاعل السعر.
أتقن هذه الأدوات لتحليل أي رسم بياني بطريقة احترافية.
المؤشرات (مستويات البيفوت وزونات الدعم والمقاومة)
تقوم المؤشرات بحساب مستويات الدعم والمقاومة تلقائياً بناءً على بيانات السعر، مما يوفر الوقت ويقلل من التحيز الشخصي. إنها مثالية للمتداولين الذين يفضلون التحليل القائم على القواعد.
- مؤشرات نقاط البيفوت: ترسم تلقائياً النقطة المحورية المركزية اليومية أو الأسبوعية أو الشهرية بالإضافة إلى مستويات المقاومة R1-R3 ومستويات الدعم S1-S3. تعمل هذه المستويات الموضوعية بشكل ممتاز خاصة في التداول اليومي وغالباً ما تعمل كمغناطيس للسعر.
- مؤشرات زونات الدعم والمقاومة: تقوم هذه المؤشرات بإنشاء مربعات مظللة حول المناطق ذات الاحتمالية العالية بناءً على التأرجحات الأخيرة. توفر الوقت وتوضح بوضوح أين تجري المعارك الحقيقية.
أدوات الكشف الآلي عن الدعم والمقاومة
تستخدم أدوات الكشف الآلي عن الدعم والمقاومة الخوارزميات والذكاء الاصطناعي لمسح الرسوم البيانية وتحديد مستويات الأسعار الرئيسية في الوقت الفعلي. أصبحت هذه الأدوات شائعة بشكل متزايد بين المتداولين النشطين والخوارزميين.
من الاستخدامات النموذجية لهذه الأدوات: السكالبينج والتداول عالي التردد، ومراقبة أسواق متعددة في وقت واحد، ودعم الاستراتيجيات الآلية أو شبه الآلية.
أفضل ممارسة: استخدم الأدوات الآلية لاكتشاف الفرص بسرعة، لكن تحقق دائماً بالرسم اليدوي وتأكيد الإطار الزمني الأعلى قبل الدخول في الصفقة.
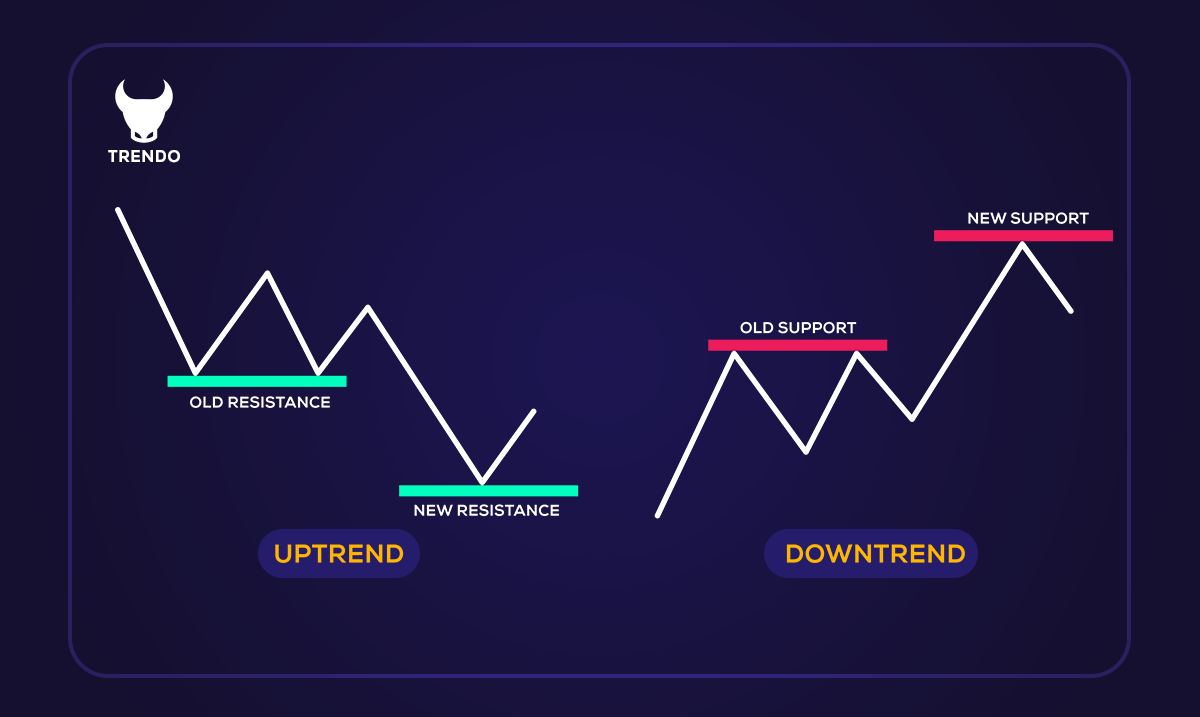
انعكاس الدور: عندما يصبح الدعم مقاومة (والعكس)
يحدث أحد أكثر الإشارات موثوقية عندما تتغير طبيعة مستويات الدعم و المقاومة.
عندما يكسر السعر ويغلق بقوة فوق مستوى مقاومة، غالباً ما يتحول هذا المستوى إلى دعم و مقاومة جديد عند أي تصحيح. وبالمثل، يصبح المقاومة و الدعم المكسور مقاومة جديدة عندما يعود السعر من الأسفل.
انتظر دائماً إعادة اختبار واضح للمستوى المقلوب قبل الدخول. يؤكد رفض شمعة قوي عند الدعم والمقاومة الجديد (المقاومة القديمة) انعكاس الدور ويعطيك صفقة استمرارية عالية الاحتمالية في اتجاه الاختراق في الدعم والمقاومة.
الخاتمة
يحقق تداول الدعم و المقاومة أفضل النتائج عندما تجمع بين طرق الرسم الدقيقة والتأكيد متعدد الأطر الزمنية والاستراتيجيات المجربة مع إدارة مخاطر صارمة. لا تعتمد على هذه المستويات وحدها أبداً — استخدم دائماً أوامر وقف الخسارة وحجم صفقات مناسب.
ابدأ بتطبيق هذه التقنيات اليوم على حساب تجريبي. مع الممارسة المستمرة، سيصبح رسم الدعم والمقاومة وتداولها بثقة واحداً من أقوى مهاراتك في التداول.
يمكنك استخدام حاسبة لتسريع عملية تحديد نقاط الدعم والمقاومة يوميا بجانب الرسم اليدوي لـمستويات الدعم و المقاومة. كما تساعد في حساب نقاط الدعم والمقاومة يوميا بدقة عالية. توفر حاسبة الدعم والمقاومة وقتاً كبيراً عند تحليل الدعم و المقاومة.