We learned about using Fibonacci levels in entering trades in the previous article. Here, we achieve a better strategy by combining Fibonacci levels with trend lines and candlestick patterns. Trend lines and candlestick patterns are a significant and integral part of technical analysis. Trend lines are used primarily to identify trends, and one cannot use candlestick patterns alone, but when combined with the Fibonacci indicator, they can create trades that are most likely winsome.
Fibonacci levels’ combination with trend line
In the chart below, first, we have identified an uptrend and drawn a support trend line for it. The next step is to draw a Fibonacci pattern on the chart by pinpointing a swing high and a swing low.
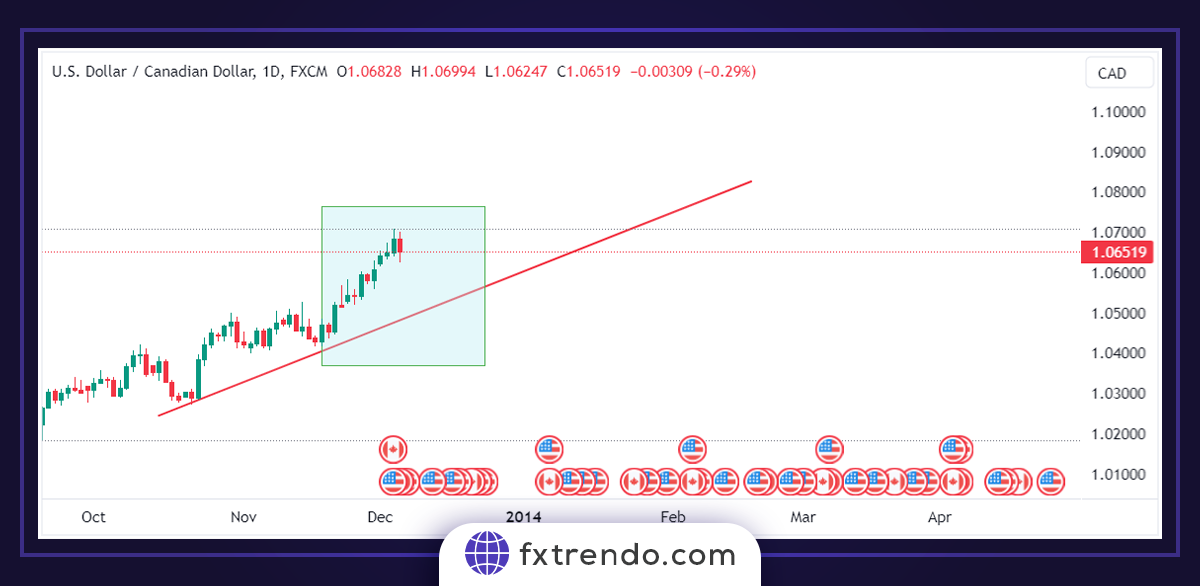
The traditional method of choosing a price floor is when the price crosses the trend line, but we combine it with Fibonacci levels in this strategy.
Read More: How to trade with a Trendline and set a great strategy
In the chart below, we used the floor and ceiling of a swing to draw Fibonacci levels. To combine the Fibonacci with the trendline, we should wait to see if the retracement from the ceiling reaches the 50% or 8.61% Fibonacci level. After touching any of these levels, if the market offers a confirmation candle, it can be an excellent opportunity to make a buy trade. The price correction touches the 50% level, which almost coincides with the ascending trend line. The next and final step is to look for a confirmation candle.
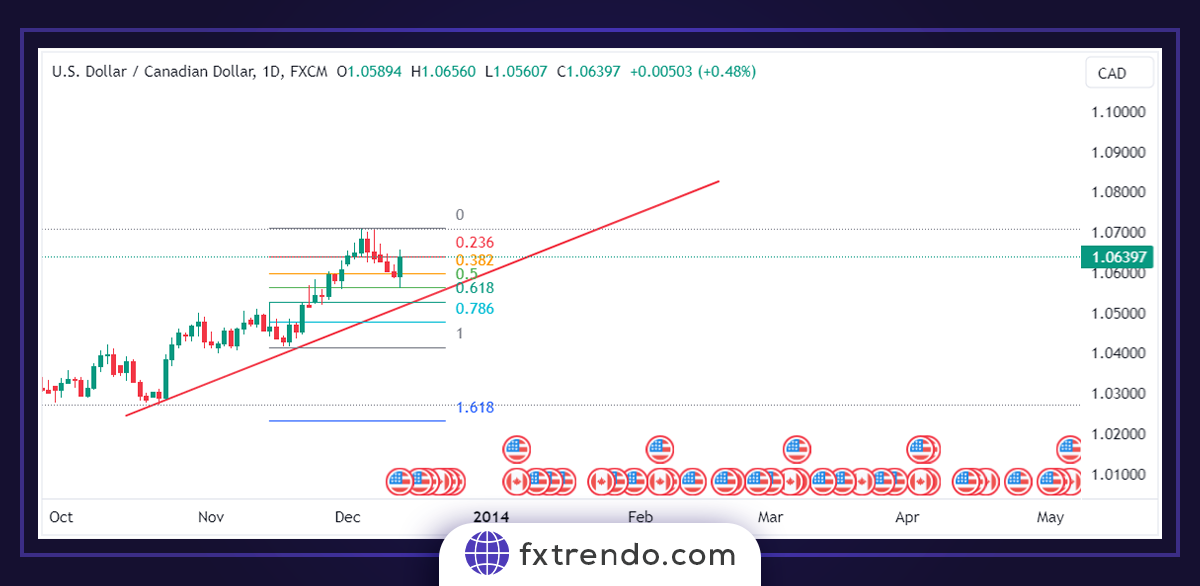
After the green candle closed above the 23.6% Fibonacci level (image below), we received a confirmation from the market. Hence, traders can now have risk-free positions for buy trades with a stop-loss below the 8.61% Fibonacci level and targeting the recent ceiling.
We must not forget that if a correction is not supported at the 50% or 61.8% Fib level and breaks all levels, it can be a sign of trend reversal. Therefore, This strategy’s main rule is a correction that coincides with the trend line and reacts from the 50% or 8.61% Fibonacci level.
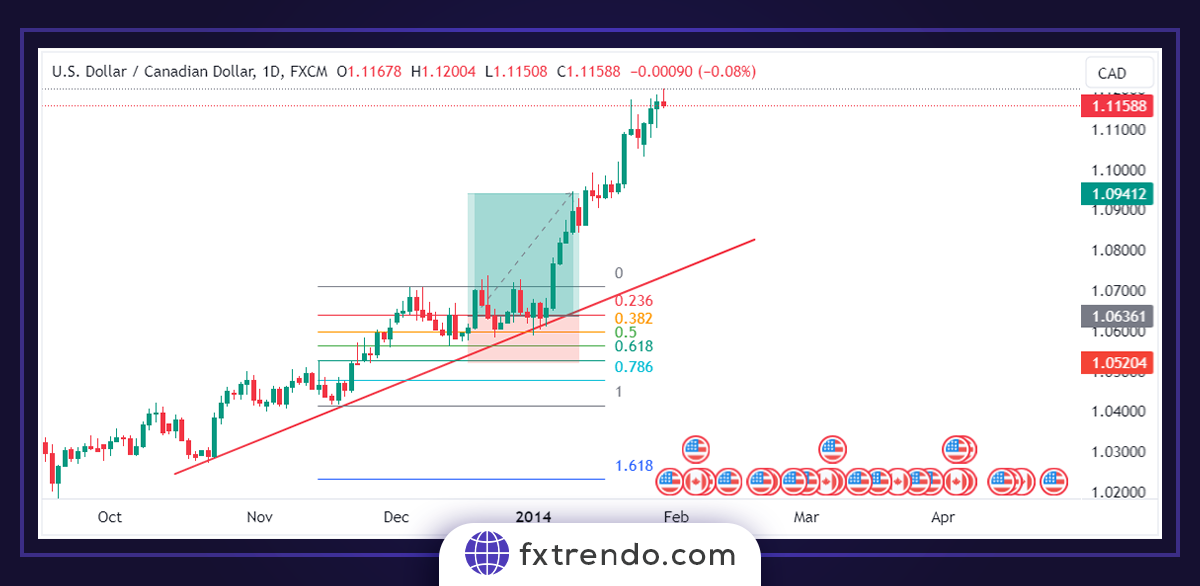
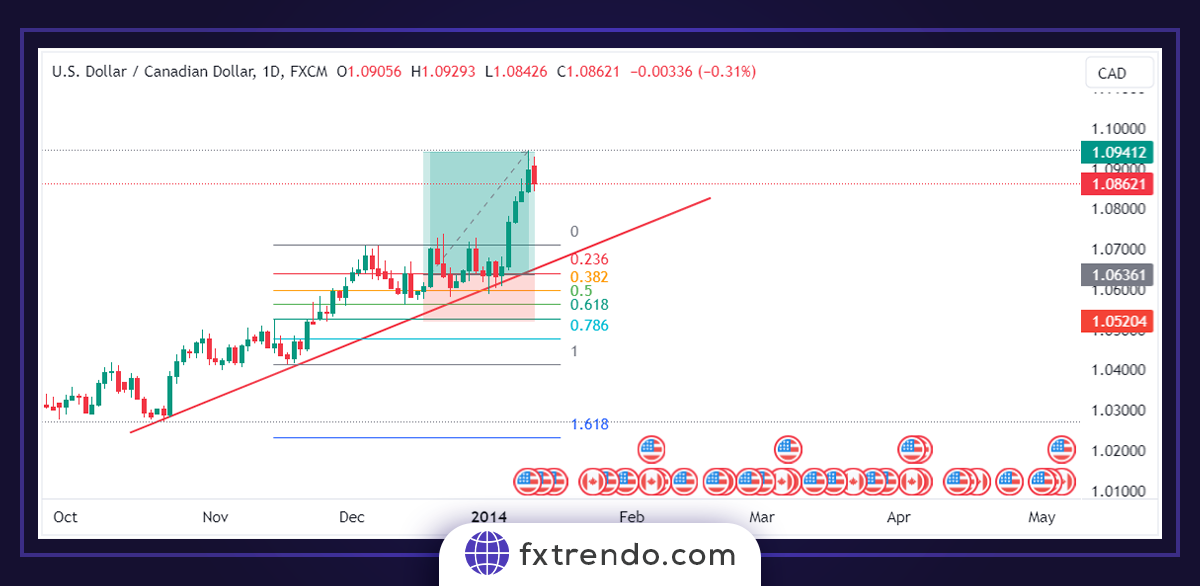
The image above shows a broader view of the chart as the market continues its uptrend and crosses the “take-profit” zone. To take advantage of the market trend’s essence, we can use a trailing stop order to maximize profit.
Fibonacci levels’ combination with candlestick patterns
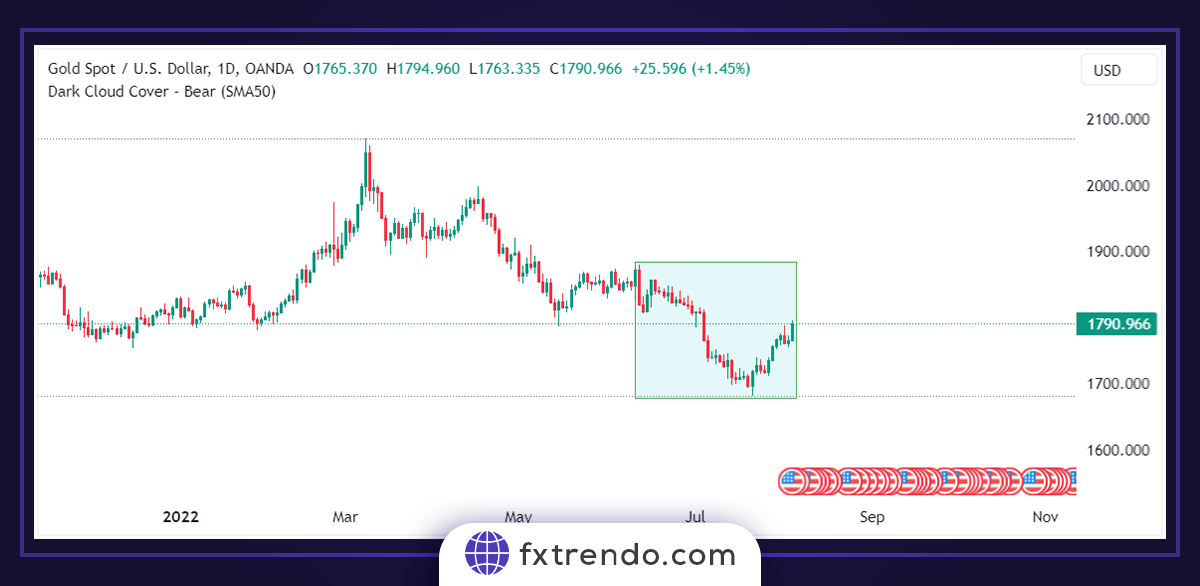
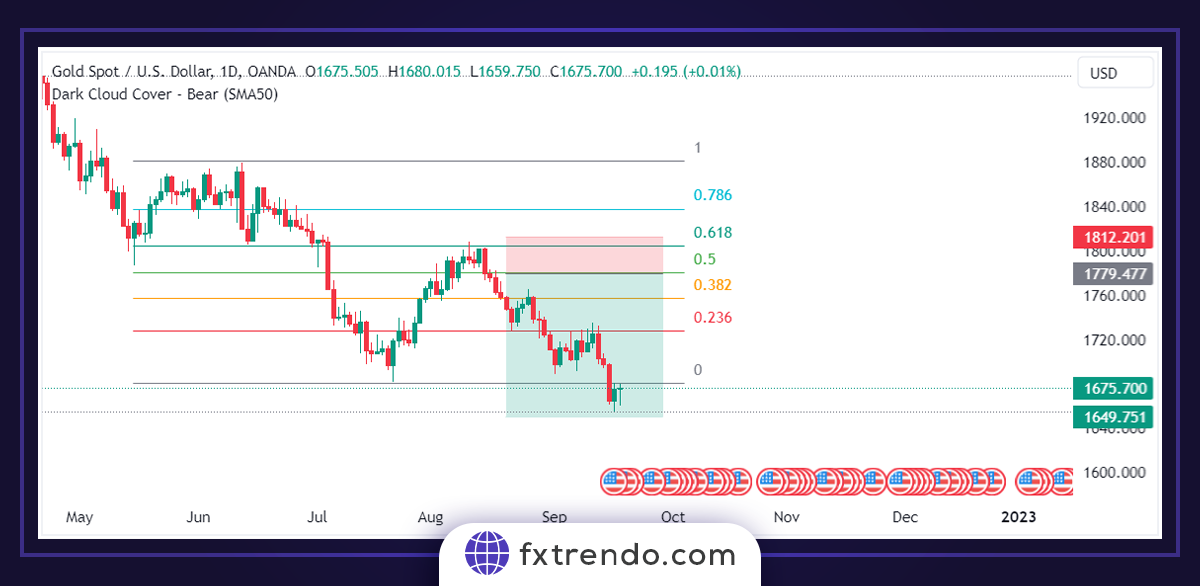
To explain this strategy, we consider a downtrend, based on which we draw our Fibonacci levels. Then wait for a price correction to react at significant Fib levels with candlestick patterns.
After drawing retracement Fibonacci levels, as shown in the chart below, we need to see what happens at significant Fibonacci levels, such as the 50% or 8.61% level. We can see that the red pin bar candle is precisely touching the 8.61% level in the chart below.
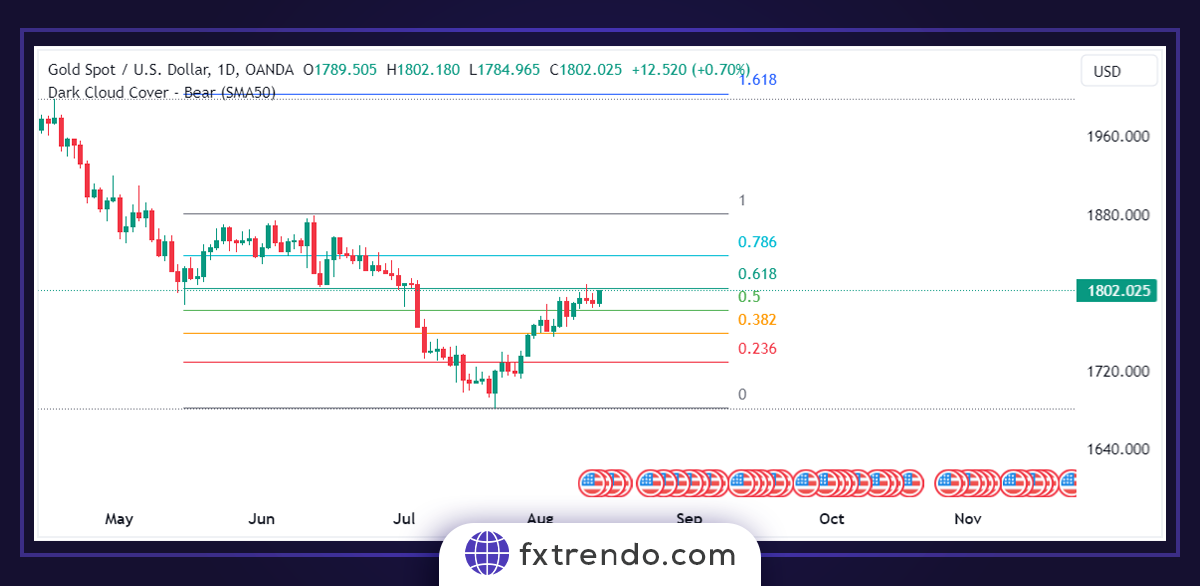
This type of candle can be a sign of trend reversal. More importantly, this pattern forms precisely at the 8.61% Fibonacci level. So, if we get a bearish move confirmation, it could lead to a sell trade.
Read More: What is a Candlestick? The Use of Candles in Analysis and Trading Strategy
In the image above, you can see the formation of a bearish confirmation candle. Therefore, we can confidently enter a sell position by placing a stop-loss above the 8.61% level with a target near the recent floor.
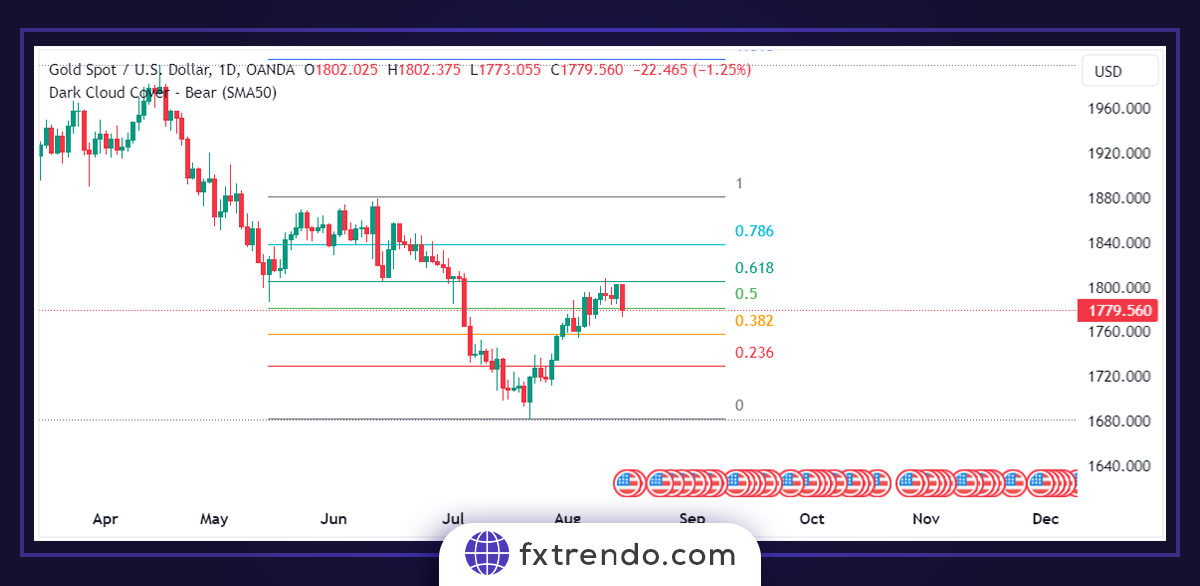
The chart above shows how our analysis works correctly, and immediately after entry, the market moves quickly in the direction of the main trend. This example shows the candlestick patterns’ accuracy when combined with Fibonacci levels.
Summary
We explored two trading strategies using a combination of Fibonacci levels with trend lines and candlestick patterns in this article. These strategies can help traders make trades with higher success probability. Fibonacci levels can help identify corrections in a trend, and combining them with candlestick patterns can increase a successful trade’s probability. Trading strategies based on Fibonacci levels can be a powerful tool for traders. However, it is crucial to remember that there is no perfect trading strategy. There is always a risk of losing money. Traders must gain sufficient knowledge and experience before using any trading strategy.