In the previous article, we learned about the basic concepts and how to draw Fibonacci levels. Here, we review how to use the Fibonacci tool alongside support and resistance levels. Support is an area where the price refuses to drop further. This level acts as a floor, and the price decline stops at it. Resistance is the opposite of support. Increasing the price in this area is difficult because it acts as a ceiling. The general idea of buying at support levels and selling at resistance levels is interesting, but blindly buying and selling at these levels carries high risk because there is no guarantee that these levels will do their job correctly every time. Therefore, we use Fibonacci levels to confirm these levels’ performance.
Trading with a support and resistance areas’ combined strategy and Fibonacci levels’ confirmation
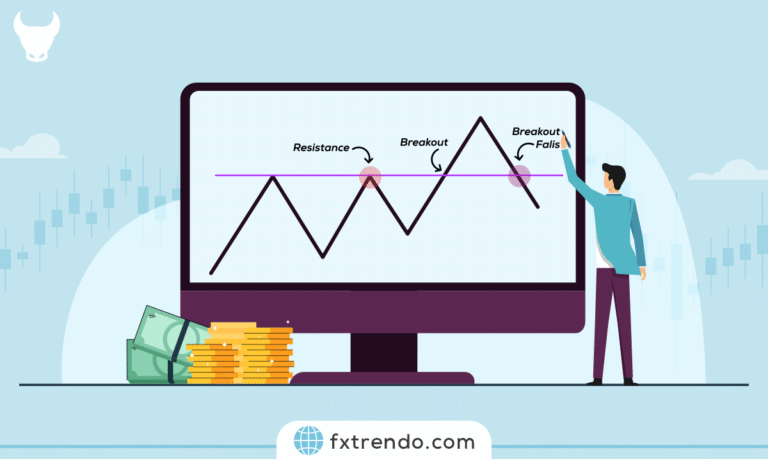
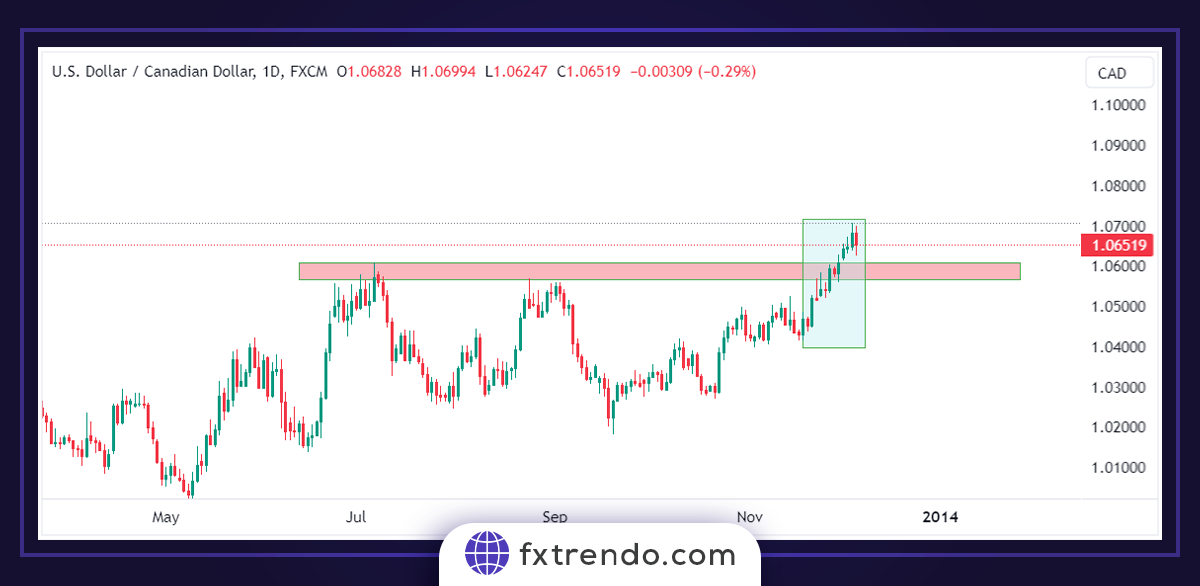
In the chart below, we have identified a strong resistance area, and now we have to wait to see if the way the resistance breaks creates a support area. We always recommend to buy with support emerging from resistance (S/R). Also, if the price has broken strong resistance with multiple collisions, it is more likely to turn into support. We see the strong price resistance zone breaking in the marked area below.
Read More: Support and resistance levels and how to draw them
We can see the price correction after the resistance break in the marked area. Therefore, we must identify the swing floor and ceiling to combine this support level with the Fibonacci levels.
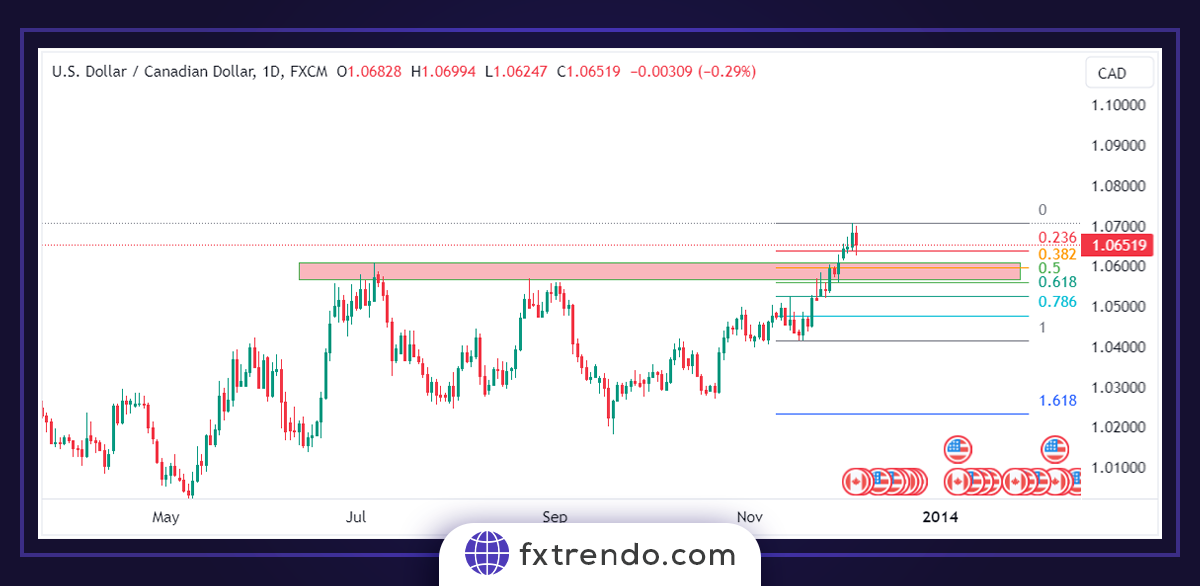
Ideally, we can confidently enter a buy trade if we get a retracement of the 8.61 or 50% Fibonacci level and a confirmation candlestick. If the market does not react at any of the Fib levels, it can be a sign that the support level is weak and can break. Based on the support and resistance conversion theory, the market should react and bounce against the previous resistance that has now turned into support. According to the chart below, it is clear that the price correction has reached the S/R line, which coincides with the 50% Fib level. These factors are signals to enter a buy trade after seeing a confirmation candlestick.
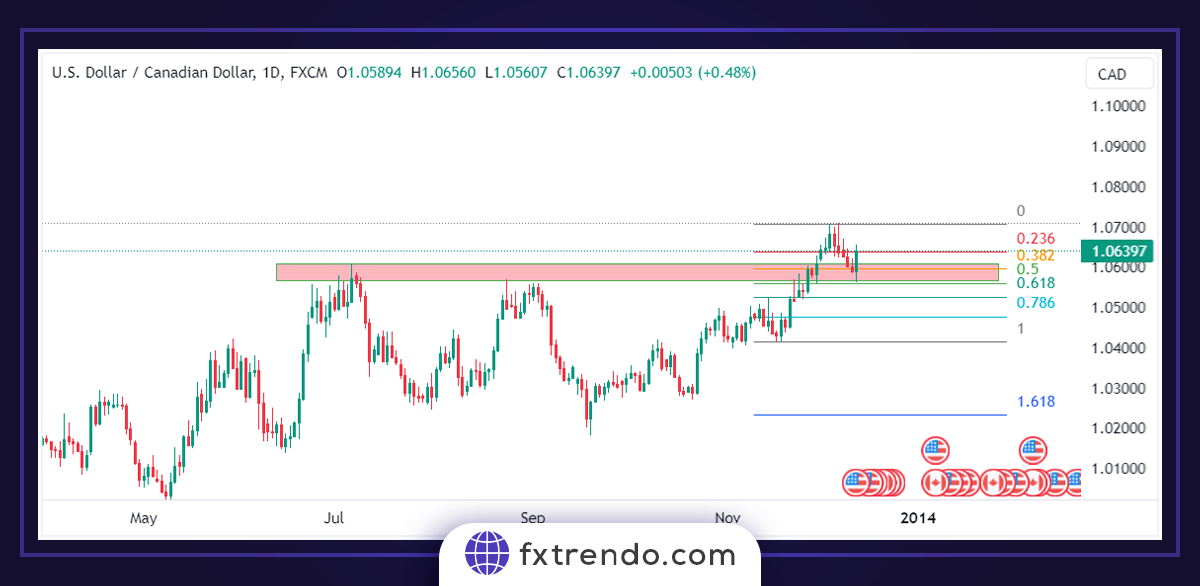
As you can see, the price has bounced right off the 50% Fibonacci level, and a bullish candlestick has formed, which gives us a confirmation. Immediately after the confirmation candlestick, we can make our buy trade with the stop-loss below the 61.8% Fibonacci level and the take-profit at the swing ceiling.
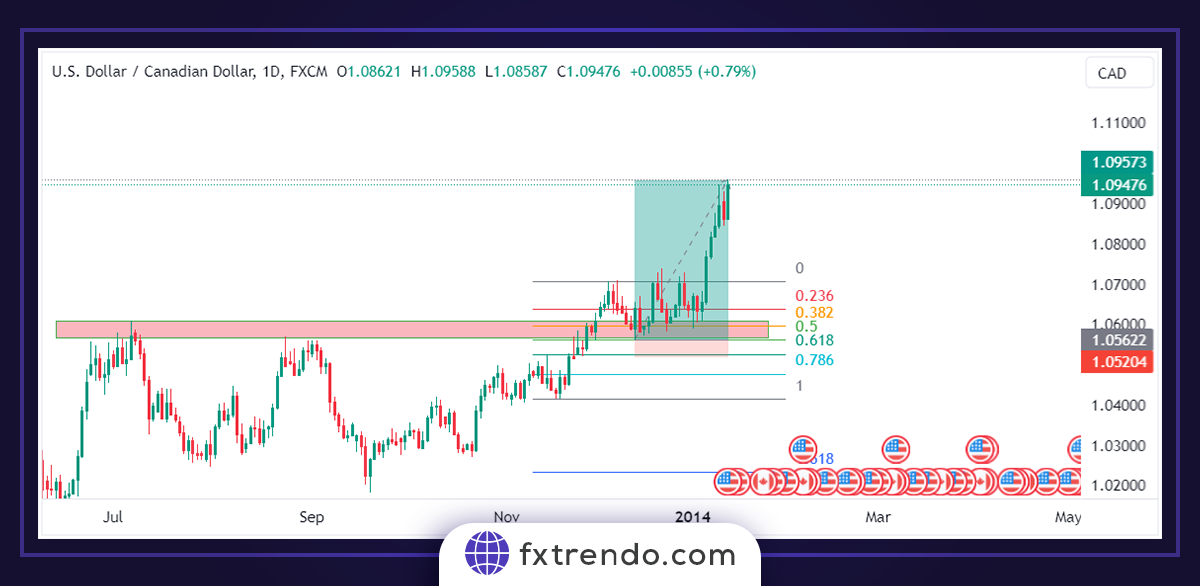
Furthermore, we can see that the market makes a higher ceiling by breaking the previous resistance levels and increases that level’s performance chances when the Fibonacci levels near the S/R are used as a confirmation tool.
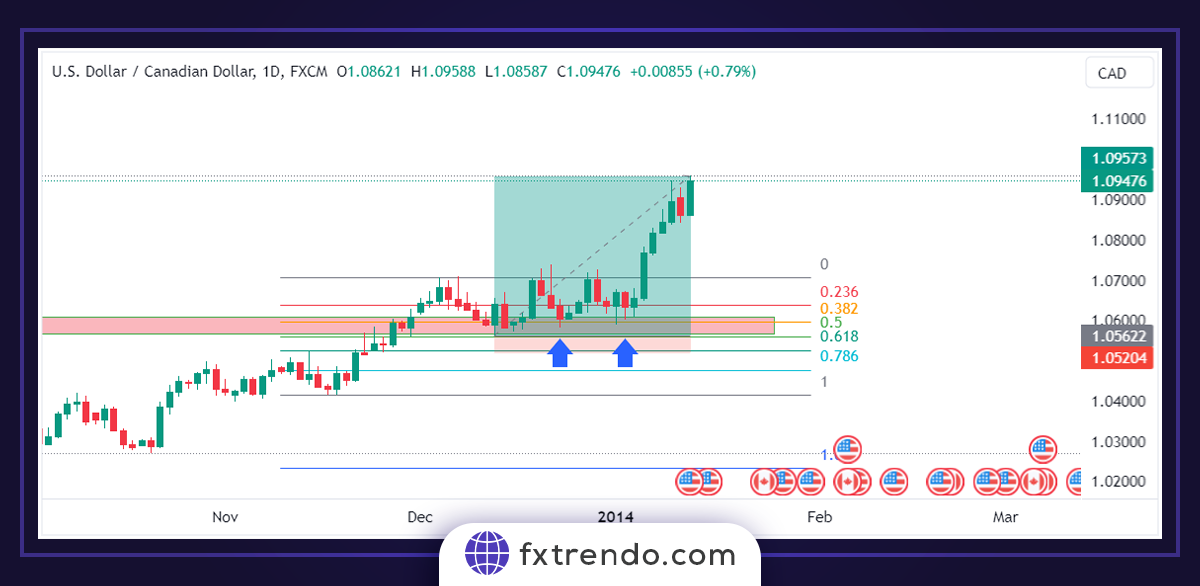
Also, as shown in the image, the chance of “buying” again occurs at the 50% Fibonacci level close to the support line. The market remains supported at this level until it ultimately breaks into an uptrend. This price swing shows the Fibonacci levels’ strength in combination with the S/R levels.