Using golden patterns in a trade signal’s confirming process in the forex market increases with the use of technical analysis tools. The purpose of this method is to evaluate the signal’s accuracy and increase the probability of success in a trade. Getting confirmation helps traders to avoid false signals and minimize the possibility of capital loss.
Types of golden patterns to get confirmation in technical analysis
Generally, there are two types of price patterns:
- Classic patterns
- Candlestick patterns
Paying attention to these patterns increases the quality of trades. Stay tuned to learn more about these patterns.
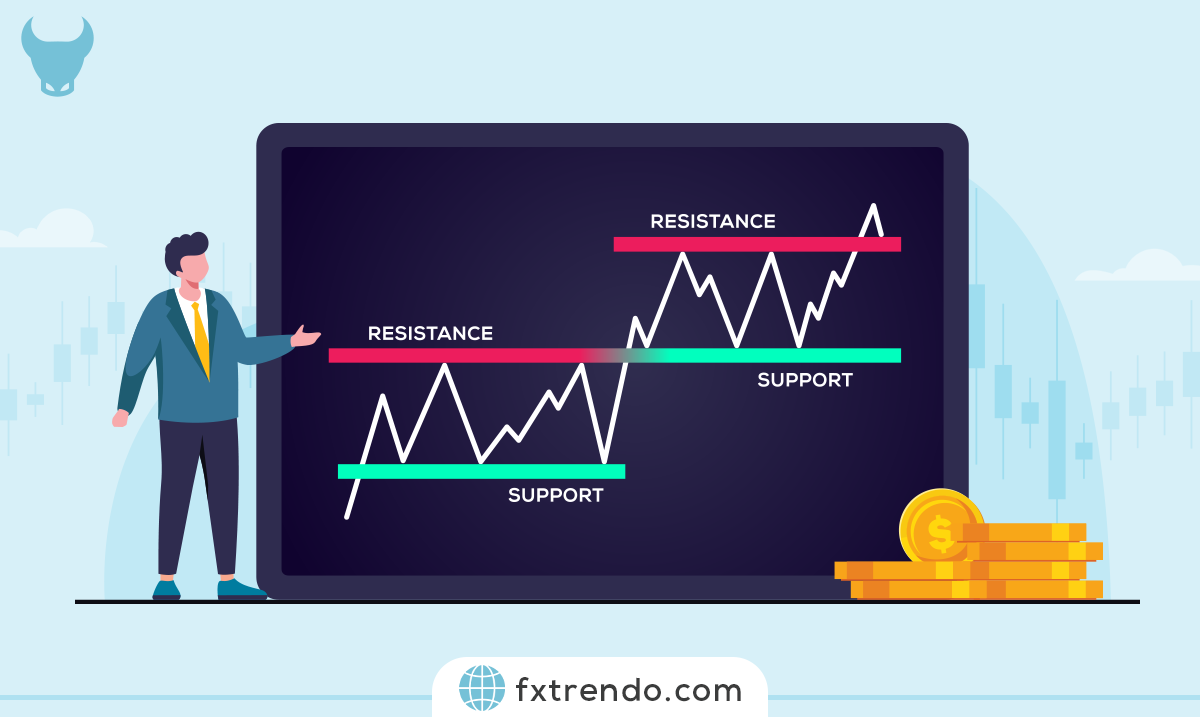
What are classic price patterns in Forex?
Classical price patterns play a price movement’s graphical representation role in a certain period. These patterns provide valuable information about market trends, possible reversals, and future price changes for traders. These patterns have the supply and demand forces’ effect in the market and repeat frequently due to human psychology and market behavior’s influence.
There are two main types of chart patterns:
- Continuing patterns
- Recursive patterns
Further, we briefly explain the above patterns.
Continuing Patterns: Continuing patterns indicate that the current trend will likely continue after a temporary stop or stabilization. These patterns suggest that the market is taking a breather before resuming its previous path. Continuing patterns are often seen as a sign of market strength, and traders seek opportunities to join the current trend.
Recursive Patterns: Recursive patterns, as the name suggests, indicate a potential reversal in the current trend. These patterns occur when price movement changes direction, indicating a possible change in market sentiment. Recursive patterns are often seen at the end of a trend when the market is about to change direction.
Read More: What are price retracement and reversal trends, and how to identify them?
Traders can predict the next move in the market and adjust their trading strategies accordingly by identifying these patterns.
Types of common classic price patterns in the Forex market
While there are many classic price patterns, some are seen more commonly in the forex market. These patterns are:
- Double bottom and double top
- Standard and reverse head and shoulder
- Triangle Types
Further, we will explain these patterns.
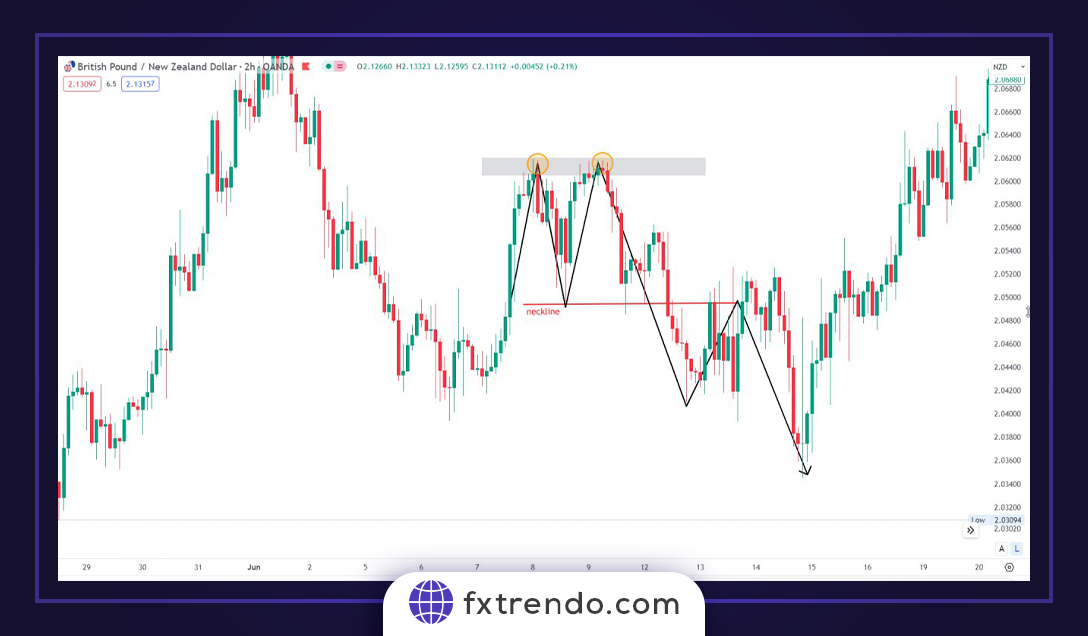
Double bottom and double top: A double top pattern is a bearish pattern usually formed on a price chart by two consecutive ceiling formations approximately the same size. This pattern shows the power of sellers. In an uptrending asset, the ceiling is usually formed near a resistance zone first. In most cases, the momentum of the second ceiling is slower, and we can confirm by decreasing the trading volume. Slower movement is a good sign that buyers are not so strong right now, and sellers can effortlessly take over the market. After the pattern is completed, we still need to confirm the pattern with a lower bottom formation.
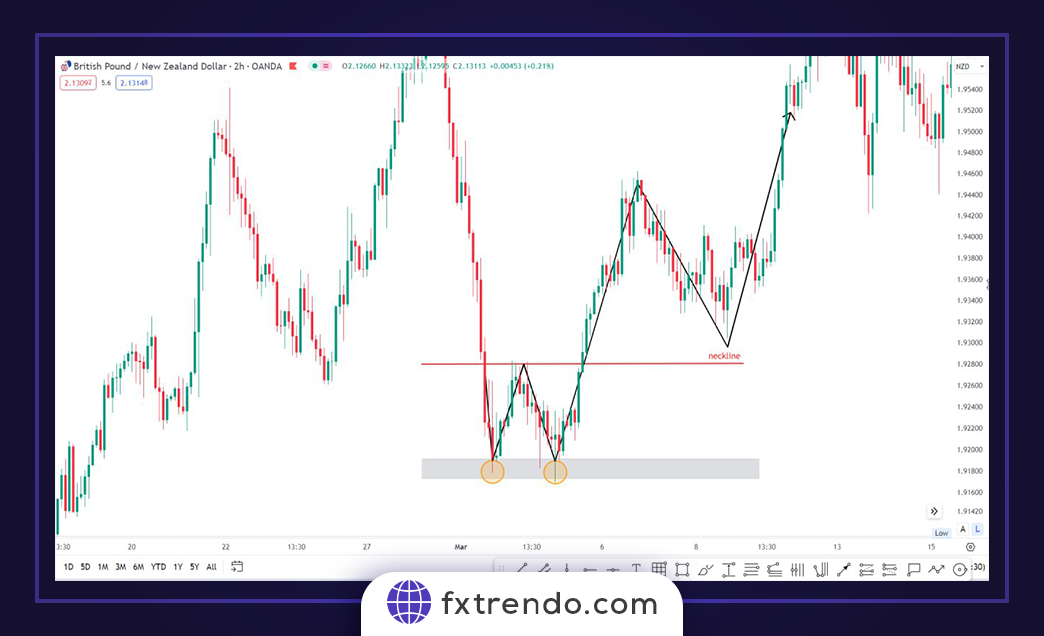
A double bottom pattern is a bullish pattern usually formed on a price chart by two consecutive bottom formations approximately the same size. This pattern shows the power of buyers. In a down-trending asset, the bottom is usually formed near a support area first. In most cases, the second bottom’s momentum is slower, and we can confirm by decreasing the trading volume. Slower movement is a good sign that sellers are not so strong right now, and buyers can effortlessly take over the market. After completing the pattern, we still need to confirm the pattern by forming a higher ceiling.
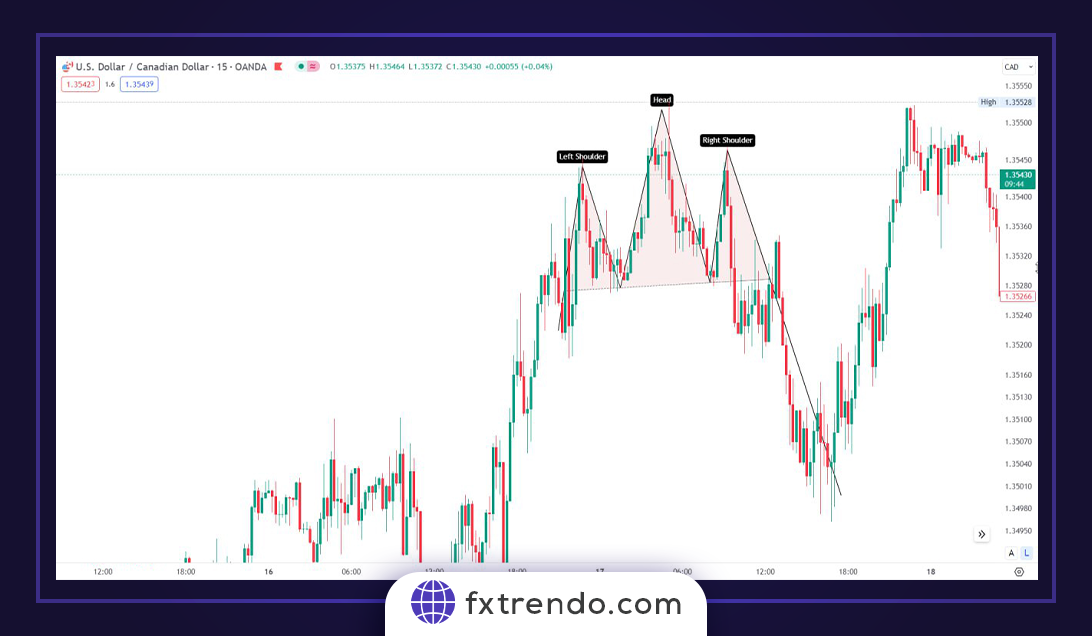
Standard and Reverse Head and Shoulders Patterns: The standard head and shoulders pattern is another popular reversal pattern, but it differs in structure from the double top pattern. This pattern consists of three tops: a higher top in the middle (head) and two lower on the sides (shoulders). The first and third tops are almost at the same level. As with the double top pattern, the head and shoulders pattern indicates an uptrend’s reversal. Traders identify this pattern by connecting two troughs formed between tops, which creates a neckline. Confirmation of the pattern occurs when the price breaks the neckline downward.
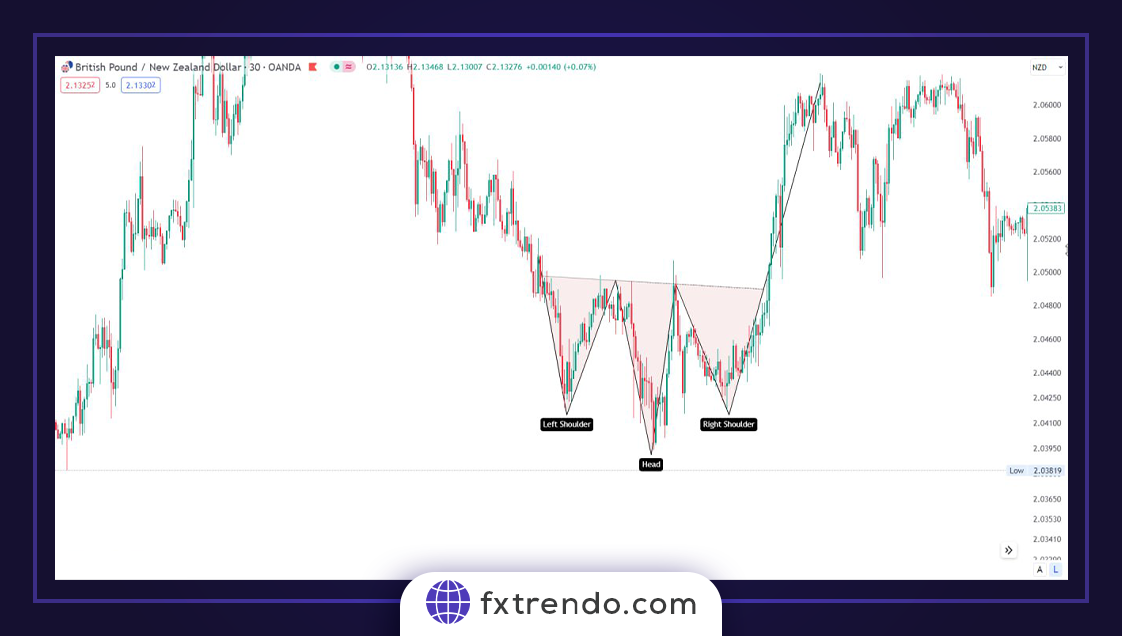
The reverse head and shoulder pattern is the opposite of the standard pattern and indicates a possible reversal of the trend from bearish to bullish. It consists of three bottoms: left shoulder, head, and right shoulder. The neckline connects the peaks between the left shoulder and the head and between the head and the right shoulder. The pattern is complete when the price breaks the neckline upward.
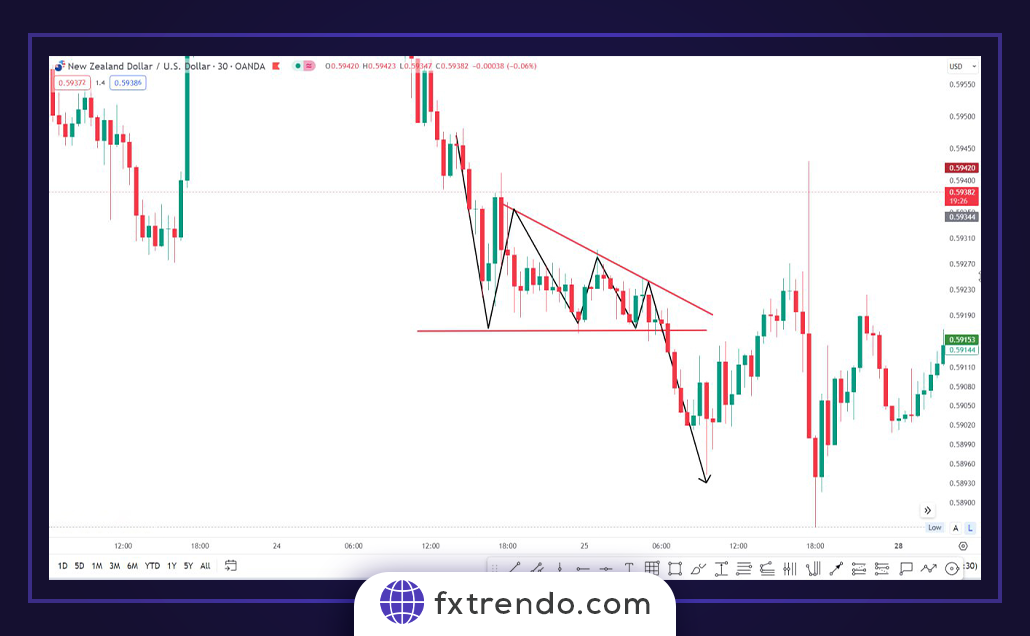
Triangle types: One of these significant patterns in the forex market is the triangle pattern. Triangles are powerful price patterns that can provide valuable insights into market direction and potential breakout points. Here, we will discuss three triangle patterns in forex trading:
Symmetrical Triangle: A symmetrical triangle is a consolidation pattern that occurs when the market has not decided on its next move and is formed by connecting a series of higher floors and lower ceilings. This pattern shows that buyers and sellers are in balance and there is a breakout possibility. Traders often wait for a break above or below before entering a trade. The breakout direction can provide a clue about the market direction.
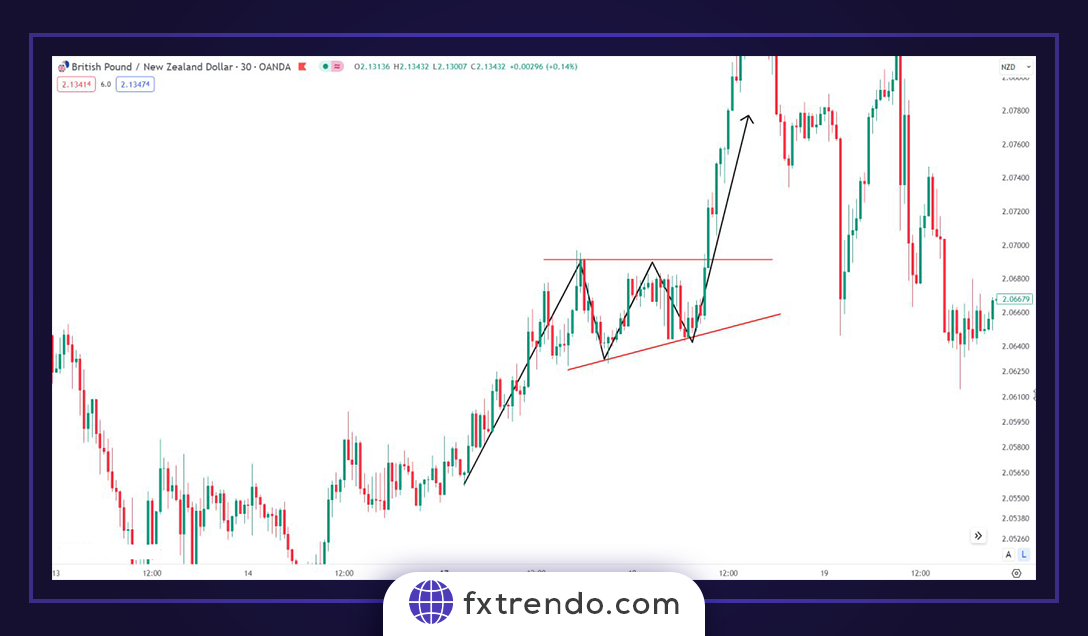
Ascending Triangle: An ascending triangle is an ascending pattern that indicates the possibility of an upward breakout. This pattern is formed by connecting a series of higher lows and a horizontal resistance line. This pattern implies that buyers are becoming more aggressive and likely will push the price higher. Traders often wait for a break above the resistance line to enter a buy position.
Descending Triangle: A descending triangle is a descending pattern that indicates a possible downward breakout. This pattern is formed by connecting a series of lower ceilings and a horizontal support line, implying that sellers are more aggressive and likely to lower the price. Traders often wait for a downward breakout of the support line to enter a sell position.
Common candlestick patterns in the forex market
The candlestick patterns developed in Japan in the 18th century and were used to analyze the future price of rice. These patterns were later introduced to the Western world by Steve Nison in his book “Japanese Candlestick Charting Techniques.” Today, candlestick patterns are used widely by forex traders to interpret market sentiment and predict future price changes, as well as to get confirmation on trades. Some of the popular candlestick patterns in the forex market are:
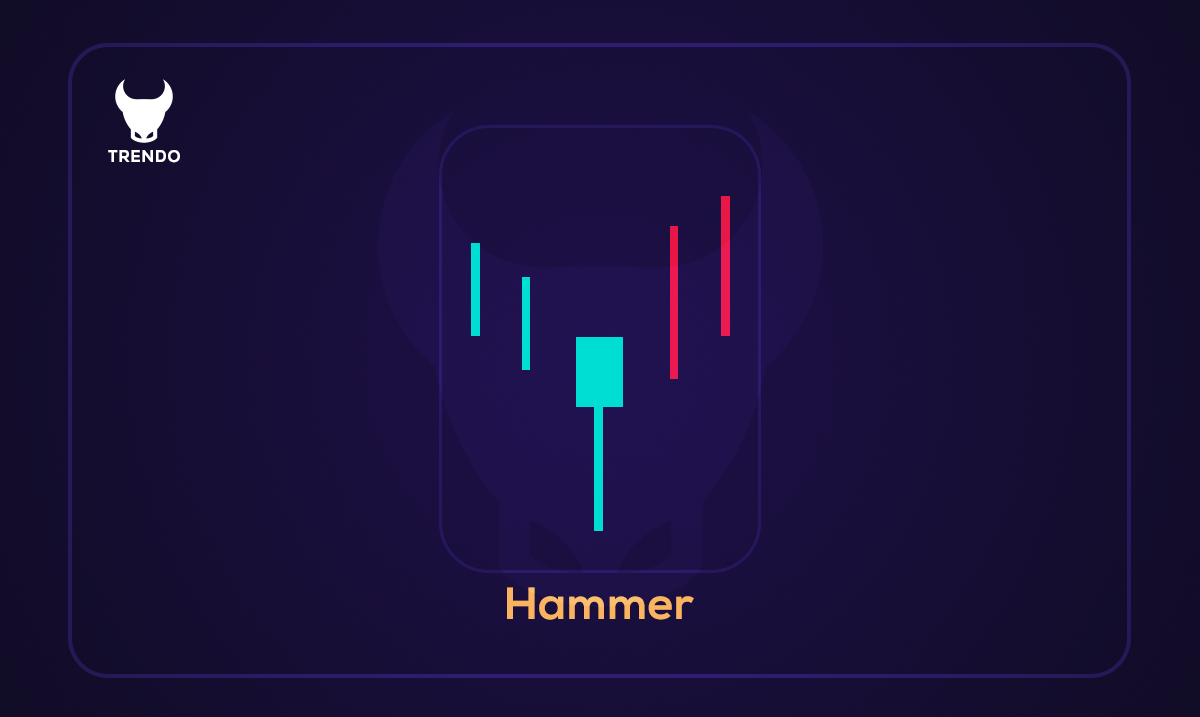
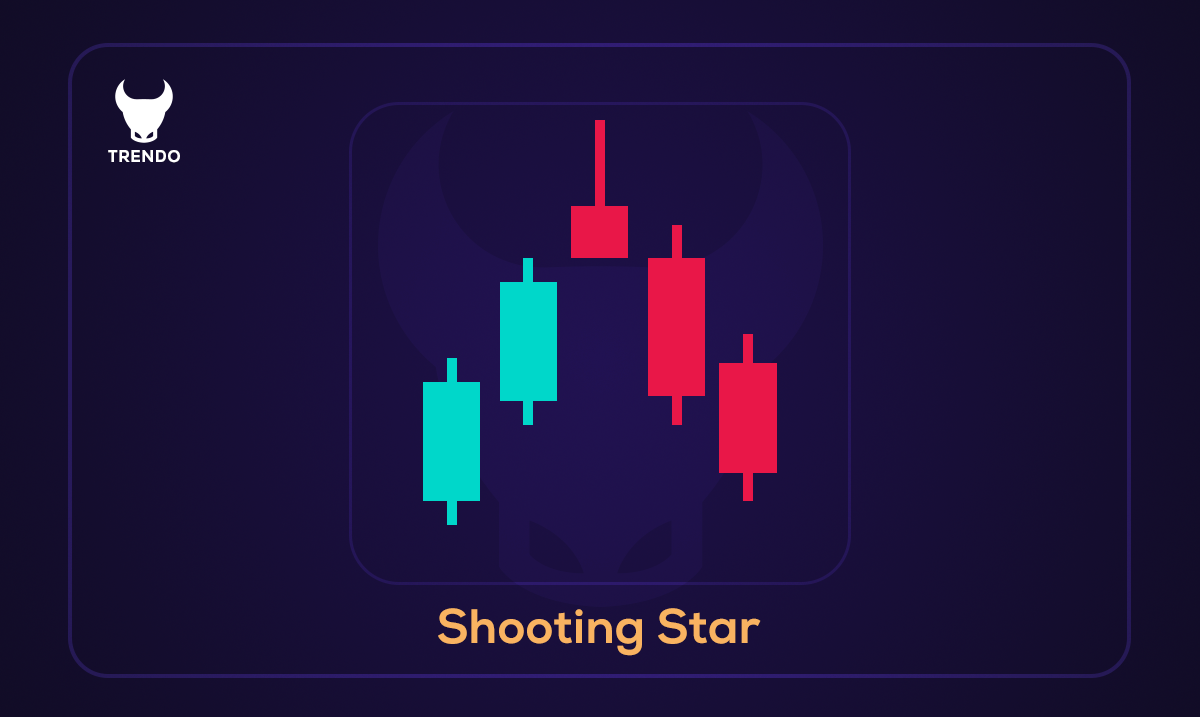
- Hammer and shooting star pattern
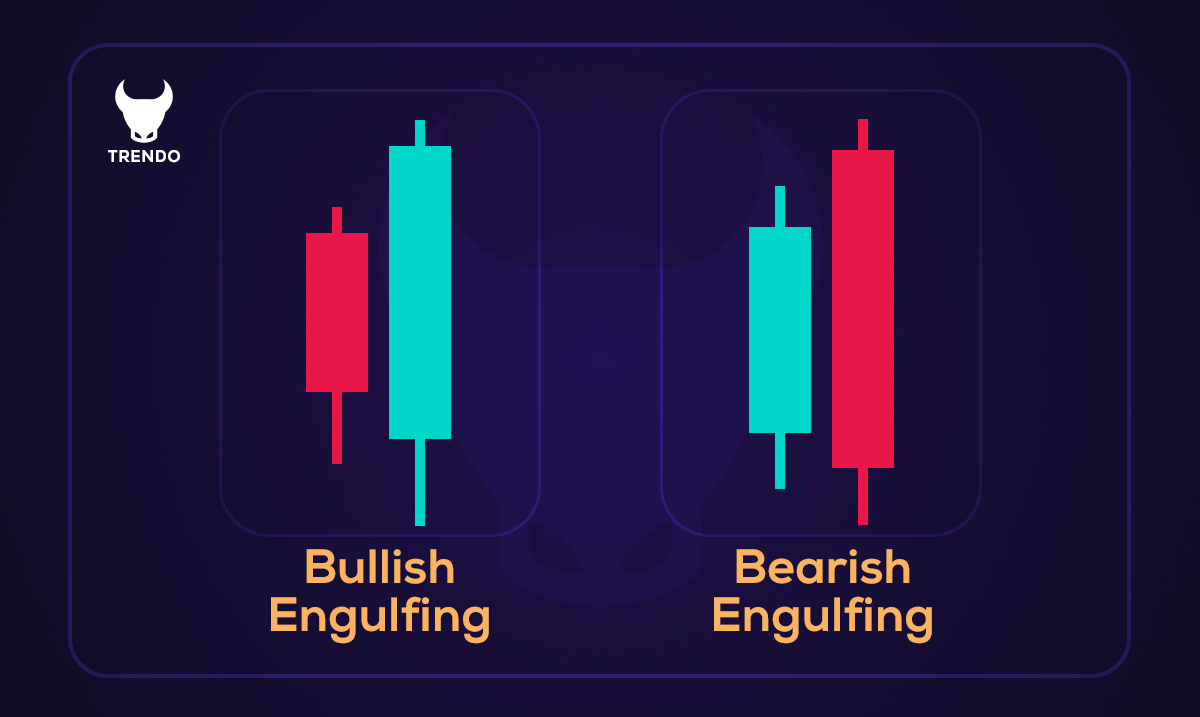
- Bullish and Bearish Engulfing pattern
- Morning and evening star pattern
Further, we will briefly explain each pattern.
Hammer and Shooting Star Pattern: Hammer and Shooting Star patterns are also widely used by Forex traders. A hammer pattern occurs when the candlestick opens near the high price, declines significantly during the time frame, and finally closes near the high price. This pattern indicates a potential trend reversal to an uptrend.
Conversely, a shooting star pattern occurs when the candlestick opens near the minimum price, rises significantly during the trading timeframe, and finally closes near the minimum price. This pattern indicates a possible return to a downtrend.
Bullish and bearish engulfing pattern: Another important candlestick pattern is the engulfing pattern. An engulfing pattern occurs when a larger candlestick follows a smaller one and surrounds the previous candlestick. This pattern represents a price trend reversal and is often used by traders to enter or exit trades. A bullish engulfing pattern occurs at the end of a downtrend and implies a possible reversal to an uptrend, while a bearish engulfing pattern occurs at the end of an uptrend and indicates a potential reversal to a downtrend.
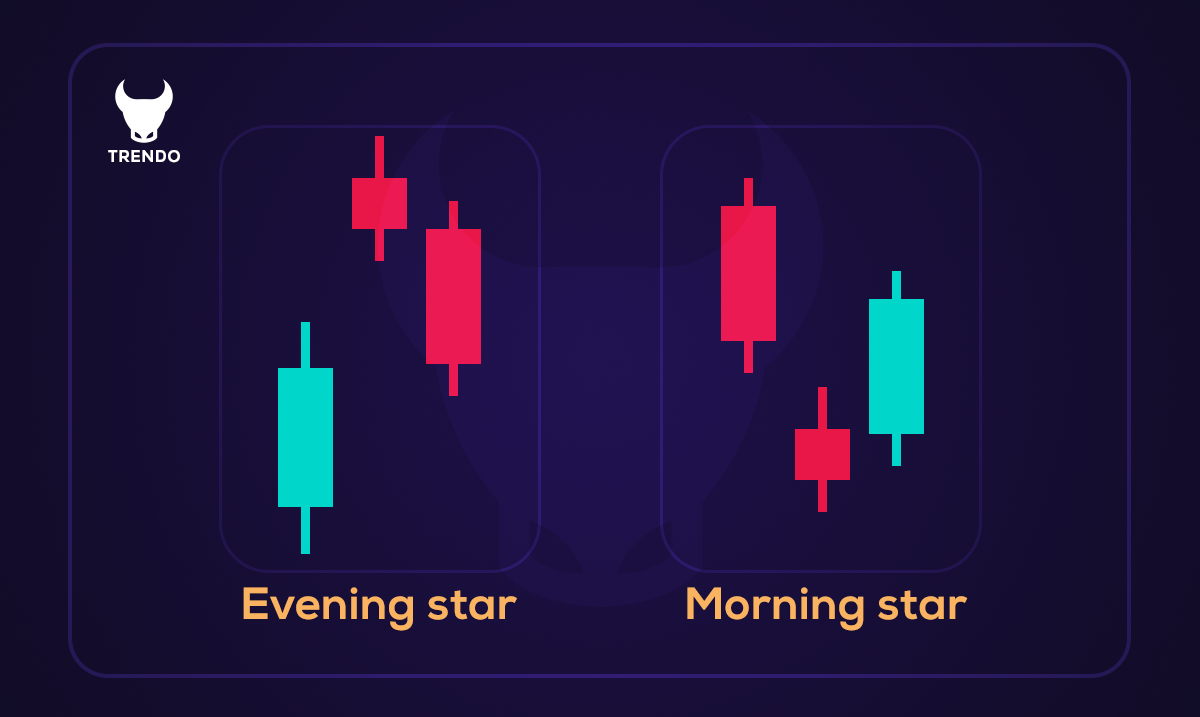
Morning and Evening Star Pattern: The morning star is a three-candlestick pattern at the end of a downtrend. Mercury is the morning star that foretells the sunrise and the day’s arrival in astronomy. That was the name given to this pattern by the Japanese because they saw it as the origin of a new uptrend. As mentioned, this pattern is formed by three candles, the first of which is a big red candle. The second candle starts with a gap and continues its downward movement for a while, then the price rises and closes near the opening price, forming a small body. The third candle is a green candle that closes near the opening price of the first red candle. The significant factor in this pattern is the third candle’s closing above the half-body of the first red candle.
The evening star is the opposite of the morning star, and the Japanese associated this pattern with the planet Venus as a sign of the setting sun. This pattern forms when a long green candlestick is accompanied by a small candlestick and a large red candlestick. As with the morning star pattern, a gap is created in the second small candle, and the third candle descends at least halfway to the first candle.
Read More: Gap in Forex (types of Gap and trading strategy in Gap)
Summary
Entering a position always requires final confirmation. In this article, we discussed price patterns that provide ideal signals to the trader in detail. Of course, there are many price patterns, including classic and candlestick patterns. But we are trying to identify the best ones that help our strategy and increase profitability. To boost the quality of trading, it is essential that traders carefully pay attention to price patterns and benefit from other confirmations such as technical indicators and market news. These measures can help to make better decisions and reduce risk in trading. Also, remember that a balance between technical and fundamental analysis will play a vital role in your trading success.