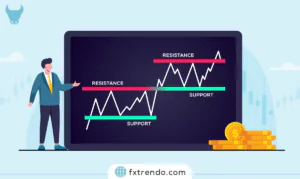


The “AB=CD” pattern is one of the simplest patterns that describes price movement in an uptrend or downtrend with 3 swings.
By understanding and utilizing the ABCD pattern, traders can make more informed decisions and improve their chances of success.
In this article, we’ll delve into the intricacies of the ABCD pattern, exploring its formation, key characteristics, and how to effectively trade using this pattern.
Whether you’re a novice trader or an experienced professional, mastering the ABCD pattern can be a valuable addition to your trading toolkit.
Let’s get started on this journey to enhance your trading skills and boost your confidence in the market.
What is the ABCD Pattern?
We learned about the AB=CD pattern and the rules for identifying it on the chart in the article “The Ultimate Guide to Harmonic Pattern Trading Strategy”. Now we will explain this pattern in more detail.
The ABCD pattern is a chart pattern in technical analysis used to predict market reversals. It consists of three price movements forming a zigzag shape, creating four points: A, B, C, and D.
The pattern starts with an initial price move (AB), followed by a retracement (BC), and ends with a continuation move (CD) that mirrors the AB segment.
This pattern helps traders identify potential entry and exit points by highlighting areas where the market might change direction.
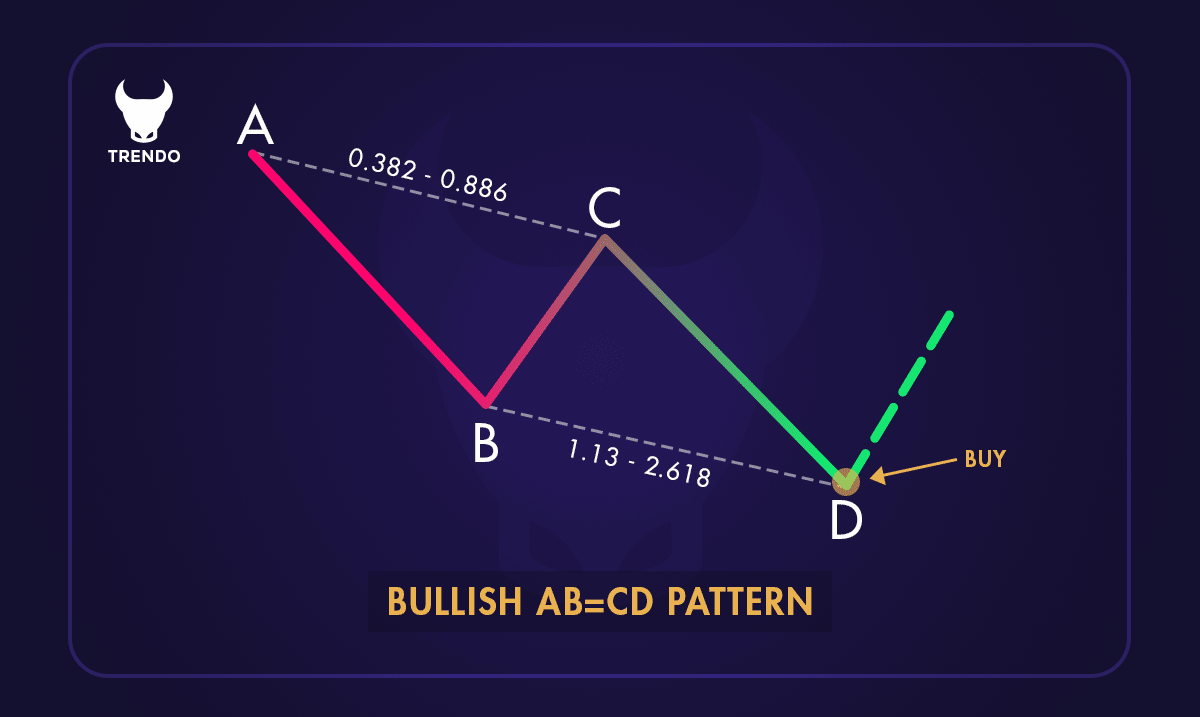
Bullish AB=CD Pattern
The ABCD pattern has been a staple in technical analysis for many years. It was popularized by H.M. Gartley in his book “Profits in the Stock Market,” published in 1935.
Gartley introduced harmonic patterns, including the ABCD pattern, to help traders understand the market’s natural rhythm. Over time, the ABCD pattern has become a fundamental tool for traders, especially in day trading and intraday analysis.
Key Characteristics of the ABCD Pattern
Symmetry:
The AB and CD legs are typically of equal length and duration, creating a balanced pattern.
Retracement:
The BC leg usually retraces 61.8% to 78.6% of the AB move.
Predictability:
The pattern’s predictability makes it a reliable tool for identifying potential market reversals.
Versatility:
The ABCD pattern can be used in various markets, including stocks, forex, and commodities.
How to Identify the ABCD Pattern?
The ABCD pattern is represented by four key points (A, B, C, and D) forming a distinct shape on a price chart. It looks like a zigzag where the price moves from A to B, retraces to C, and then moves to D. This pattern can be found in both upward and downward trends.
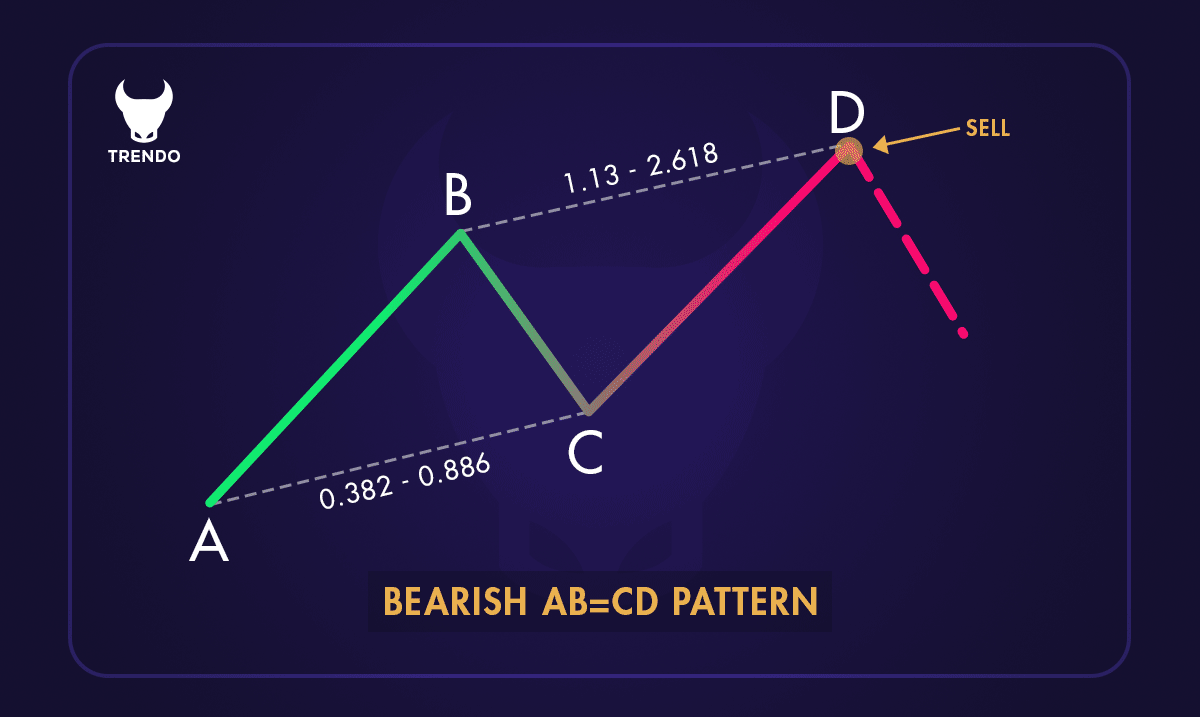
A descending (Bearish) AB=CD pattern
Identifying the ABCD pattern involves recognizing a specific sequence of price movements on a chart. This pattern is composed of four distinct points: A, B, C, and D.
Here’s a step-by-step guide to help you identify the ABCD pattern:
1. Point A to Point B:
The pattern begins with an initial price movement from Point A to Point B. This is typically a strong upward or downward move, indicating the start of a new trend.
2. Point B to Point C:
After reaching Point B, the price retraces to Point C. This retracement is usually a correction of the initial move and should be less than the distance from A to B. The retracement often falls within a specific Fibonacci ratio, such as 61.8% or 78.6%.
3. Point C to Point D:
The final leg of the pattern is the move from Point C to Point D. This move should mirror the initial A to B move in terms of length and duration. Point D is the completion of the pattern and often represents a potential reversal point.
4. Symmetry and Proportions:
One of the key characteristics of the ABCD pattern is its symmetry. The distance and time taken for the moves from A to B and C to D should be roughly equal. This symmetry helps traders anticipate the completion of the pattern and potential price reversals.
Criteria for Identifying the Pattern
To identify the ABCD pattern, look for:
Symmetry:
The distance and time taken for the moves from A to B and C to D should be roughly equal.
Fibonacci Ratios:
The retracement from B to C often falls within specific Fibonacci ratios, such as 61.8% or 78.6%.
Trend Continuation:
The pattern typically appears in the context of a larger trend, indicating a potential continuation or reversal.
Point A to Point B
The pattern starts with a strong price movement from Point A to Point B. This move sets the initial trend direction and is characterized by a significant price change.
Point B to Point C
After reaching Point B, the price retraces to Point C. This retracement is a correction of the initial move and should be less than the distance from A to B. The retracement often aligns with Fibonacci ratios, providing a clue to the pattern’s formation.
Point C to Point D
The final leg of the pattern is the move from Point C to Point D. This move should mirror the initial A to B move in terms of length and duration. Point D marks the completion of the pattern and often signals a potential reversal point.
Why Trade with the ABCD Pattern?
Trading with the ABCD pattern offers several benefits that can enhance your trading strategy and improve your performance. Here are some key reasons to use the ABCD pattern:
1. Simplicity and Clarity
The ABCD pattern is easy to understand, making it accessible for traders of all experience levels. Its clear structure helps traders quickly identify potential trading opportunities.
2. Reliable Entry and Exit Points
The pattern provides well-defined entry and exit points. By recognizing the completion of the pattern at Point D, traders can anticipate potential reversals and plan their trades.
3. Risk Management
Using the ABCD pattern helps traders manage risk effectively. By identifying key levels of support and resistance, traders can set stop-loss orders and take-profit targets with precision.
4. Versatility
The ABCD pattern can be applied to various financial markets, including stocks, forex, commodities, and cryptocurrencies. Its versatility makes it a valuable tool for diversifying trading strategies.
5. Enhances Technical Analysis Skills
Trading with the ABCD pattern encourages traders to develop their technical analysis skills. By studying price movements and recognizing patterns, traders can gain a deeper understanding of market behavior.
6. Complements Other Trading Strategies
The ABCD pattern can be used with other technical analysis tools and indicators, such as moving averages, trend lines, and Fibonacci retracements. This complementary approach can provide additional confirmation for trading decisions.
Advantages and Limitations of ABCD Patterns
Advantages
1. Clear Entry and Exit Points:
The ABCD pattern provides clear signals for entering and exiting trades, aiding in effective trade planning and execution.
2. Versatility:
This pattern can be applied across various markets, including stocks, forex, and commodities, and works well on different time frames.
3. Predictability:
The pattern’s structure allows traders to anticipate market movements, improving decision-making and potentially increasing profitable trades.
4. Simplicity:
The ABCD pattern is relatively easy to identify, even for novice traders, making it a popular choice for simplifying analysis.
Limitations
1. False Signals:
The ABCD pattern is not foolproof and can produce false signals. Traders must use additional technical analysis tools and indicators to confirm the pattern and avoid potential losses.
2. Market Conditions:
The effectiveness of the ABCD pattern can vary depending on market conditions. In highly volatile or trending markets, the pattern may not perform as well, leading to less reliable signals.
3. Subjectivity:
Identifying the ABCD pattern can be subjective, as different traders may interpret price movements differently. This subjectivity can lead to inconsistencies in pattern recognition and trading decisions.
4. Requires Practice:
Successfully trading with the ABCD pattern requires practice and experience. Traders need to develop their skills in identifying the pattern and understanding its nuances to use it effectively.
5. Limited Predictive Power:
While the ABCD pattern can provide valuable insights into potential price movements, it is not a guarantee of future performance. Traders should use the pattern as part of a broader trading strategy and not rely solely on it for making trading decisions.
How to Trade Using the ABCD Pattern?
Trading with the ABCD pattern involves several steps to ensure informed decisions. Here’s a simple guide:
Step 1: Identify the Pattern
Locate the ABCD pattern on your chart. Look for the initial price move (AB), the retracement (BC), and the continuation move (CD). Ensure the AB and CD legs are roughly equal in length and duration, and the BC leg retraces 61.8% to 78.6% of the AB move.
Step 2: Confirm the Pattern
Use additional technical indicators to confirm the pattern. Volume analysis can be helpful; increasing volume during the AB and CD legs indicates strong market interest. Other indicators like RSI or MACD can also provide confirmation.
Step 3: Set Entry Points
Once the pattern is confirmed, set your entry point at or near Point D. This is where the pattern completes and often signals a potential market reversal. Ensure you have a clear entry strategy.
Step 4: Manage Risk
Risk management is crucial. Set stop-loss orders below Point D to limit potential losses if the market moves against you. Determine your risk tolerance and stick to it.
Step 5: Plan Your Exit
Have a clear exit strategy. You can set profit targets based on the length of the AB leg or use trailing stops to lock in profits as the market moves in your favor. Be disciplined and avoid emotional trading.
Step 6: Monitor the Trade
Keep an eye on the trade and be ready to adjust your strategy if market conditions change. Stay informed about market news and events that could impact your trade.
By following these steps, you can effectively trade using the ABCD pattern. This approach helps you anticipate market reversals and make informed trading decisions.
Conclusion
The AB=CD pattern is one of the most popular trading patterns in the market. Identifying, confirming, and trading with this pattern is also simple. Additionally, we frequently see this pattern in the market, and traders can combine it with other technical analysis methods to increase their chances of success.
Finally, remember to adhere to capital management rules, as failure to do so will inevitably lead to failure in financial markets.
FAQ
What is the ABCD pattern in trading harmonic?
Is the ABCD pattern bearish or bullish?
How to measure ABCD pattern?
What happens after ABCD pattern?
Do harmonic patterns work in trading?
What is the ratio of AB CD harmonic pattern?
Is there a tool to easily draw AB=CD harmonic pattern?
Can the AB=CD pattern be used alone?