کاربرد و ترید الگوهای هارمونیک یکی از مباحث تکمیلی و پیشرفته تحلیل تکنیکال است و برای تسلط بر آنها نیاز به تمرین زیادی دارید. کشف این الگوهای هارمونیک به دهه 1930 برمیگردد. H.M.Gartley، نویسنده و تحلیلگر تکنیکال آمریکایی، ترید با این الگوهای منحصربهفرد را در کتاب خود با نام «سود در بازار سهام» مطرح کرد.
الگوهای هارمونیک چیست؟
الگوهای هارمونیک در نمودار قیمت ظاهر شده و اغلب شکل آنها شبیه پرندگان و حیوانات است. بهعنوانمثال، یکی از الگوهای هارمونیک شناخته شده، الگوی پروانه است و وقتی این الگو کامل شد، میتوانیم ساختاری پروانهمانند را در نمودارهای قیمتی ببینیم. همه الگوهای هارمونیک ماهیت صعودی و نزولی دارند. یعنی این الگوها را میتوان در هر دو
بازار صعودی و نزولی شناسایی و معامله کرد. همچنین برخی از الگوهای هارمونیک حاکی از ادامهدار بودن روند فعلی بازار دارند و برخی از آنها برگشت روند را نشان میدهند.
چرا شناخت الگوهای هارمونیک مهم است؟
الگوهای هارمونیک معاملات مبتنی بر الگوهای چند کندلی هستند که شامل یک ابزار تکنیکال اضافی جهت تأیید میباشند و این ابزار چیزی جز سطوح فیبوناچی شناخته شده نیست. الگوهای هارمونیک را فقط میتوان با تحلیل سطوحی که قیمت جهت خود را تغییر میدهد تأیید کرد. تنها درصورتیکه این سطوح با سطوح فیبوناچی از پیش تعریف شده مطابقت داشته
باشند، میتوانیم این الگوها را تأیید و معامله کنیم. معاملات هارمونیک معاملهگران را قادر میسازد تا حرکات آتی قیمت یک دارایی را بادقت بیشتری نسبت به هر روش دیگری پیشبینی کنند.
حتما بخوانید:
کاربرد سطوح فیبوناچی در معاملهگری فارکس
چند الگوی هارمونیک وجود دارد؟
الگوهای هارمونیک زیادی وجود دارد که پنج الگوی آن اغلب توسط معاملهگران برای ترید در بازار فارکس استفاده میشود. نحوه معامله هر یک از این الگوها یکسان است و باید منتظر بمانیم تا یک الگوی هارمونیک خاص به طور کامل در نمودار قیمت شکل بگیرد. سپس برایناساس وارد پوزیشن خرید یا فروش شویم. در ادامه، پنج الگوی هارمونیک را که
در زیر ذکر کردهایم، موردبحث قرار خواهیم داد:
- الگوی پروانه (Butterfly)
- الگوی گارتلی (Gartley)
- الگوی خفاش (Bat)
- الگوی خرچنگ (Crab)
- الگوی AB=CD
با ما همراه باشید تا نحوه شناسایی این الگوها را به سادهترین شکل ممکن یاد بگیرید.
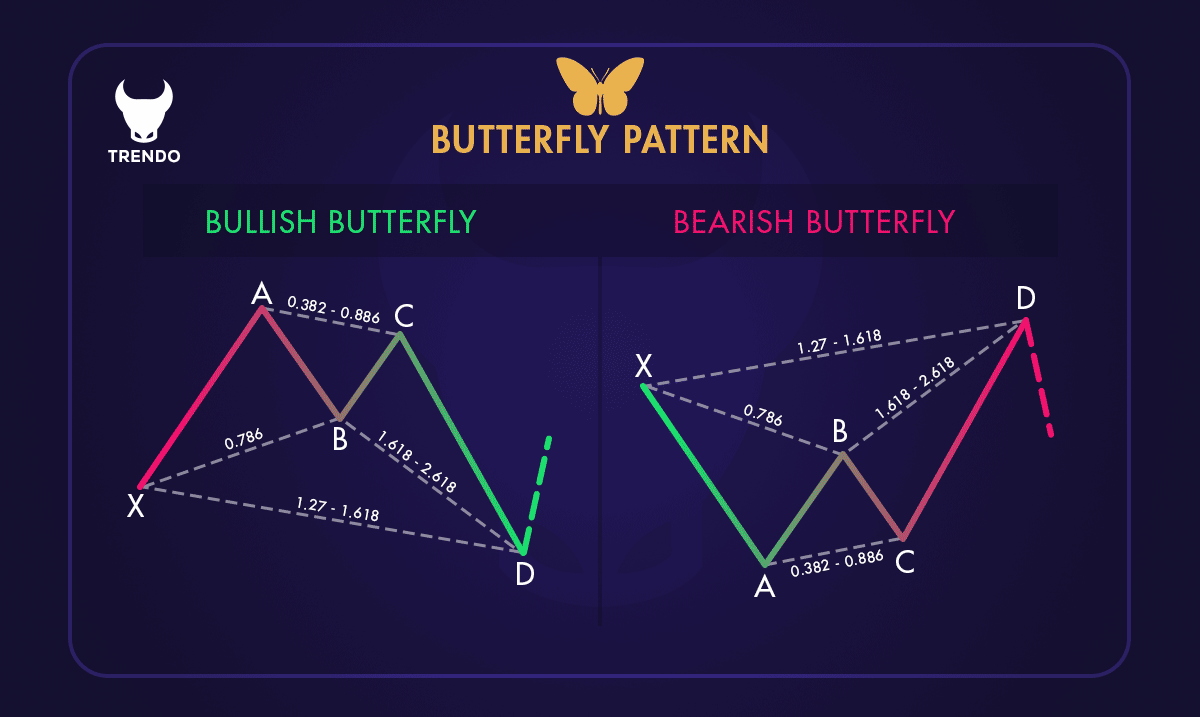
الگوی پروانه (Butterfly)
این الگوی هارمونیک یک الگوی بازگشتی است و از چهار مرحله تشکیل شده است. الگوی پروانه به ما در شناسایی پایان روند فعلی کمک میکند و بهصورت صعودی و نزولی شکل میگیرد.
گامهای الگوی پروانه
XA:
اولین مرحله الگو زمانی شکل میگیرد که قیمت از نقطه X به A کاهش یا افزایش یابد.
AB :
در مرحله AB جهت حرکت قیمت معکوس شده و به سطح 78/6٪ فیبوناچی از مسافت طی شده توسط XA اصلاح مییابد.
BC :
در این مرحله، جهت قیمت تغییر کرده و هم جهت با مرحله XA حرکت میکند. سپس بین 38/2 ٪ تا 88/6 درصد سطوح Fib مسافتی که توسط AB طی شده است، بازمیگردد.
CD :
این مرحله، فاز نهایی الگو است و اگر این مرحله درست اتفاق نیفتد، میتوانیم الگویی که تاکنون تشکیلشده را نامعتبر بدانیم. در مرحله CD قیمت باید به سطح 127% تا 8/161% فیبوناچی اکستنشن مرحله AB برسد. در نقطه D میتوانیم وارد معامله خرید یا فروش شویم.
حتما بخوانید:
الگوی گارتلی (Gartley)
گارتلی یکی از محبوبترین الگوهای هارمونیک در بازار است. معاملهگران تکنیکال از این الگو برای معامله در اصلاح قیمت و همچنین در ادامه روند استفاده میکنند.
گامهای الگوی گارتلی
XA :
اولین مرحله زمانی شکل میگیرد که قیمت بهصورت شارپ از نقطه X به نقطه A میرسد.
AB :
در مرحله AB جهت قیمت تغییر میکند و به سطح 61/8٪ فیبوناچی از گام XA بازمیگردد.
BC :
در فاز BC، قیمت جهت خود را تغییر داده و از 38/2٪ تا 88/6٪ مسافتی که توسط گام AB طی شده را اصلاح میکند.
CD :
این آخرین مرحله الگو است و دوباره به سمت اصلی روند برمیگردد و باید به سطح 78/6 درصدی مرحله XA برسد. در شکل زیر نحوه تشکیل کامل الگوهای گارتلی صعودی و نزولی نمایشدادهشده است.
حتما بخوانید:
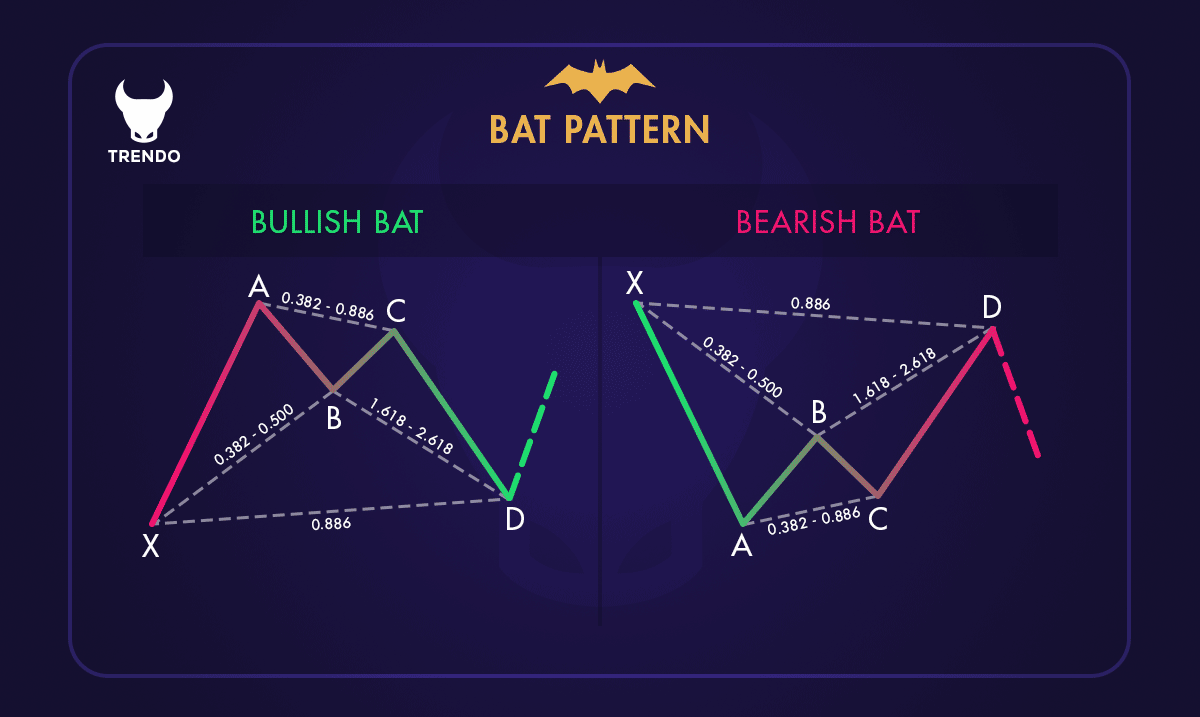
الگوی خفاش (Bat)
خفاش یک الگوی هارمونیک است که در هر دو روند صعودی و نزولی ظاهر میشود. این الگو زمانی شکل میگیرد که قیمت به طور موقت در جهت معکوس روند اصلی حرکت میکند. بهمحض پایانیافتن این الگو، بازارها مسیر اصلی خود را از سر میگیرند و به ما فرصتی میدهند تا وارد معامله شویم.
گامهای الگوی خفاش
XA :
اولین مرحله زمانی شکل میگیرد که قیمت بهصورت شارپ از نقطه X به نقطه A افزایش یا کاهش مییابد.
AB :
گام AB بین سطوح فیبوناچی 38/2% تا 50% مسافتی که توسط مرحله XA طی شده است، بازمیگردد.
BC :
در فاز BC، قیمت دوباره جهت خود را تغییر میدهد و به نواحی 38/2٪ تا 88/6٪ از مسافت طی شده توسط گام AB اصلاح مییابد.
CD :
مرحله CD آخرین و مهمترین قسمت الگو است. اگر این گام طبق قوانین پیش نرود، میتوان الگو را نامعتبر در نظر گرفت. زمانی که مرحله CD تا 88/6 درصد فاز XA اصلاح یابد، میتوانیم وارد معامله شویم. در شکل زیر الگوی خفاش نزولی و صعودی با اعمال سطوح Fib نمایشدادهشده است.
حتما بخوانید:
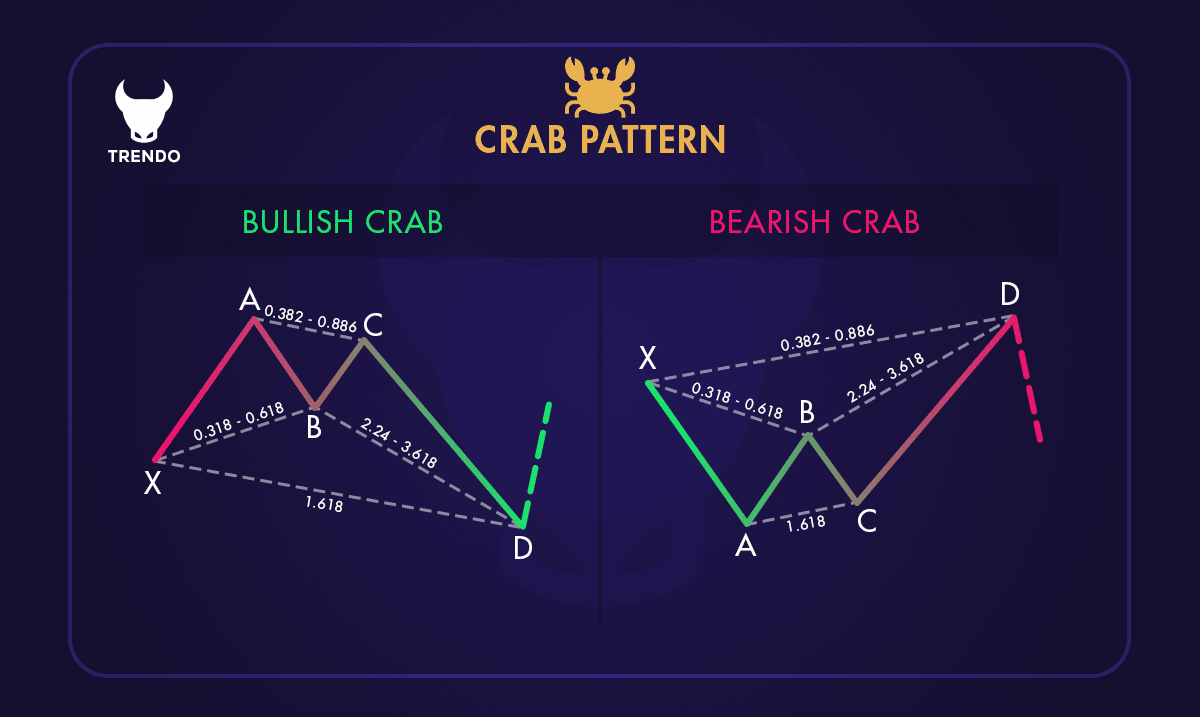
الگوی خرچنگ (Crab)
درست مانند الگوهای دیگر، خرچنگ نیز با استفاده از سطوح فیبوناچی برای تعیین نقاط عطف دقیق شناسایی و معامله میشود. خرچنگ یک الگوی بازگشتی است و از چهار گام XA، AB، BC و CD تشکیل شده است. بیایید آنها را با جزئیات بررسی کنیم.
گامهای الگوی خرچنگ
XA :
اولین مرحله زمانی شکل میگیرد که قیمت بهصورت شارپ از نقطه X به نقطه A حرکت میکند.
AB :
حرکت AB برخلاف جهت اصلی بازار است و بین 38/2٪ تا 61/8٪ از مسافت طی شده توسط گام XA را اصلاح میکند.
BC :
در مرحله BC، قیمت جهت اصلی خود را از سر میگیرد و بین 38/2٪ تا 88/6٪ از مسافتی که توسط فاز AB طی شده را بازمیگردد.
CD :
این مرحله گام نهایی است که شکلگیری الگوی خرچنگ را تأیید میکند. ورود به معامله را زمانی انجام میدهیم که قیمت در این مرحله به 161/8% فیبوناچی اکستنشن گام AB برسد.
حتما بخوانید:
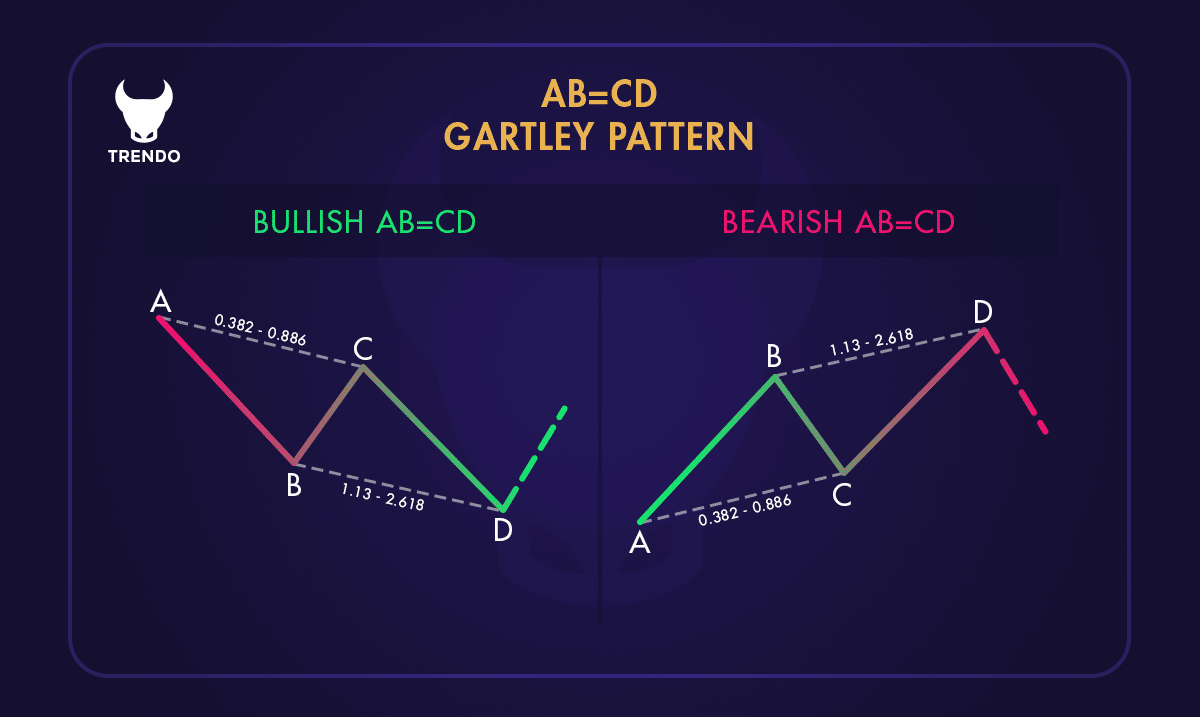
الگوی AB=CD
ABCD یکی از سادهترین الگوهای هارمونیک است و بین معاملهگران طلا از محبوبیت زیادی برخوردار است. همانند
الگوهای هارمونیک دیگر الگوی ABCD نیز بهصورت صعودی و نزولی وجود دارد. برای هر دو نسخه نزولی و صعودی، خطوط AB
و CD گامهای اصلی این الگو هستند، درحالیکه خط BC بهعنوان Retracement یا اصلاح در نظر گرفته میشود.
حتما بخوانید:
ویژگی بهترین بروکر برای ترید طلا
گامهای الگوی AB=CD
AB :
اولین مرحله الگو زمانی شکل میگیرد که قیمت از نقطه A به B کاهش یا افزایش یابد.
BC :
حرکت قیمت در این مرحله خلاف روند بازار است و بهاندازه 61/8 درصد گام AB اصلاح مییابد.
CD :
در این مرحله قیمت هم جهت با روند بازار و بهاندازه 127/2 درصد فیبوناچی اکستنشن AB حرکت میکند.
این قانون برای هر دو الگوی AB=CD نزولی و صعودی اعمال میشود و زمانی که قیمت به نقطه D میرسد، وارد معامله
میشویم.
حتما بخوانید:
سخن پایانی
صبور بودن تنها چیزی است که هنگام معامله یا شناسایی الگوهای هارمونیک از اهمیت زیادی برخوردار است. همانطور که میدانید، زمان زیادی طول میکشد تا یک الگوی هارمونیک شکل بگیرد. مثالهای زیادی وجود خواهد داشت که سهگام الگو بهدرستی شکل میگیرند، اما قوانین گام نهایی رعایت نمیشوند و در نتیجه، کل الگو باطل میشود. در نتیجه
ترید در بازارهای مالی یک بازی مهارت و صبر است. هر چه صبورتر باشید، نتایج بهتری خواهید دید.
سوالات متداول
۱. الگوهای هارمونیک در چه حالتی اعتبار بیشتری دارند؟
۲. آیا الگوهای هارمونیک بهتنهایی قابل استفاده هستند؟
۳. مهمترین الگوی هارمونیک کداماند؟
۴. بعد از تکمیل الگوی هارمونیک، چه باید کرد؟
۵. بهترین حالت برای ورود به معامله با الگوی هارمونیک کدام است؟
۶. الگوی XABCD چیست؟
۷. الگوی هارمونیک به چه شکل است و چه ویژگیهایی ظاهری دارد؟