In this article, we aim to guide you through the world of candlestick charting, assisting you in understanding market behavior and price movements. Join us as we embark on this educational journey to enhance your trading skills.
What Are Candlesticks?
In financial markets, various chart types are used to display price movements, such as line charts, Heikin-Ashi, and more. However, one of the most effective ways to represent price behavior is through candlestick charts.
A candlestick represents the price movement of an asset within a specific time period and has four main components:
1. Opening Price: The first price recorded when the time period begins.
2. Closing Price: The last price recorded when the time period ends.
3. Highest Price: The highest price reached during the time period.
4. Lowest Price: The lowest price reached during the time period.
The candlestick body shows the price range between the opening and closing prices, while thin lines, known as wicks or shadows, extend from the body to indicate the high and low prices. In the image below, you can see two candlesticks.
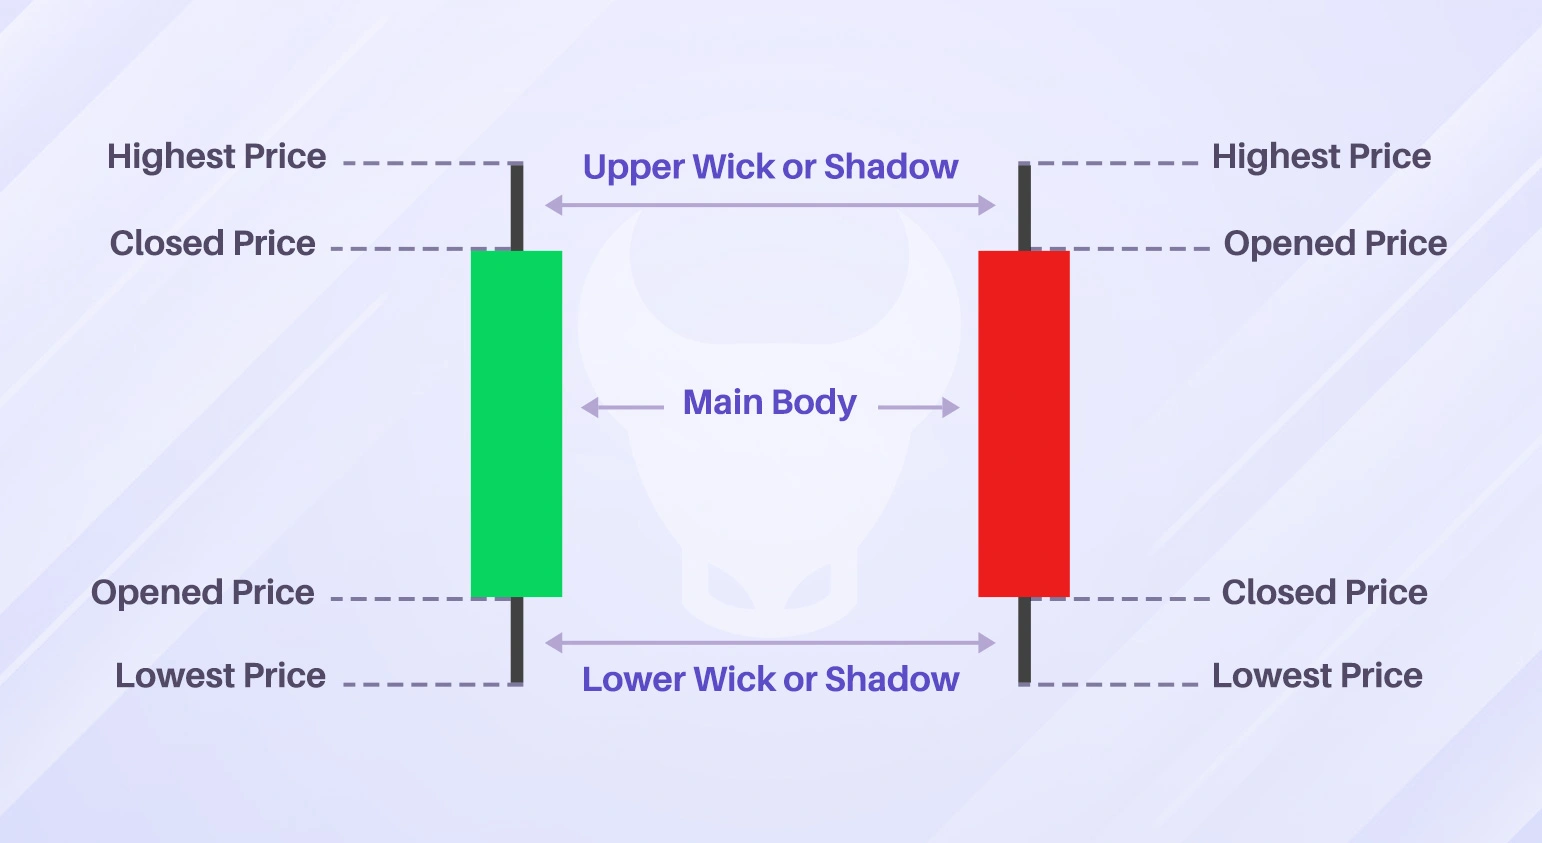
A red candlestick is called a bearish candlestick, indicating that the opening price is higher than the closing price. Conversely, a green candlestick is called a bullish candlestick, showing that the opening price is lower than the closing price.
Traders use candlesticks because they provide a clear and concise way to visualize market sentiment and price action. The patterns formed by candlesticks can help traders identify potential trends, reversals, and trading opportunities, making them a valuable tool in technical analysis.
The History of Candlestick Charts
The history of candlestick charts dates back to the 18th century in Japan. They were developed by a rice trader named Munehisa Homma, who is considered the father of candlestick charting.
Homma used candlestick charts to record and predict rice prices, establishing a method that combined market psychology with price movements. His success in trading rice futures led to widespread adoption of his techniques.
Candlestick charting was introduced to the Western world in the 1980s by Steve Nison, an American technical analyst. Nison’s book, “Japanese Candlestick Charting Techniques,” played a significant role in popularizing these charts outside Japan.
He demonstrated how candlestick patterns could be used to identify potential market reversals and continuations, revolutionizing technical analysis.
Today, candlestick charts are a fundamental tool for traders and analysts worldwide. They provide valuable insights into market sentiment and price action, helping traders make informed decisions.
The simplicity and visual appeal of candlestick charts make them accessible to both novice and experienced traders, solidifying their place in modern financial markets.
The Importance of Candlesticks in Technical Analysis
Candlesticks play a crucial role in technical analysis, providing traders with a visual representation of price movements and market sentiment. Each candlestick on a chart captures the open, high, low, and close prices of an asset for a specific time period, offering a clear snapshot of market activity.
One of the primary reasons candlesticks are essential in technical analysis is their ability to reveal patterns that indicate potential market trends. These patterns, such as bullish and bearish engulfing, doji, and hammer, help traders identify possible trend reversals or continuations.
By recognizing these patterns, traders can make informed decisions about when to enter or exit trades, potentially increasing their chances of success.
Candlesticks also provide insights into market psychology. The length and color of the candlestick body, along with the position of the wicks, can indicate the level of buying or selling pressure.
For example, a long green (or white) candlestick suggests strong buying interest, while a long red (or black) candlestick indicates significant selling pressure. This information is invaluable for understanding the underlying sentiment driving price movements.
Moreover, candlesticks can be used in conjunction with other technical analysis tools, such as moving averages and trend lines, to enhance the accuracy of predictions. By combining candlestick analysis with other indicators, traders can develop a more comprehensive view of the market, leading to better-informed trading strategies.
Read more: Trading strategy with trend line and candlestick patterns with Fibonacci levels confirmation
In summary, candlesticks are indispensable tools in technical analysis. They provide a wealth of information about price action, market trends, and trader sentiment, making them essential for anyone looking to navigate the financial markets successfully.
How to Read Candlestick Charts?
Reading candlestick charts is essential for traders to understand market trends and make informed decisions. Here’s a simple guide to help you interpret these charts effectively.
1. Understand the Structure: Each candlestick represents a specific time period (e.g., one day) and consists of a body and wicks (also called shadows). The body shows the opening and closing prices, while the wicks indicate the highest and lowest prices during that period. A green (or white) candlestick means the closing price is higher than the opening price (bullish), and a red (or black) candlestick means the closing price is lower than the opening price (bearish).
2. Identify Patterns: Candlestick patterns can signal potential market movements.
3. Analyze Trends: Look for patterns over multiple candlesticks to identify trends. An uptrend consists of consecutive bullish candlesticks, while a downtrend consists of consecutive bearish candlesticks. Trends help you understand the overall market direction.
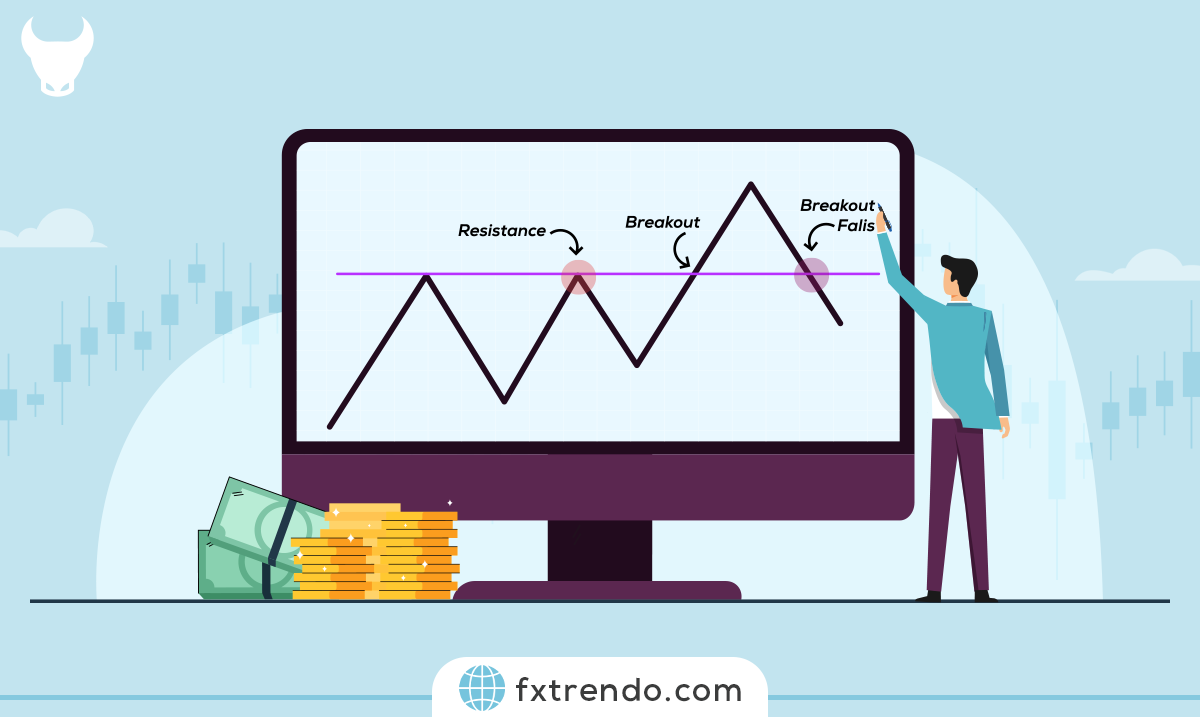
4. Use Support and Resistance Levels: Support levels are price points where an asset tends to stop falling, while resistance levels are price points where an asset tends to stop rising. Candlestick patterns at these levels can provide insights into potential price reversals or continuations.
5. Combine with Other Indicators: To improve accuracy, combine candlestick analysis with other technical indicators such as moving averages, Relative Strength Index (RSI), or volume. This holistic approach helps validate signals and make better trading decisions.
By following these steps, you can effectively read candlestick charts and enhance your trading strategies. Practice and experience will make you more proficient in interpreting these valuable tools.
Top Candlestick Patterns to Know in 2024
Candlestick patterns come in various types that you should be familiar with and understand their meanings. Remember, the names of the candlesticks are not as important as grasping their concepts and applying them in your analyses. Let’s delve into the key candlestick patterns:
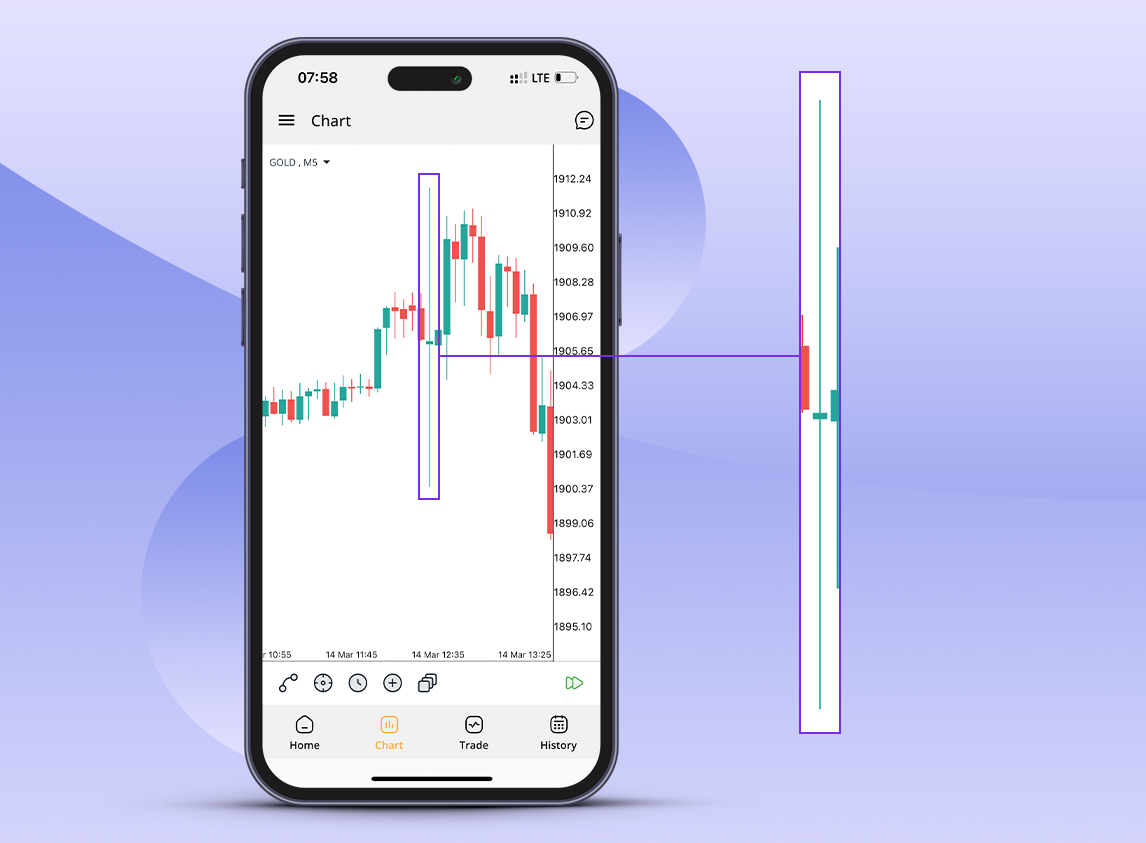
1. Doji Pattern: The Doji candlestick pattern is significant in technical analysis as it indicates indecision or uncertainty in the market. This pattern forms when the opening and closing prices of a candlestick are nearly equal, resulting in a very small body with long upper and lower wicks. Doji patterns often appear at trend reversal points or during trend pauses. For example, a Doji at the end of an uptrend might suggest buyer weakness and a potential downward reversal. However, confirmation from subsequent candlesticks and other technical tools is necessary. You can see an example of this pattern in the image below:
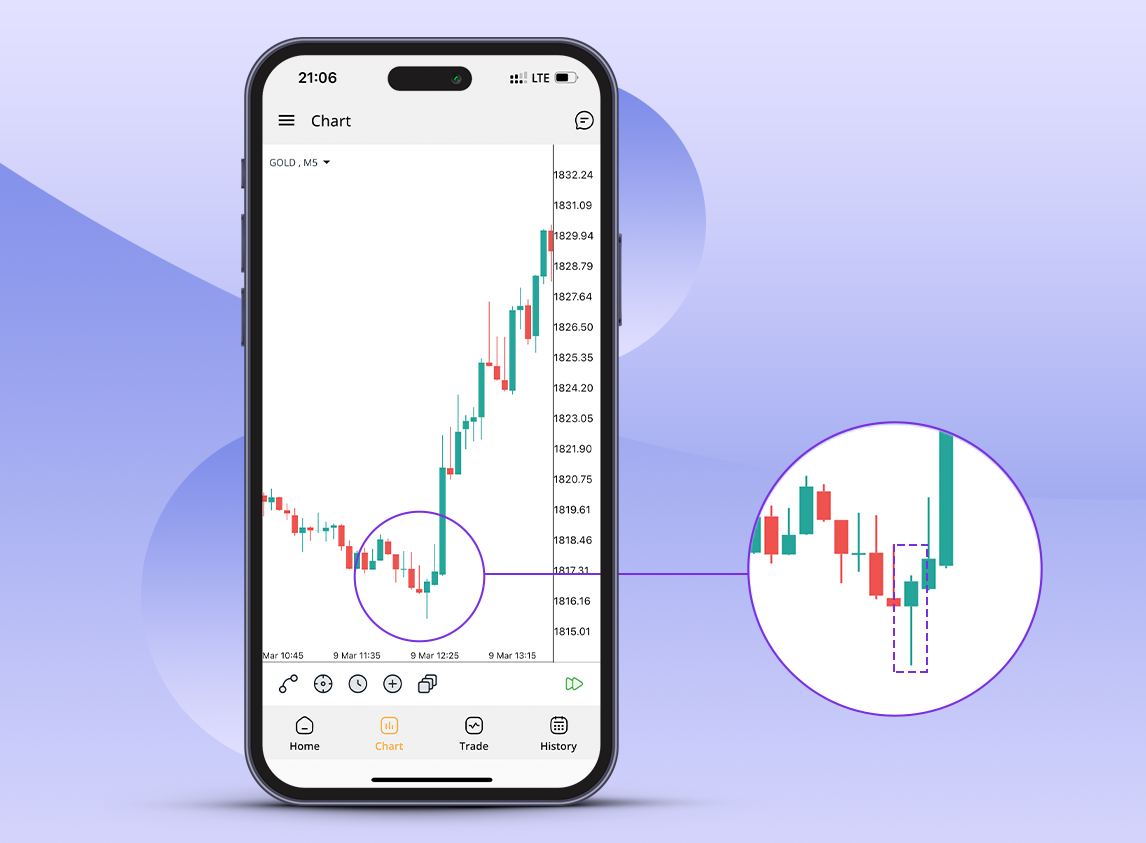
2. Hammer Pattern: The Hammer candlestick pattern is a bullish reversal pattern that typically appears at the end of a downtrend, signaling a possible upward market reversal. This pattern features a small body at the upper end and a long lower wick, with little to no upper wick. The Hammer indicates that despite strong selling pressure during the period, buyers managed to push the price close to the opening level, suggesting a potential entry of buyer strength. You can see an example of this pattern in the image below:
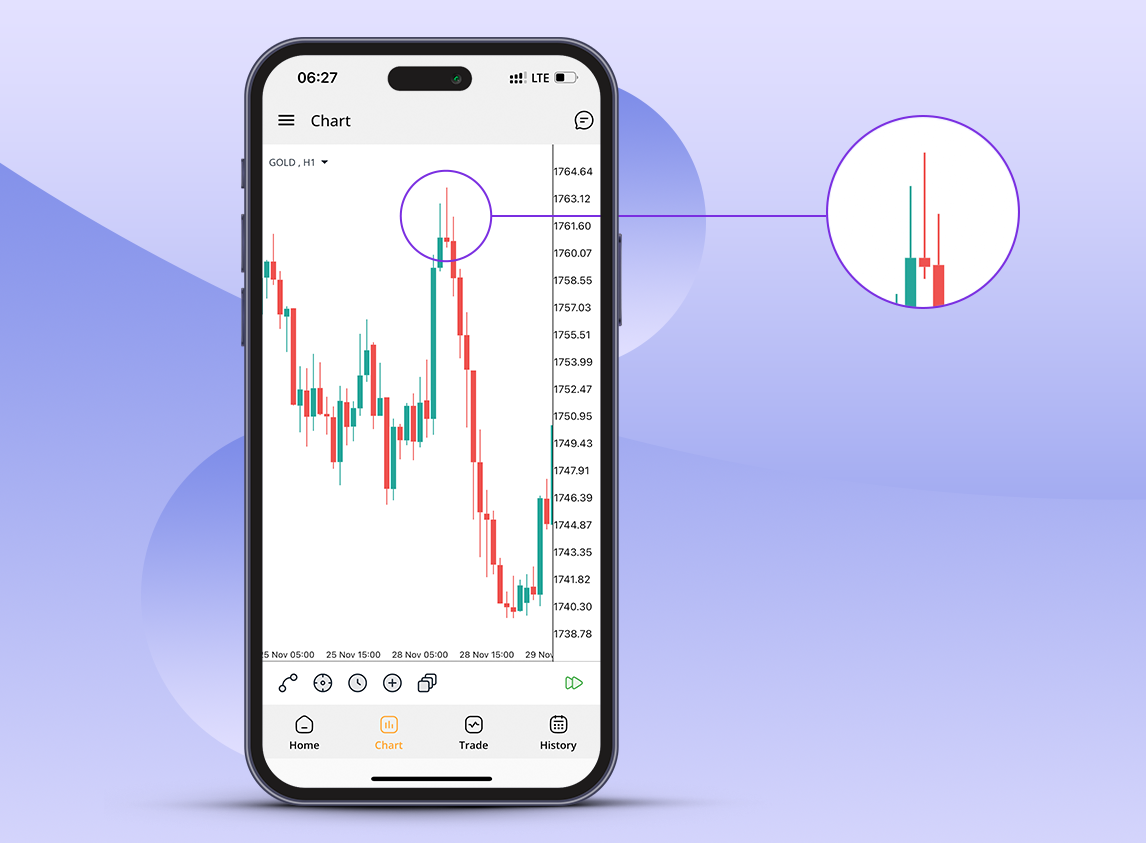
3. Shooting Star Pattern: The Shooting Star is a bearish reversal pattern that usually forms at the top of an uptrend, indicating a possible downward market reversal. It consists of a small body at the lower end and a long upper wick. The Shooting Star shows that buyers tried to raise the price significantly during the period, but sellers took control and pushed the price down near the opening level. You can see an example of this pattern in the image below:
4. Engulfing Pattern: The Engulfing candlestick pattern is a crucial reversal pattern that can appear at the end of an uptrend or downtrend, indicating a potential market direction change. It consists of two consecutive candlesticks, where the first is smaller and in the direction of the current trend, while the second is larger and completely engulfs the body of the first. If this pattern appears at the end of a downtrend with a bullish second candlestick, it’s called a Bullish Engulfing pattern, suggesting the start of an upward trend. Conversely, if it appears at the end of an uptrend with a bearish second candlestick, it’s a Bearish Engulfing pattern, indicating increased selling pressure and a potential downtrend.
5. Morning Star Pattern: The Morning Star is a bullish reversal pattern that typically forms at the end of a downtrend, signaling a possible upward market reversal. This pattern consists of three consecutive candlesticks. The first is a long bearish candlestick, indicating continued selling pressure. The second is a short-bodied candlestick, which can be bullish or bearish, usually forming with a gap from the first candlestick and indicating market indecision. The third is a strong bullish candlestick that closes above the midpoint of the first candlestick, showing the entry of buyers and a potential upward trend.
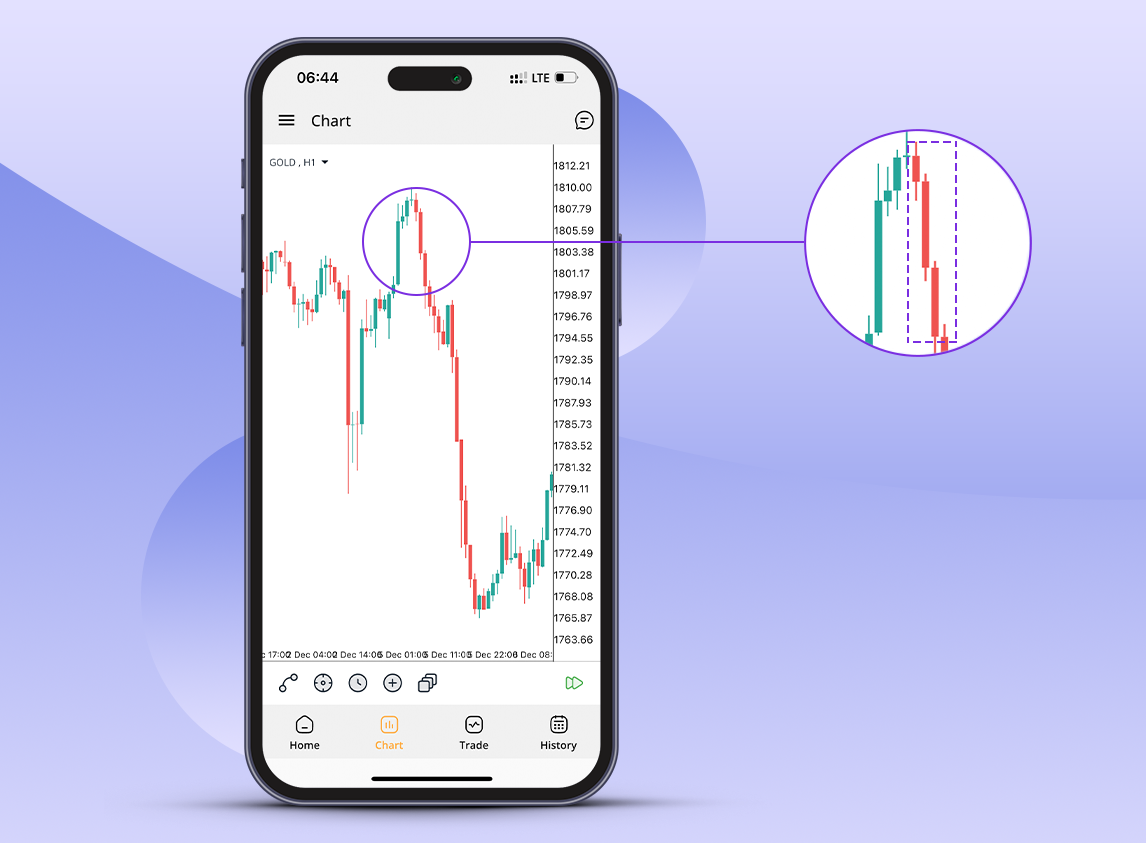
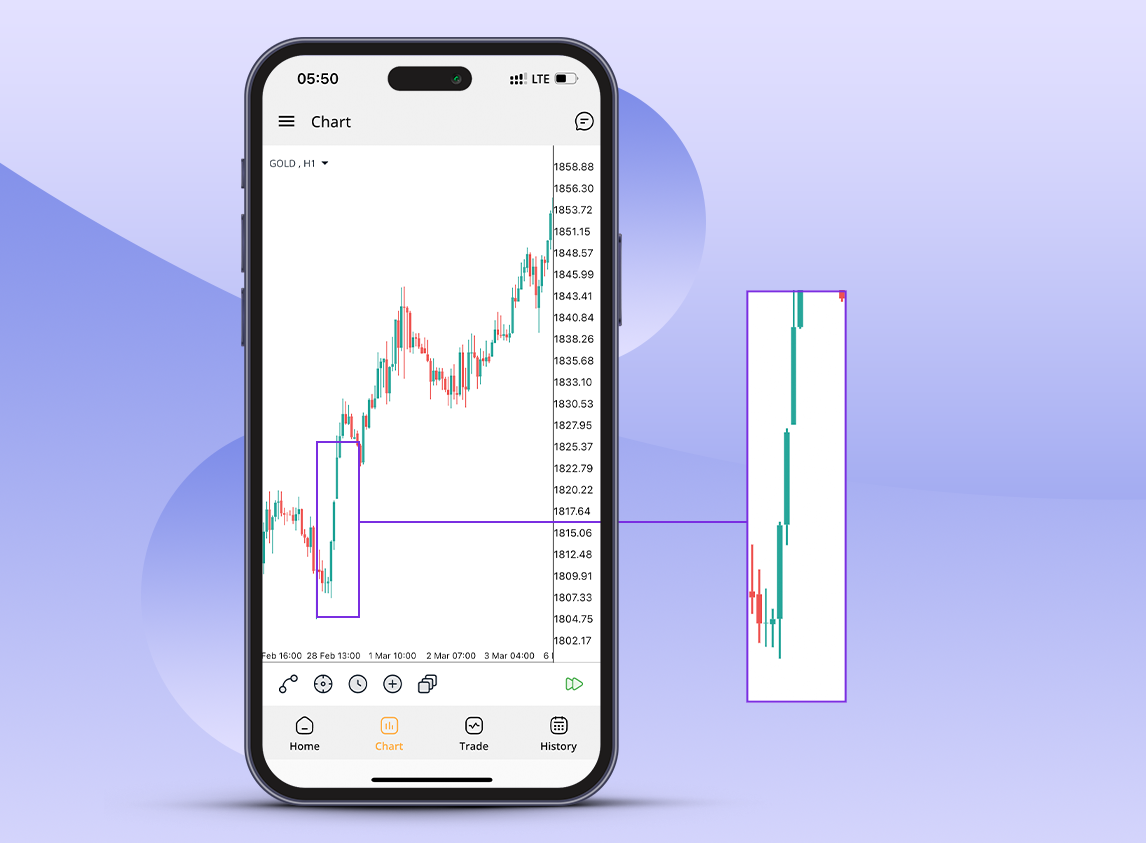
6. Three Black Crows Pattern: The Three Black Crows pattern is recognized as a continuation in a downtrend. It consists of three consecutive long bearish candlesticks, indicating sustained selling pressure. Traders interpret this pattern as a sign of further price decline and look for selling opportunities.
Read more: Support and resistance levels and how to draw them
Conversely, the opposite pattern for an uptrend is called the Three White Soldiers. You can see an example of this pattern in the image below:
Read more: How to trade with a Trendline and set a great strategy
Understanding these patterns and their implications helps you make informed trading decisions and effectively analyze market trends.
How to Use Candlestick Patterns in Trading?
Using candlestick patterns in trading can enhance your ability to predict market movements and make informed decisions. Here’s a step-by-step guide:
1. Learn the Patterns: Familiarize yourself with various candlestick patterns, such as Doji, Hammer, Shooting Star, Engulfing, and Morning Star. Understanding these patterns is crucial for recognizing trading opportunities.
2. Identify Trends: Use candlestick patterns to identify the overall market trend. Look for sequences of bullish or bearish candlesticks to determine if the market is trending upwards, downwards, or moving sideways.
3. Confirm with Other Indicators: Combine candlestick patterns with other technical indicators like moving averages, Relative Strength Index (RSI), and Bollinger Bands. This confirmation helps validate potential trade signals and reduces false positives.
4. Spot Reversals and Continuations: Candlestick patterns can signal trend reversals or continuations. For instance, a Hammer pattern at the end of a downtrend may indicate a bullish reversal, while a Bullish Engulfing pattern during an uptrend suggests a continuation. Use these signals to decide when to enter or exit trades.
5. Set Entry and Exit Points: Use candlestick patterns to establish precise entry and exit points for your trades. For example, you might enter a trade when a bullish pattern forms at a support level or exit when a bearish pattern appears at a resistance level.
6. Manage Risk: Implement risk management strategies such as setting stop-loss orders. Candlestick patterns can help you determine optimal stop-loss levels by indicating potential price reversals.
7. Practice and Review: Continuously practice identifying and interpreting candlestick patterns on historical charts. Reviewing past trades where you used candlestick patterns can help you refine your strategy.
8. Stay Informed: Keep up with market news and events that may impact asset prices. Combining fundamental analysis with candlestick patterns can provide a more comprehensive view of the market.
By integrating these steps into your trading routine, you can use candlestick patterns to gain insights into market behavior, identify trading opportunities, and improve your trading strategy.
Common Mistakes When Using Candlestick Patterns
Using candlestick patterns can be effective in trading, but traders often make common mistakes. Being aware of these mistakes can help you avoid them and improve your trading strategy.
1. Overlooking Context: Analyzing candlestick patterns in isolation without considering the broader market context is a big mistake. Always look at the overall trend, support and resistance levels, and other technical indicators.
2. Ignoring Confirmation: Relying solely on a single candlestick pattern can lead to false signals. Wait for confirmation from subsequent candlesticks or other technical indicators before taking action.
3. Misinterpreting Patterns: Misidentifying or misinterpreting candlestick patterns is common. Ensure you understand the characteristics of each pattern and practice identifying them on historical charts.
4. Overtrading: Seeing patterns in every price movement and overtrading can lead to losses. Be selective and focus on high-probability setups that align with your strategy.
5. Neglecting Risk Management: Failing to implement proper risk management strategies, such as setting stop-loss orders, can result in significant losses. Always use risk management techniques.
6. Disregarding Market Conditions: Candlestick patterns can behave differently in varying market conditions. Adapt your strategy based on current market conditions.
7. Emotional Trading: Letting emotions like fear or greed influence your decisions can lead to impulsive trades and poor outcomes. Stick to your trading plan and make decisions based on analysis.
8. Failing to Backtest: Not backtesting your strategy with historical data can leave you unprepared. Backtesting helps you understand how well your strategy performs under different market conditions.
9. Overemphasis on Patterns: Candlestick patterns are just one tool. Relying too heavily on them while ignoring other factors like economic news and fundamental analysis can limit your success.
By being aware of these common mistakes and taking steps to avoid them, you can use candlestick patterns more effectively and improve your trading performance.
Conclusion
Learning candlestick patterns in Forex trading can help you make better technical analysis decisions and increase your trading profits. By focusing on candlestick patterns and combining them with other technical analysis tools, you can execute better trades in financial markets and enhance your chances of profitability.
It is important to note that candlestick patterns should not be used in isolation, as they can sometimes give false signals. Therefore, always practice risk management and keep your emotions in check.
