In general, in financial markets, including forex, there are components such as price retracement or pullbacks and reversal trends. Identifying and distinguishing between retracement and reversal is an art in itself. In this article, we will explore what these terms mean and how to differentiate between them.
What is Price Retracement or Pullback?
Price retracement or pullback is a term usually associated with a trending market. We know that in a trending market, the price moves in a specific direction. A price retracement or pullback occurs when the price temporarily moves in the primary trend’s opposite direction.
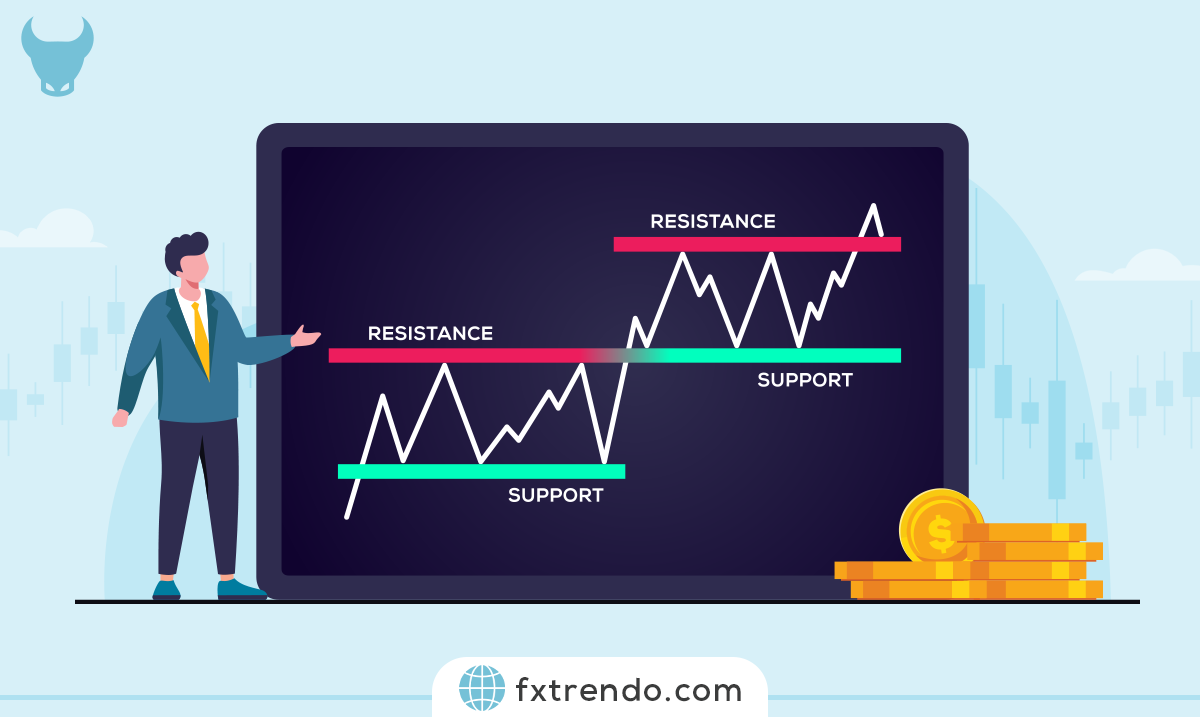
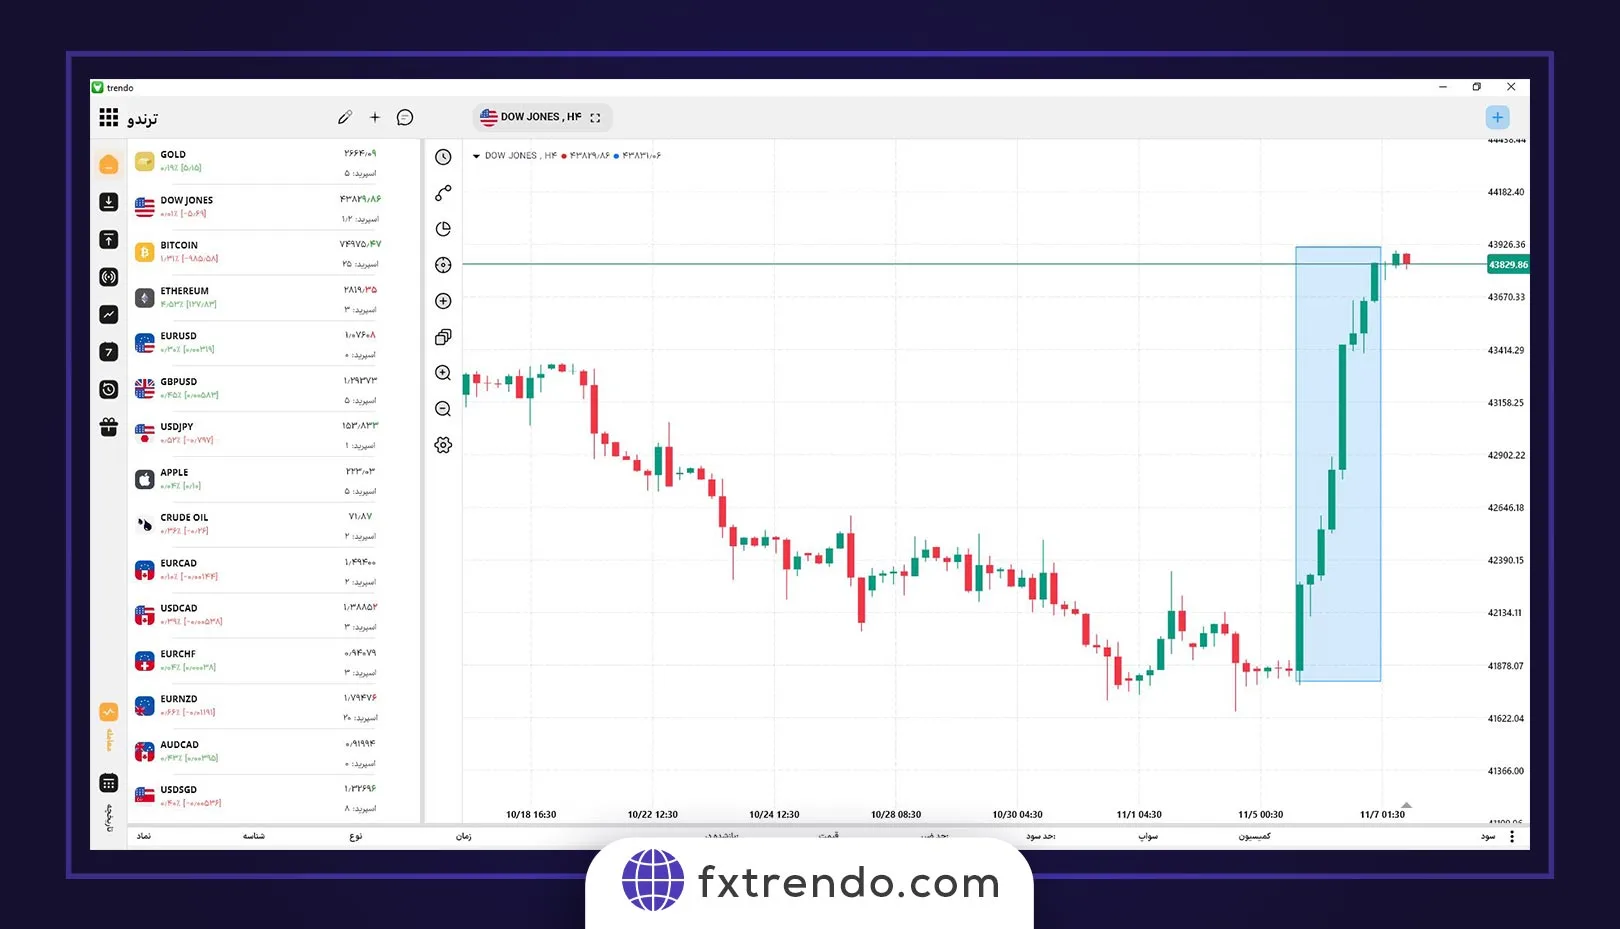
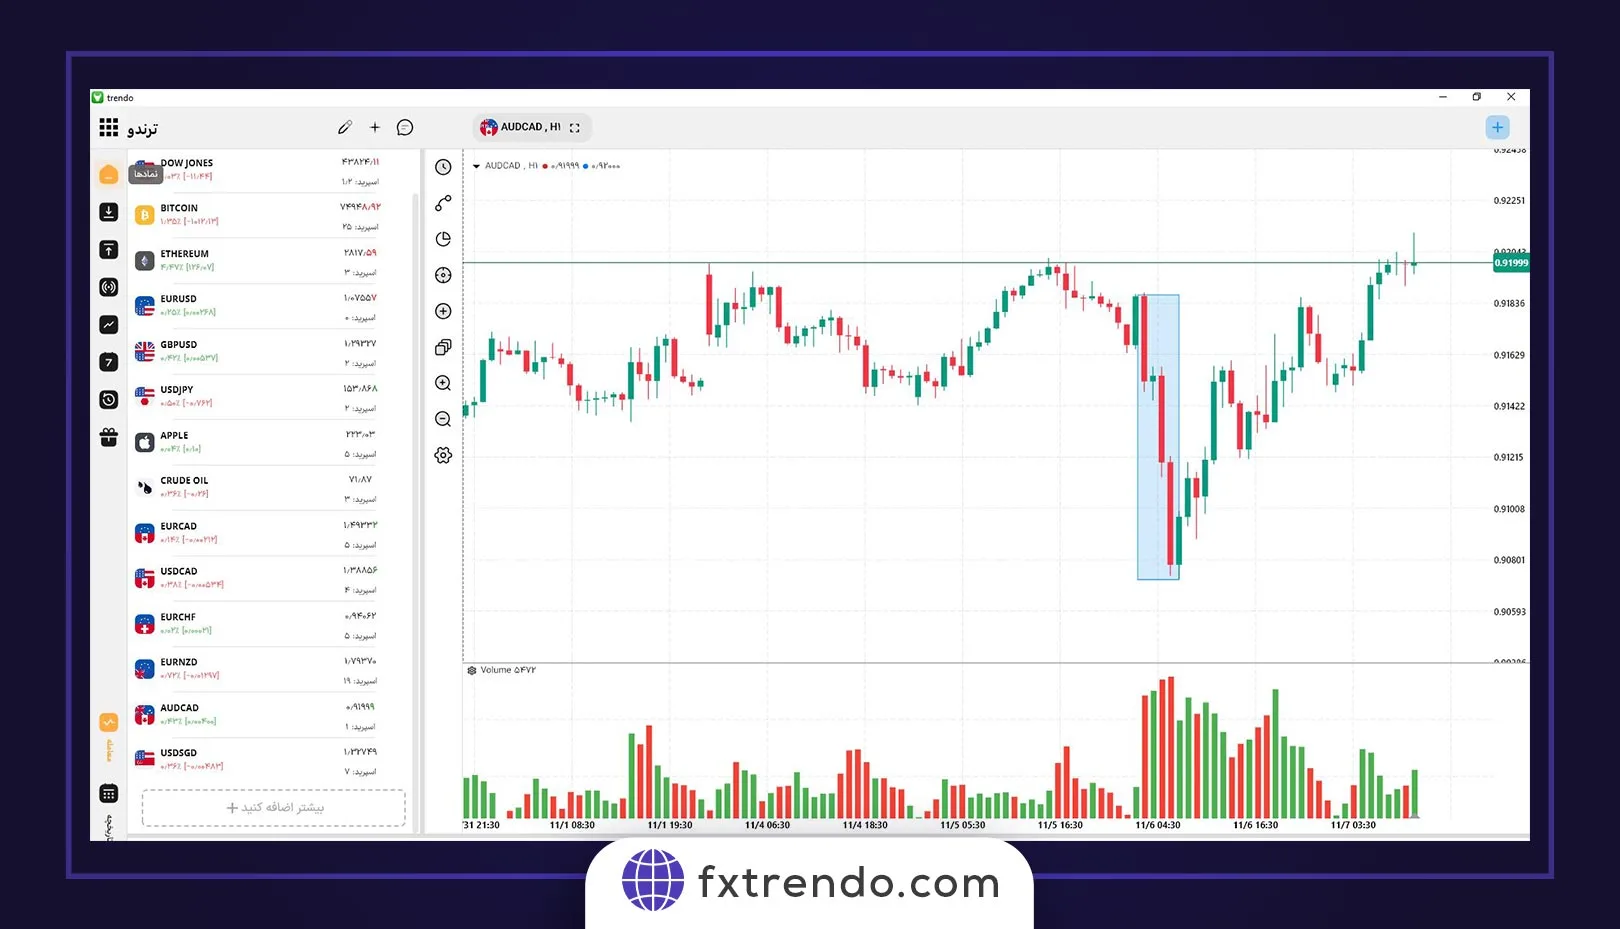
For example, an uptrend is defined as a sequence of higher ceilings and floors. By definition, in an uptrend, prices do not rise continuously, but after climbing to a certain point, the price temporarily moves in the opposite direction. This move against the primary trend is considered a price retracement.
From a technical analysis pov, price movement from a higher ceiling to a higher floor in an uptrend is called price retracement or pullback, and in a downtrend, price retracement is when the price moves from a lower floor to a lower ceiling. Price is measured using technical analysis tools such as Fibonacci, which help traders identify potential support or resistance areas. These areas are based on the Fibonacci sequence, a mathematical formula that predicts support and resistance levels based on previous ceilings and floors in the market.
Price retracement happens in any market and may occur because of different factors such as profit-taking, news events, or changes in market sentiment.
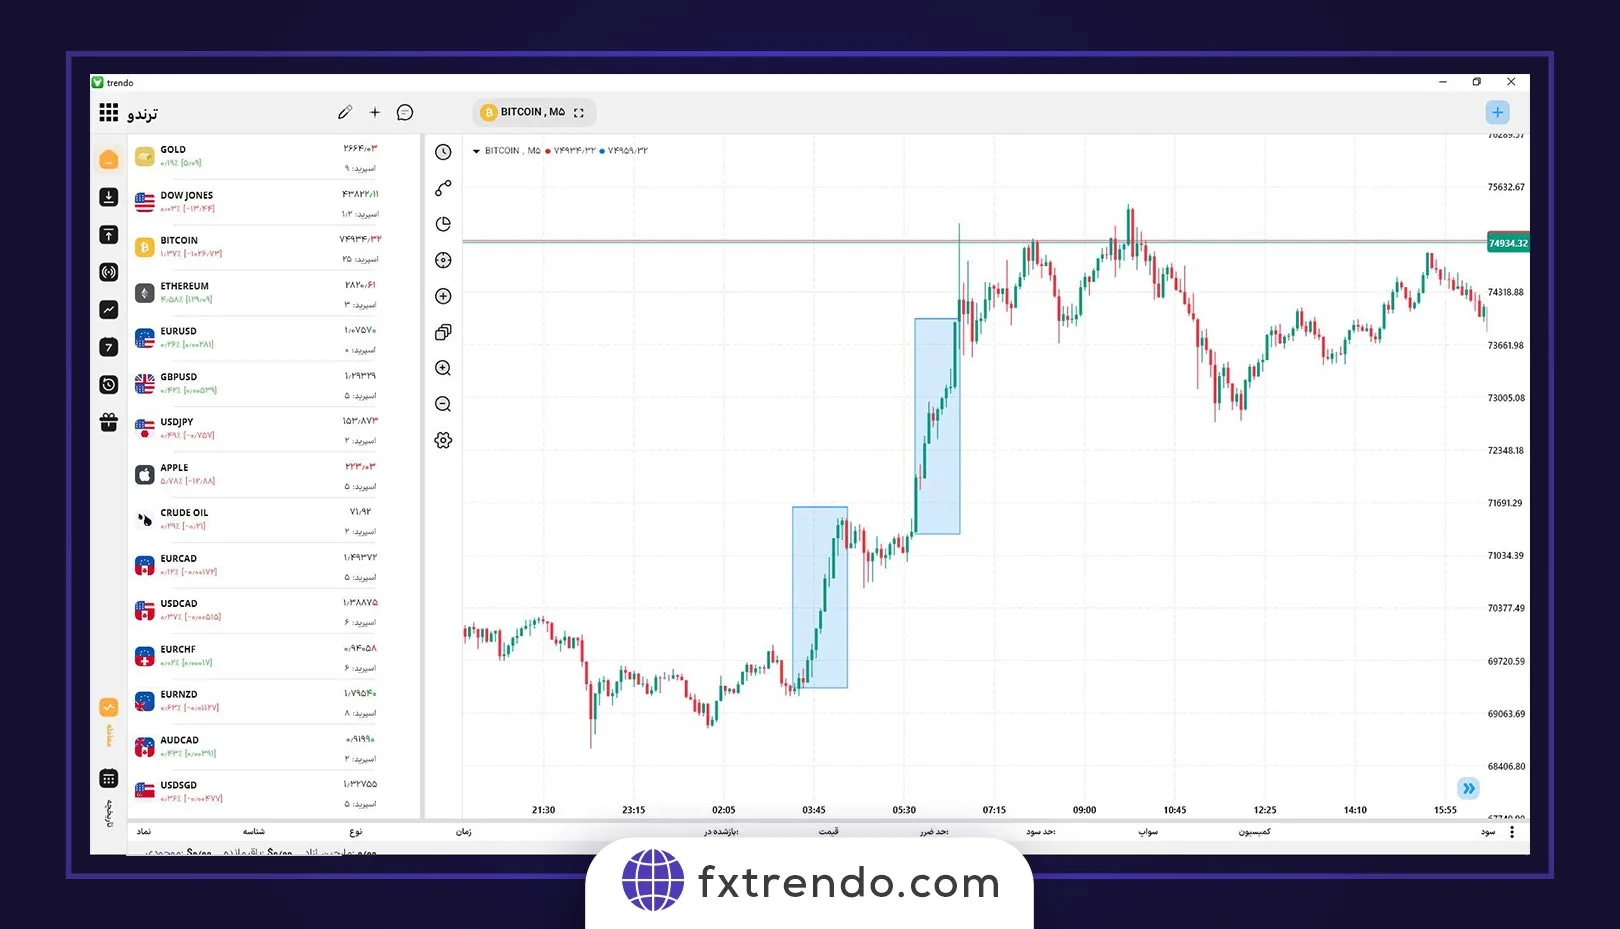
The image below is a price retracement in the uptrend.

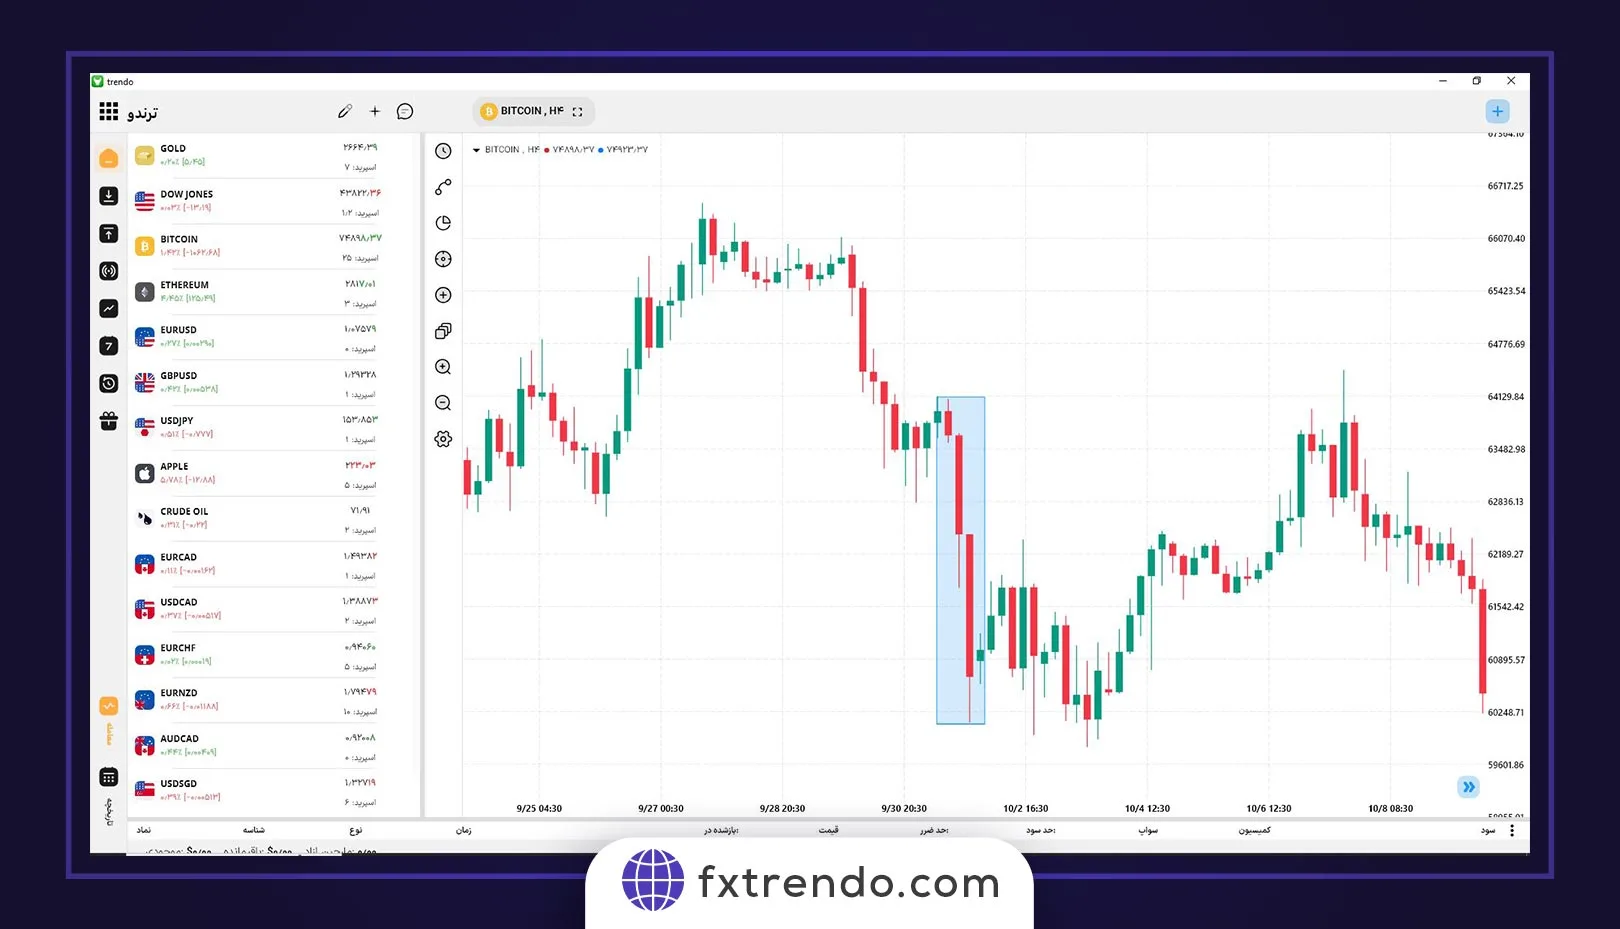
The image below is a price retracement in the downtrend.
Why is price retracement in a trend significant for trading?
Price retracement or pullbacks are significant in a trend because they can provide traders with valuable information about potential entry and exit points. Traders can enter a buy or sell position with a higher probability of success by identifying a retracement level. Trend retracement can also help traders identify support or resistance areas and provide opportunities to gain profits.
How do you identify price retracement or pullback in the trend?
Spotting price retracement in forex trading can be very challenging. However, traders can use various tools and techniques to identify a price retracement or pullback. Below are some ways to identify price retracement and pullbacks in forex trading:
1. Fibonacci Retracement
Fibonacci retracement is a technical analysis tool identifying potential retracement areas in a currency pair. To use Fibonacci retracements, traders draw a line from ceiling to floor or floor to ceiling and then use Fibonacci ratios to identify potential support and resistance levels. The most common Fibonacci ratios are 38.2%, 50% and 61.8%. These levels are often used as possible entry points for trading.
2. Moving Average
Moving averages are another technical analysis tool used to identify retracement in forex trading. Traders use Moving averages to reduce the price fluctuations noise and identify trends. They are calculated by the average price of a currency pair in a certain period. Traders use moving averages to pinpoint potential support and resistance levels. When an asset’s price is above its moving average, it is considered in an uptrend. When the price is below its moving average, it is a downtrend.
3. Trend Lines
Trend lines are lines drawn on price charts to connect two or more points. They identify trend direction and possible retracement areas. When a currency pair’s price moves away from the trend line, it may indicate a potential retracement zone.
4. Price action
Price action is a trading strategy that involves analyzing a currency pair’s price movement without using any technical indicators. Price action traders rely on historical price data and chart patterns to identify potential retracement areas. They look for price patterns such as flags, triangles, and double bottoms or tops to identify potential retracement areas.
Using a combination of several technical tools to find the end of the retracement and the right points to enter the transaction in the trend direction is better. The greater the interference of technical tools, the higher the specified range validity for the end of the retracement. For example, if it is an uptrend, if you draw the trend line and it interferes with the 38.2% Fibonacci retracement and also with the price action area in a range, the possibility that it has a supporting role for the end of the downward retracement and the start of the uptrend, will increase.
You can see how the rising trend line interference and the 100-day moving average supported the price, and the price retracement end was in the trend in the picture below.
How do you trade with price retracement or pullback in the trend?
Now that we know what price retracement is, let’s discuss how to trade using a price retracement or pullback. The following steps will help you trade effectively using price retracement:
Step 1: Identify the trend
The first step to trading in market retracement is to identify the general trend in the market. You can use technical analysis tools such as moving averages, trend lines, or price action to identify the trend. Once you do that, you can look for a potential retracement to enter the market.
Read more:
What is a Trending & Ranging Market?
Step 2: Identify price retracement levels
The next step we discussed is identifying potential retracement levels using technical analysis tools such as Fibonacci retracements and support and resistance levels. These levels will help you define where the market may retrace before continuing in the overall trend’s direction.
Step 3: Wait for the price retracement
Once you have identified potential retracement levels, you must wait for the market to return to these levels. Being patient and waiting for a retracement before entering the market is essential. Entering the market too early can result in a failed trade.
Step 4: Confirm the retracement
After confirming the price retracement, you can enter the market in the general trend direction. You can use various types of trade entry , such as conditional or market orders. For effective risk management, stop-loss and take-profit orders are necessary.
Step 5: Manage your transaction
After entering the market, effective management is essential. You can use technical analysis tools such as support and resistance levels in managing your trade. It is crucial to closely monitor the market, adjust the stop-loss , and take profit orders if necessary.
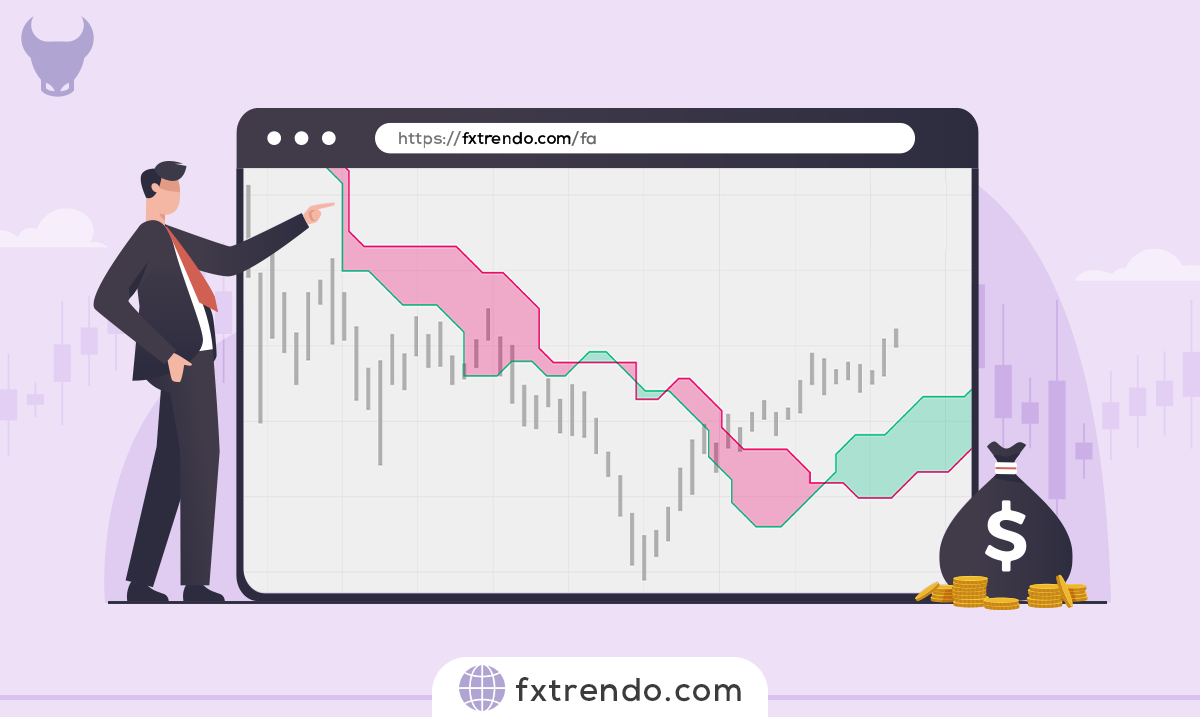
What is a Reversal Trend in forex?
We can define a reversal trend or price reversal as a general change in the market direction. A market can reverse from an uptrend to a downtrend or from a downtrend to an uptrend.
Reversal Trend from downward to upward
In this type of reversal, the market is in a downtrend initially, which creates lower ceilings and floors. Later, the market enters a transition mode where the price is usually in a ranging trend for a while. In other words, the price cannot make lower ceilings and floors. Instead, it creates equal floors or higher floors. Finally, the market moves higher by making higher ceilings and floors.
Reversal Trend from upward to downward
This reversal occurs when the market changes from an uptrend to a downtrend. In an uptrend, the price creates higher ceilings and floors. But, the higher ceilings convert to equal ceilings and floors when the trend weakens. Finally, when selling pressure enters the market, the price begins to move lower, creating lower floors and ceilings, and forming a downtrend.
How do you identify a Reversal Trend?
Identifying price reversals or a potential reversal trend is the key to executing profitable reversal trades. There are several methods that traders use to identify possible reversals, including:
1. Technical analysis:
Technical analysis includes reading charts and using technical indicators to identify trends and potential reversals. Traders use indicators, such as moving averages, MACD, RSI, and Bollinger Bands to identify possible reversals.
2. Candlestick Patterns:
Candlestick patterns are a popular tool traders use to identify potential reversals. Patterns like doji, hammer, and engulfing patterns can signal a possible reversal.
3. Market Sentiment:
Market sentiment, aka sentimental analysis , refers to the traders’ general feeling or mood towards a particular currency pair. It may signal a possible reversal when traders are bearish on a currency pair.
4. Economic news:
Economic news such as interest rate announcements, GDP reports, and employment data can significantly impact currency pairs. It can cause a possible reversal if the news is unexpected.
Read more:
The economic calendar in Forex (how to use the economic calendar)
Summary
Predicting a possible reversal or retracement in the market is very challenging. If you’re stuck on a position and aren’t sure if it’s a retracement or a reversal, you can try the following options to manage the trade:
- Maintain your positions by keeping the stop-loss order as it is. If the price movement is a retracement, you can stay in the trade, and if it is a reversal, exit the transaction when hitting the stop loss. That is the most straightforward approach.
- You can close your positions when you know the reversal trend probability is higher than the retracement. Based on market performance, you can look for re-entry. But, you may have to accept a weaker risk-to-reward.
- You can close the entire position and look for other opportunities. That is the safest possible option, especially for conservative traders.