What is ATR?
The ATR (Average True Range) indicator is a technical analysis tool developed by J. Wells Wilder Jr. This indicator was introduced in the book “New Concepts in Technical Trading Systems” in 1978. ATR indicator is designed to measure the volatility of a currency pair by calculating the average range between high and low prices over a specified period. Read the following sections to learn how to read atr indicator and use it practically in your trading.How is ATR calculated?
To calculate ATR, you must consider the True Range of a currency pair. The actual range is the highest numerical value between the following options:- The difference between the current candle’s high and low price
- The difference between the current candle’s high price and the previous candle’s closing price
- The difference between the current candle’s low price and the previous candle’s closing price
Why is ATR important?
ATR provides traders with valuable insights into the volatility of a currency pair. Traders can adjust their trading strategies accordingly by understanding the level of volatility. ATR can help to determine the appropriate place for Stop-Loss orders and Take-Profit areas. Also, this tool can help identify trading opportunities and assess the risk associated with a particular currency pair. Read More: Major currency pairs and symbols of the forex market.How to use atr indicator?
Traders can use the ATR indicator in their trading strategy in different ways. These methods include:- Stop loss and Take profit areas based on volatility
- Identify trade opportunities
- Risk Assessment
- Trend confirmation
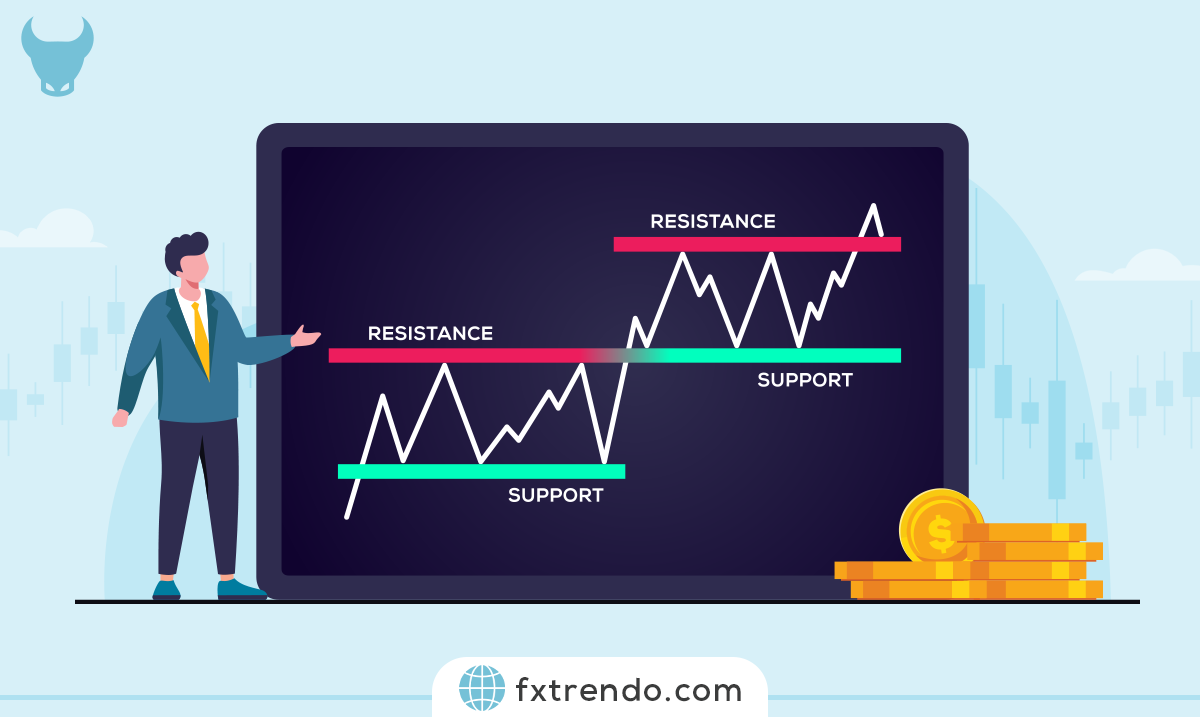
In position 1, the candles have attacked the support area, but the ATR indicator is at the ceiling, indicating that the market tends to reduce its volatility. As a result, the support level does not break. But in position 2, when the candles reach the support level, the ATR indicator is also at its floor, indicating that the market has enough strength for a volatile period, as a result, the support level breaks easily.
Read More:
What is a Trending & Ranging Market?
ATR Trading Strategies
The Average True Range (ATR) becomes truly powerful when you turn it into actionable trading rules. Below are four common strategies based on the ATR indicator for traders. Each strategy includes entry rules, stop-loss, take-profit, and risk management. Always use the standard ATR(14) setting unless stated otherwise. Test everything on a demo account first and never risk more than 1% of your account on a single trade.ATR Breakout Strategy
This strategy catches explosive moves after low-volatility consolidation — perfect for news events or end-of-range breakouts. Step-by-step rules:- Look for consolidation where ATR(14) has been flat or falling for at least 20–30 candles (low volatility phase).
- Wait for a strong breakout candle that closes clearly above resistance (long) or below support (short).
- Confirm the breakout with rising ATR — the current ATR value should be at least 15–20% higher than the average of the previous 10 periods.
- Enter on the close of the breakout candle or the open of the next candle.
ATR Channel Strategy (Keltner Channel Breakout)
Build dynamic channels using ATR to trade volatility expansions. How to set it up:- Middle line: 20-period EMA
- Upper band: EMA + 2 × ATR(14)
- Lower band: EMA – 2 × ATR(14)
- Price walks along the lower band during a downtrend or the upper band during an uptrend (channel riding).
- Enter in the direction of the trend when the price closes outside the opposite band (breakout), and the ATR is expanding.
- Only trade when the channel is clearly sloping in one direction.
ATR Trend Confirmation
Use ATR to filter fakeouts and ride strong trends with confidence. Rules:- Identify the primary trend with 50/200 EMA or higher highs/lower lows.
- Only take trades in the trend direction when ATR(14) is rising (volatility expanding).
- Ignore counter-trend signals if ATR is falling (trend exhaustion warning).
- Enter on pullbacks to support/resistance or moving averages.
Real example – EUR/USD H1 chart:
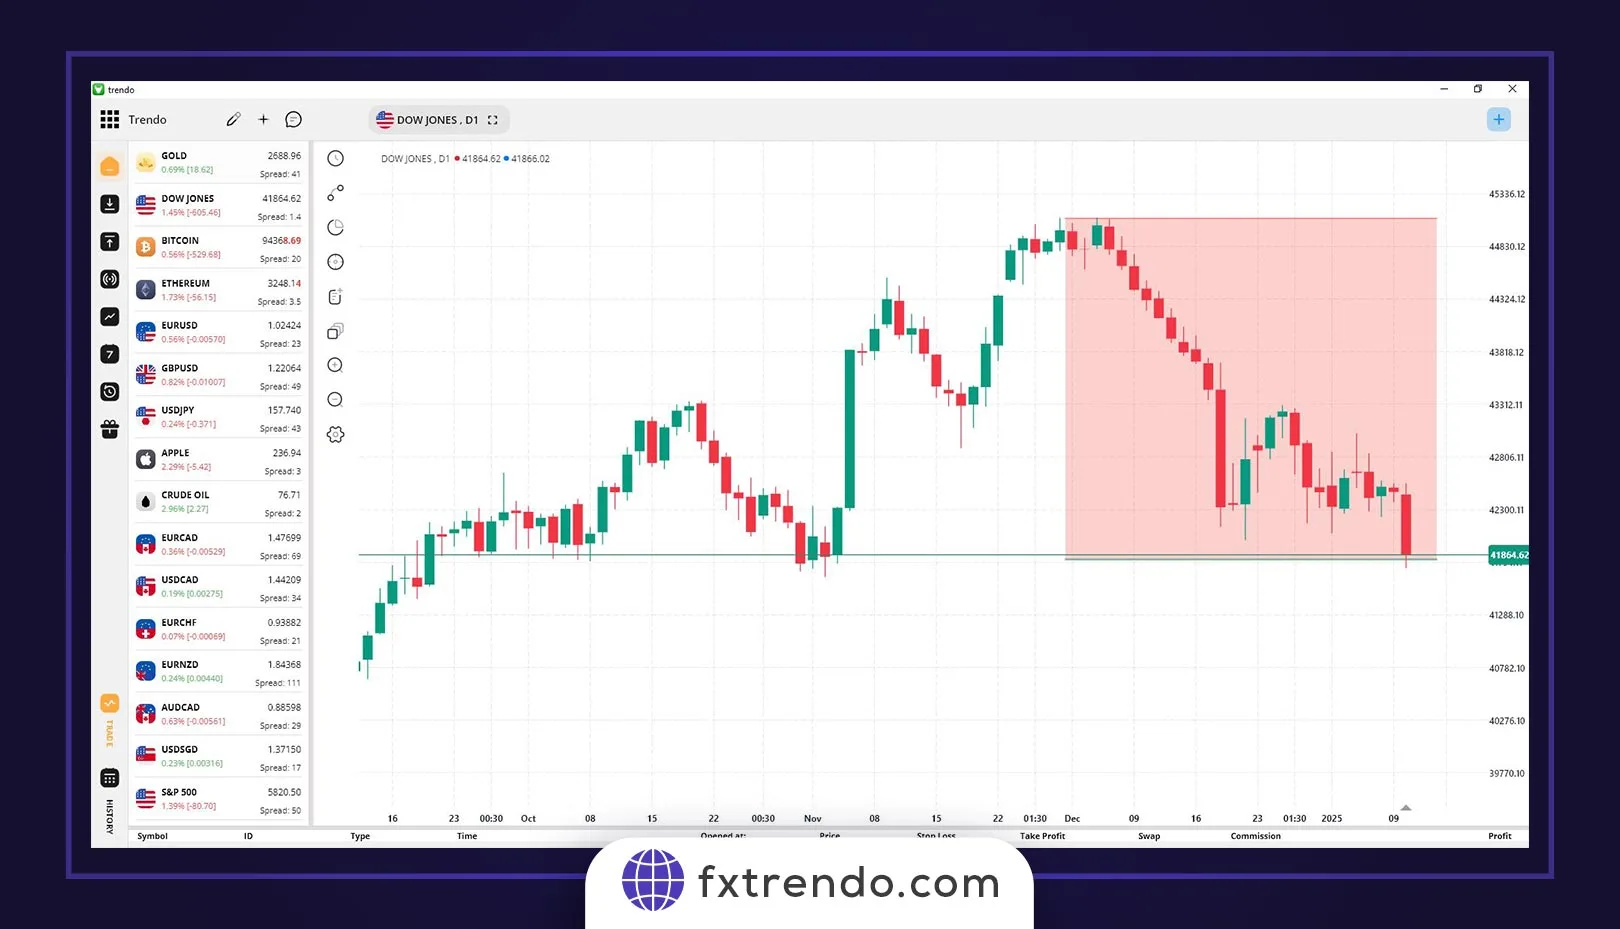
The EUR/USD chart on the Trendo trading platform is presented below. The overall trend has been examined from higher time frames, which has been bearish. In the 1-hour chart, we have a resistance area that the price has reacted to several times. At the end of the range, a strong bearish candle has closed, and the increase in ATR simultaneously confirms strong downward momentum. We can enter a sell position at the close of this candle or after receiving confirmation in the next bearish candle in the direction of the trend. Set the sl at 1.5 × ATR and the tp target at 3 × ATR.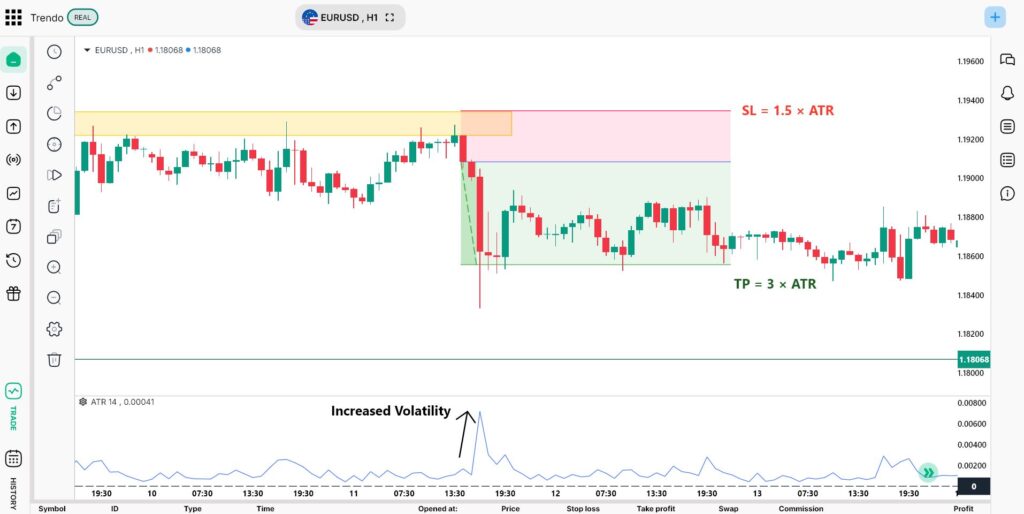
Scalping with ATR
Perfect for 5-minute and 15-minute charts during London/New York overlap. Setup:- Timeframe: M5 or M15
- ATR(14) on the chart
- Optional filter: 50 EMA
- Trade only when ATR(14) > average daily ATR (higher volatility = better scalping conditions).
- Enter long when price breaks above recent swing high + current ATR value is rising.
- Enter short when price breaks below recent swing low.
- Use very tight entries (1–2 candles confirmation).
Limitations of ATR and Common Mistakes
While the ATR indicator forex is one of the most useful volatility tools available, it has important limitations that every trader should understand. Knowing these weaknesses helps you avoid costly mistakes when applying the average true range forex in your trading. First, ATR indicator alone does not indicate the trend. The Average True Range only measures volatility — how much the market is moving — not the direction of that movement. A rising ATR during both strong uptrends and sharp downtrends looks identical. Always combine the atr forex indicator with trend tools such as moving averages, price action, or ADX to determine direction before taking signals. Second, forex atr has limited application in slow, ranging markets. During low-volatility periods (e.g., Asian session or holidays), ATR values become very small and give unreliable signals. Breakout and channel strategies often fail in these conditions as the market lacks the momentum to follow through. Many traders lose money trying to force trades when the atr indicator is flat and below its 20-period average. Third, ATR indicator does not correlate with volume. Unlike stocks, forex is decentralized, so the average true range forex cannot factor in real buying or selling pressure from volume data. This makes it less effective during news-driven spikes where price moves violently but without sustainable follow-through.Common Mistakes Traders Make:
- Using ATR signals in isolation without trend confirmation
- Setting stop-losses too tight during high-volatility news events
- Ignoring market context and trading when the ATR indicator is contracting
- Applying the same ATR multiplier across all currency pairs and timeframes
ATR vs Other Volatility Indicators
Traders often compare the ATR indicator forex with other popular volatility tools to understand which performs best in different market conditions. While each indicator measures volatility differently, they all serve unique purposes. The ATR indicator stands out for its simplicity and practicality, but knowing how it stacks up against alternatives helps create more robust trading systems.ATR vs Bollinger Bands
Bollinger Bands use standard deviation to plot bands around a moving average, clearly showing periods of low and high volatility. They are popular for spotting breakouts after quiet ranges. The average true range forex, however, delivers a simple pip-based reading of actual price movement. Traders favor ATR indicator for setting precise stop-loss and take-profit levels. A common and effective method is to use both indicators together.ATR vs Standard Deviation
Standard Deviation calculates how far prices move from their average. It provides good statistical insight, but it can feel less intuitive for quick trading decisions. ATR indicator measures the true range of each candle and responds better to real market gaps and overnight moves. Most forex traders find the atr forex indicator more straightforward for everyday risk management and position sizing.ATR vs Volatility Index (VIX)
The VIX reflects market expectations of future volatility based on S&P 500 options and serves as a broad sentiment indicator. ATR indicator shows the actual volatility of a specific currency pair. Smart traders use the VIX to gauge overall market mood while depending on the atr indicator forex for accurate trade planning and execution on pairs like EUR/USD.An example of trading in the forex market with ATR
Let’s take an example to understand how we can use ATR in Forex trading. Suppose a trader wants to trade the EUR/USD currency pair. The trader decides to use the ATR indicator with a 14-day period. As seen in the image below, the ATR value for the EUR/USD currency pair is 16 pips. The trader decides to place a stop loss order twice the ATR value, which will be 32 pips. The trader also decides to set a take profit order twice the ATR value, which will be 32 pips. When a trader enters a buy trade, he places a stop loss order at 32 pips below the entry price and a take profit order at 32 pips above the entry price. The trader monitors the trade, and when the price reaches the profit target, he closes the transaction and makes a profit of 32 pips. Read More: What is a pip in Forex? (calculation of changes in currency pairs, currency pairs’ profit and loss with pip)