


Definition of Bollinger band indicator
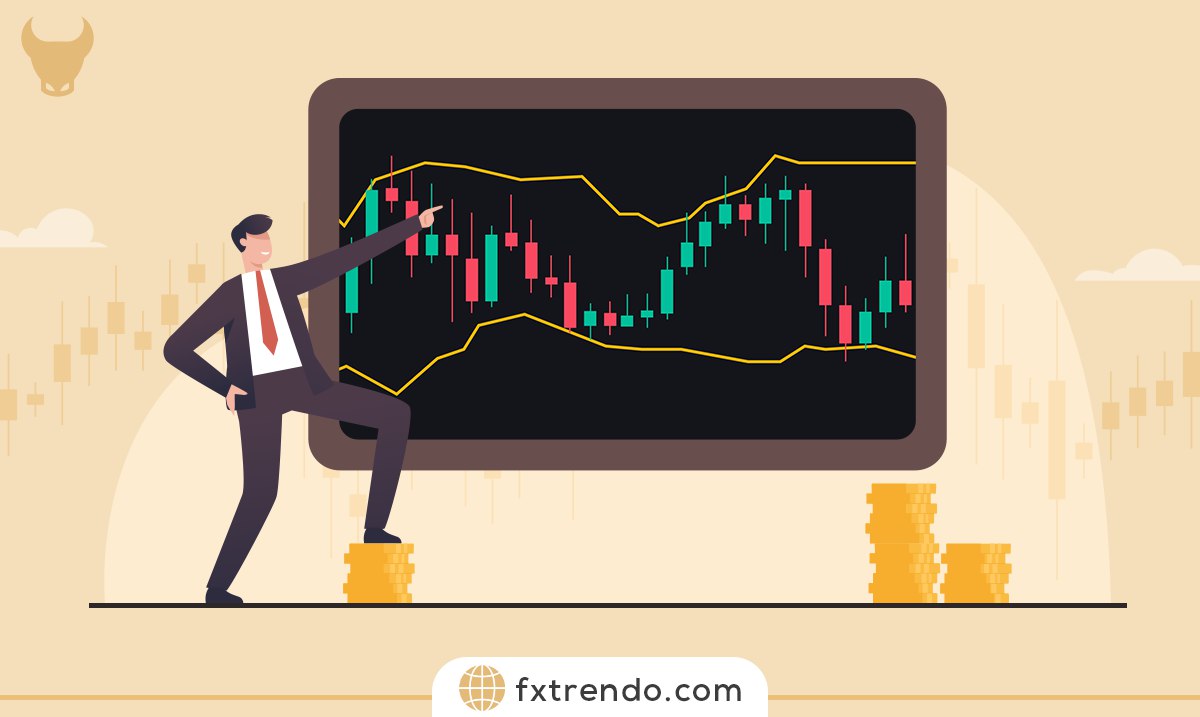
The Bollinger Band indicator is one of the most popular and widely used technical analysis tools in financial markets. This indicator was created by John Bollinger in the 1980s and shows the market’s volatility over a certain period. This indicator consists of three lines:
Middle:
This line is a moving average (usually with a period of 20) that forms the basis of the upper and lower bands
Upper:
This line shows the market’s ability to fluctuate upward and is calculated as follows. We multiply the deviation of the moving average by a fixed number (2 by default) and add the resulting value to the moving average.
Lower:
This line shows the market’s ability to fluctuate downward and is calculated by multiplying the deviation of the moving average by a fixed number and subtracting the moving average from the resulting value.
The difference between the Bollinger Band indicator & Keltner channel indicator
The difference between these two indicators is that in the Bollinger indicator, the moving average band is used as the standard deviation’s basis, and the moving average deviation is subtracted, but in the Keltner channel indicator, the ATR standard deviation is subtracted, that is why the Keltner channel is less wide than the Bollinger band. It helps us more by exiting the price from this channel and identifying the trend.
How to distinguish a trend from a trading range using the Bollinger Band indicator?
To determine whether the market is in a trend or ranging, it is enough to put two Bollinger indicators on the chart simultaneously and use a different standard deviation number in each indicator’s settings. If the price was between two upper or lower bands, the price is in a strong upward or downward trend, and if the price was between the upper and lower bands and close to the moving average, then the price is most likely in a range (We can also use a Bollinger band indicator and a Keltner channel indicator in this method). Of course, note that this method must be used in a multi-timeframe, and using it only in one time frame cannot help
How does the Bollinger Band indicator identify the trend’s strength?
These bands plot the amount of standard deviation from a simple moving average. In essence, they adapt to market conditions. When the market is more volatile, the bands widen (moving away from the average), and when the markets are less volatile, the lines converge (closer to the average). Simply put, we can say that the distance between the upper and lower lines is greater than the middle average line, the market has more power to form a strong trend movement, and when these two lines are close together, the market has less power.
Read More:
Get the best broker for Gold Trading.
Lines calculation formula
(period = 20) x 2)
(period = 20) x 2)
How to use the Bollinger Band indicator
Bollinger Bands are primarily used to identify overbought and oversold conditions, similar to what we have in the RSI indicator , but with a different calculation method.
Here are a few ways to interpret them:
Overbought & Oversold:
When the price reaches the upper band, the asset is usually overbought, and when it hits the lower band, the asset is oversold. However, these conditions do not always indicate a trend reversal point, but a stock may maintain the same tone and continue to move for a long time after reaching its saturation areas.
Pressure:
It is a pressure zone when the bands converge and limit the moving average. A period of pressure has low volatility, and the market is in a range, which can be a significant sign that the market is preparing to start a strong trend, and you can use these conditions to enter a trade in a suitable price range.
Break:
Based on Bollinger Band analysis, a Break in the upper area of the upper band or the lower area of the lower band can be considered an important signal that a new trend may have started.
Trend Reversal Trading Strategy with Bollinger Band Patterns:
W Pattern:
This pattern is a trend reversal pattern formed at the end of a downward trend, and this is the way that the price breaks the lower Bollinger band downwards once and will return near the moving average, then it breaks the lower Bollinger band downwards for the second time and makes a floor, which can be lower than the previous floor or be equal to or higher than the last floor. If this W pattern is in a higher timeframe resistance area, it can be a suitable area to enter a buy trade.
M pattern:
This pattern is formed at the end of an upward trend, and the price breaks the upper Bollinger band once, makes a ceiling, returns to the moving average, and then breaks the upper Bollinger band for the second time. It builds another ceiling, which can be higher, equal, or lower than the previous one. If this M pattern is in a support area of a higher timeframe, it can be a suitable area to enter a sell trade.
Bollinger Band Disadvantages
While Bollinger Bands can be a useful tool, like all other indicators, they have limitations:
Lagging:
Bollinger bands are a lagging indicator, meaning they do not predict future price movements. They only identify patterns that can indicate future activity.
Dependence on other indicators:
The Bollinger Bands indicator should not be used as an independent technical indicator. Bands can lead to numerous wrong signals and misinterpretations if other indicators like RSI, MACD indicator , candlestick patterns, etc., are not used.
Variable Standard Deviation:
In the Bollinger Band indicator, it is assumed that the price is usually distributed and draws the upper and lower bands with an equal distance from the middle line, but in reality and the market, such a thing does not happen because market fluctuations depend on various technical and fundamental factors, and in many cases, fluctuations are caused by economic data release, which causes sudden and unpredictable changes in the market, and the indicator does not behave correctly in this connection.
Read More:
Forex economic calendar analysis.
Summary
Bollinger Bands provides a relative definition of high and low prices and can be used to identify potential buy and sell signals. In this article, we explained the different methods of using this indicator. You can use any of these methods on your chart, create your strategy with it, and use it in your trades after backtesting that strategy. However, it is crucial to understand that you must use this strategy alongside other technical analysis tools and indicators. Always note that no indicator is perfect and should be used to confirm trades, not dictate them to the market.