

Trendline is one of the most essential tools in Forex market trading that helps traders identify the market trend direction. This technique is a graphical representation of a currency pair’s price movement connecting the high or low points of the price chart. These lines are simple yet powerful tools that can help traders identify potential trading opportunities, manage risk, and make better trading decisions.
What is a Trendline?
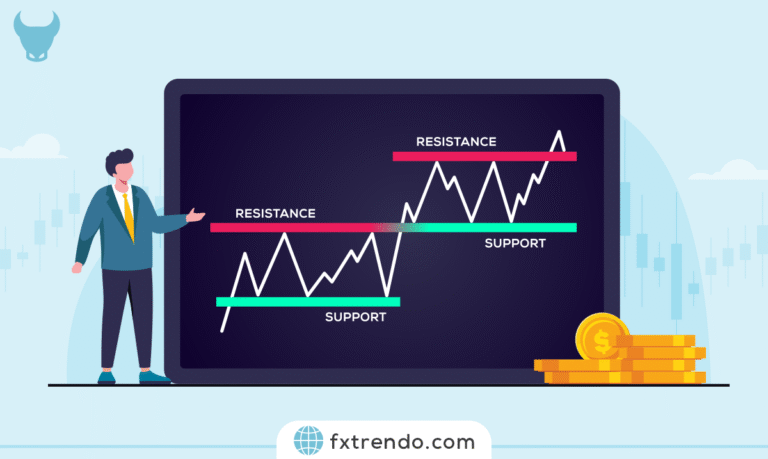
A trendline is a straight line that connects two or more price points on a chart and is used to identify a trend’s direction and provide support and resistance levels. Trendline is used in technical analysis and can be drawn in different short-term or long-term time frames. There are two types of trendlines that traders commonly use:
- Ascending Trendline
- Descending Trendline.
An ascending trendline is drawn by connecting two or more price floors, and a descending trendline is drawn by connecting two or more price ceilings.
What are Trendline patterns?
Trendline patterns are formed when the price interacts with the trendline. The three main types of these patterns are:
- Break
- Bounce
- False breakout
Further, we will explain each type with an example.
Break: Breaks occur when the price crosses the trendline. This move is significant because it shows that the market is changing direction, and we are likely to see a reversal trend.

Bounce: Bounce occurs when the price touches the trendline and then reverses. This movement can also provide trading opportunities.

False breakout: A false or fake breakout occurs when the price temporarily crosses the trendline but returns to the previous trend direction. This movement can be a trap for traders who enter positions too soon.

How to draw a Trendline?
Trendline drawing is a significant skill for any forex analyst. These lines identify trend reversal points, support and resistance levels, and possible entry and exit points for trades.
The steps to draw this line are as follows:
Step 1: Identify the trend
Before drawing a trendline, you need to identify the trend. There are three types of trends: uptrend, downtrend, and range. An uptrend is defined when the price makes higher floors and ceilings. A downtrend is when the price creates lower floors and ceilings. A range trend is when the price moves in a range and does not make higher or lower floors and ceilings.
Read More: What is a Trending & Ranging Market?
You can use one of the following tools to identify the trend:
- Moving Average
- Price action
- Trend identifying indicators
You can read a brief explanation of each tool below.
Moving Average: The moving average is a favored tool traders use to identify trends. The simple moving average (SMA) is calculated by adding up the closing prices of a currency pair in a given period and dividing the sum by the number of periods. Moving averages can help you identify trend directions and potential support and resistance areas.

Price Action: Price action is another method used to identify trends. You can tell if the price is making higher (uptrend) or lower (downtrend) floors and ceilings by looking at the price chart.

Trend Identifying Indicators: Indicators such as SAR, MACD, and ADX can help you identify trends.
Step 2: Find two points
After you identify the trend, the next step is to find two points on the chart to draw the trendline. In an uptrend, traders should look for two points where the price breaks out of the support level and goes higher. In a downtrend, traders must look for two points where the price has bounced back from the resistance level and is moving lower.
Step 3: Draw the Trendline
To draw a trendline, connect two points using a straight line. One must draw the trendline in a way that touches the specified price points as much as possible. That increases its credibility and makes it more meaningful.
Step 4: Validate the Trendline
After you draw the trendline, it is important to validate it. Validation means checking the accuracy of the trendline. Traders can use price action analysis to confirm the trendline. For example, in an uptrend, traders should look for higher ceilings and floors, while in a downtrend, traders should look for lower ceilings and floors.
Step 5: Use the Trendline
Once the trendline is confirmed, traders can use it to identify potential trading entry and exit points. You can use Trendlines in different ways in Forex trading. Here are some of the most common ways traders use trendlines:
- Identifying the trend direction
- Identifying dynamic support and resistance levels
- Trading breaks
- Price bounce trades
We explain each of the above methods below.
Identifying the trend direction: The first and most obvious use of trendlines is to identify a trend’s direction. If the trendline slopes upward, it indicates an uptrend, and if it slopes downward, it is a downtrend. Traders can use this information to make informed trading decisions.
Identifying dynamic support and resistance levels: Another use of trendlines is identifying dynamic support and resistance levels. In an uptrend, the trendline acts as a support level, and a resistance level in a downtrend. Traders can use these levels to enter and exit trades or set stop-loss orders .
Breaks: A break occurs when the price crosses the trendline. Traders can use trendlines to identify potential breaks and enter trades when the price crosses the trendline. However, it is crucial to note that breaks can be false signals, so traders should use other methods to confirm breaks.
Bounce Trades: A bounce occurs when the price touches a trendline and bounces back in the opposite direction. Traders can use trendlines to identify potential bounces and enter trades when the price pulls back from the trendline. However, it is crucial to note that bounces can also be false signals, so traders must use other methods to confirm bounces.
Trading strategy tutorial with a Trendline break
Here, we will introduce a forex trading strategy using a trendline break with an example. Remember that the trendline acts as support or resistance, and stay tuned till the end.
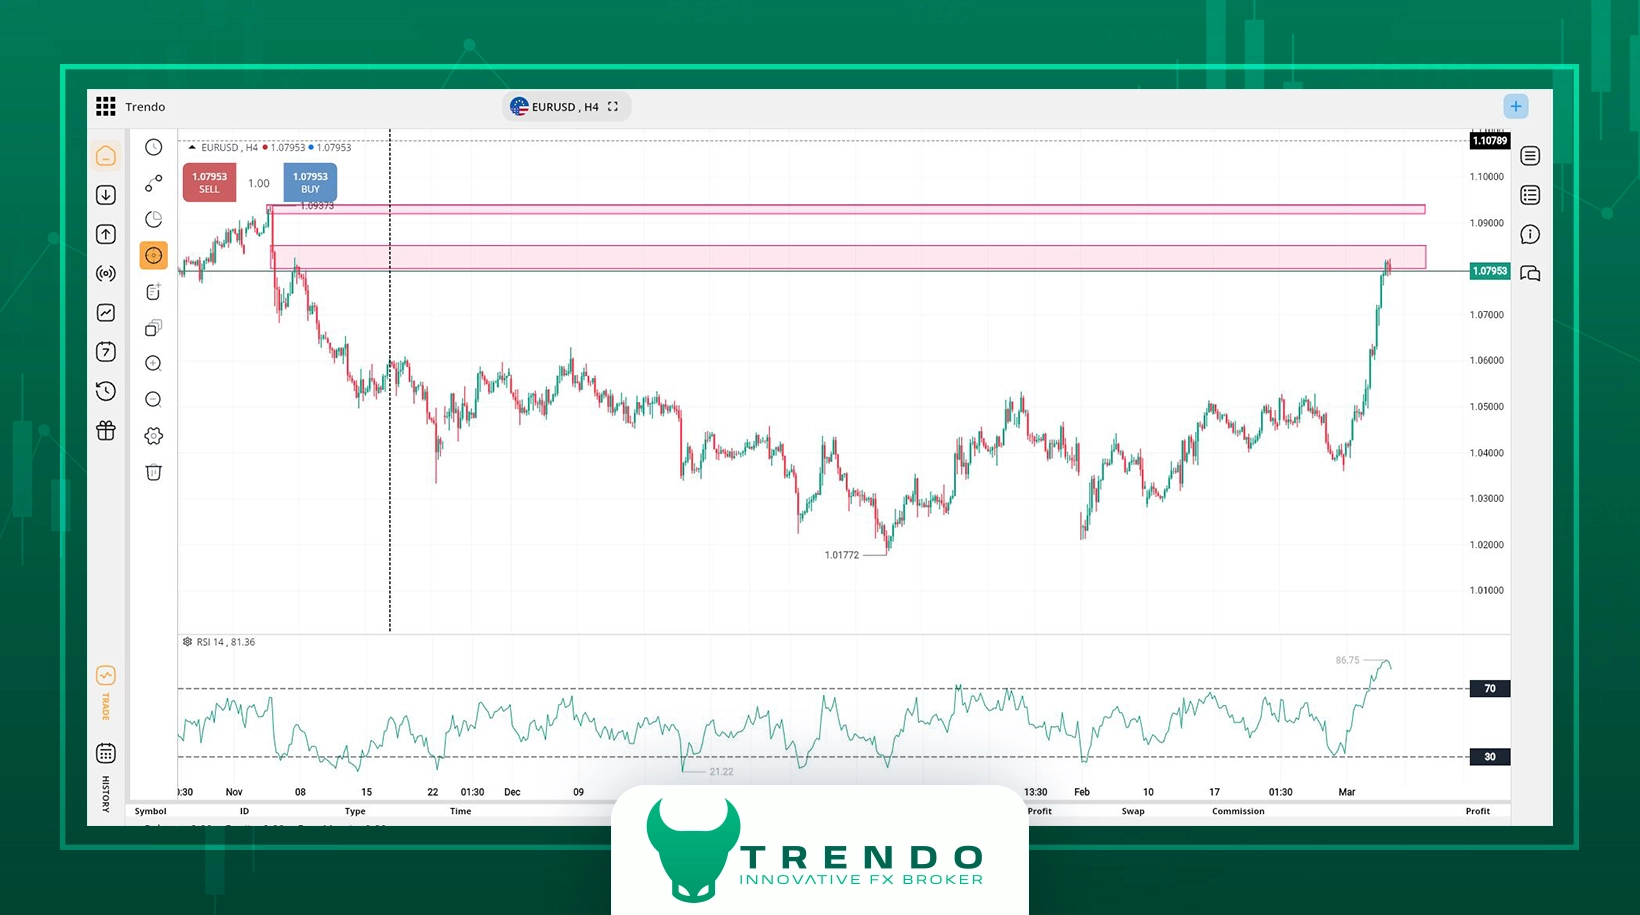
As you can see, the price has decreased following the downward trendline, and the price has returned three times when it meets the trendline. We are now in the seller’s zone, but an ascending candle might change the game.
A big ascending candle crosses the trendline and closes above it. Usually, trendline break traders wait for the price to retrace to the trendline and see a reversal candle to enter the trade. That is the safest thing to do when trading a trendline break.
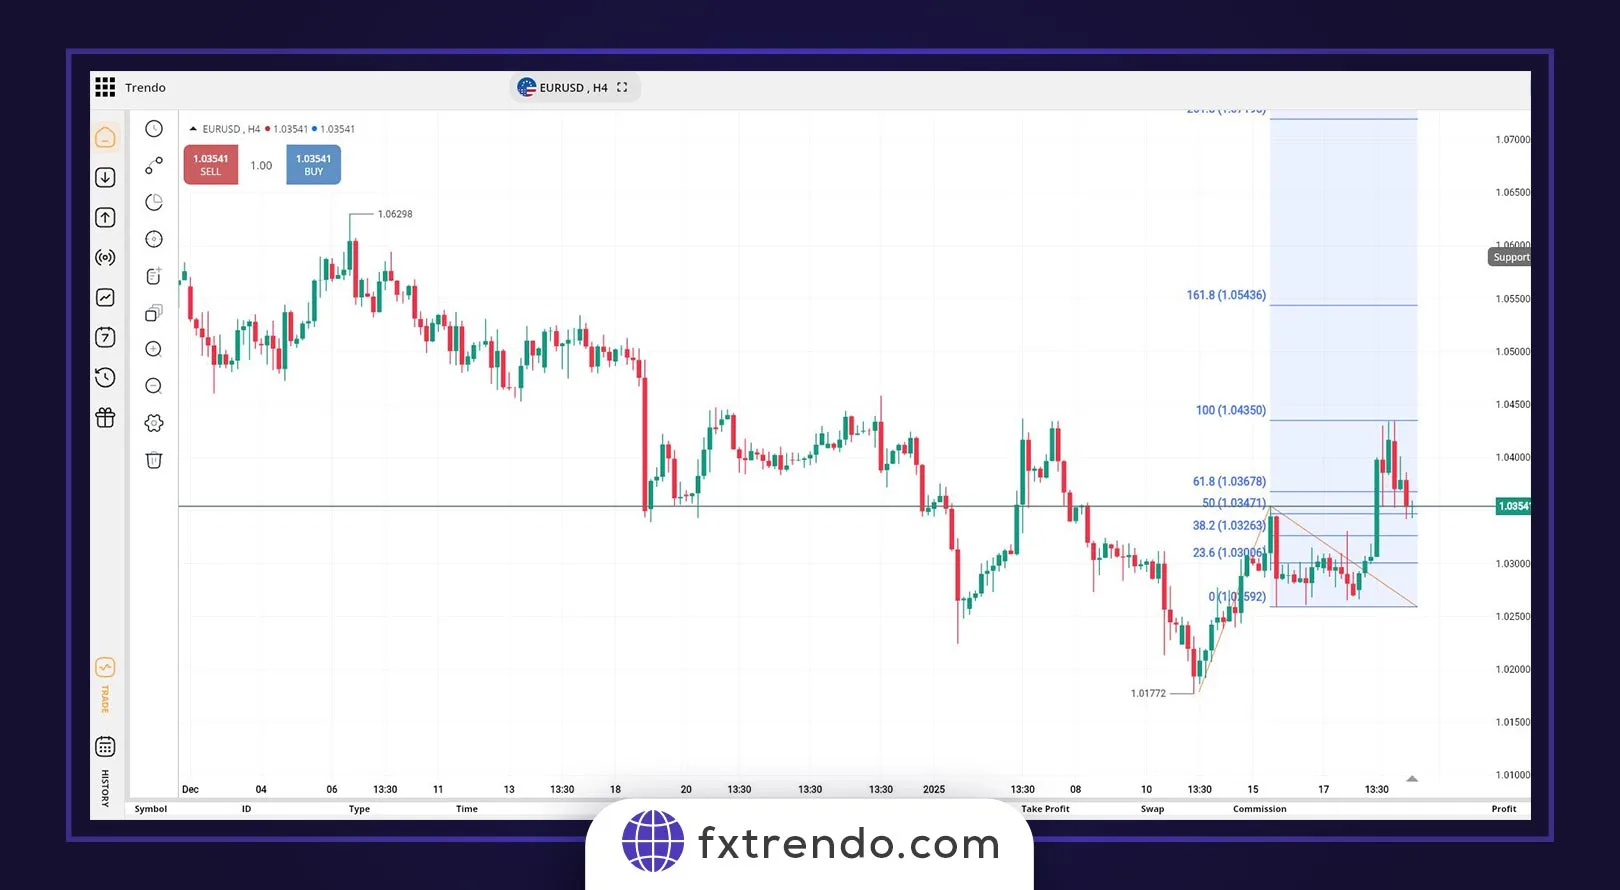
The chart shows that the price of two more candles will move up, and then a price correction will occur. Trendline resistance is now turning into support. Buyers must wait for an ascending reversal candle. Typically, bullish engulfing candlesticks or pinbars are the best reversal candles that you can use in this strategy to enter a buy trade.
Read More: What are Price retracement and Reversal Trends, and how to identify them?
The chart will range a bit, and a bullish pin bar candlestick will eventually appear. After the candle closes, traders enter into a buy trade. One must set a stop-loss order below the new support. The most reliable option for taking profit or the transaction being risk-free is at the last ceiling of the previous one.
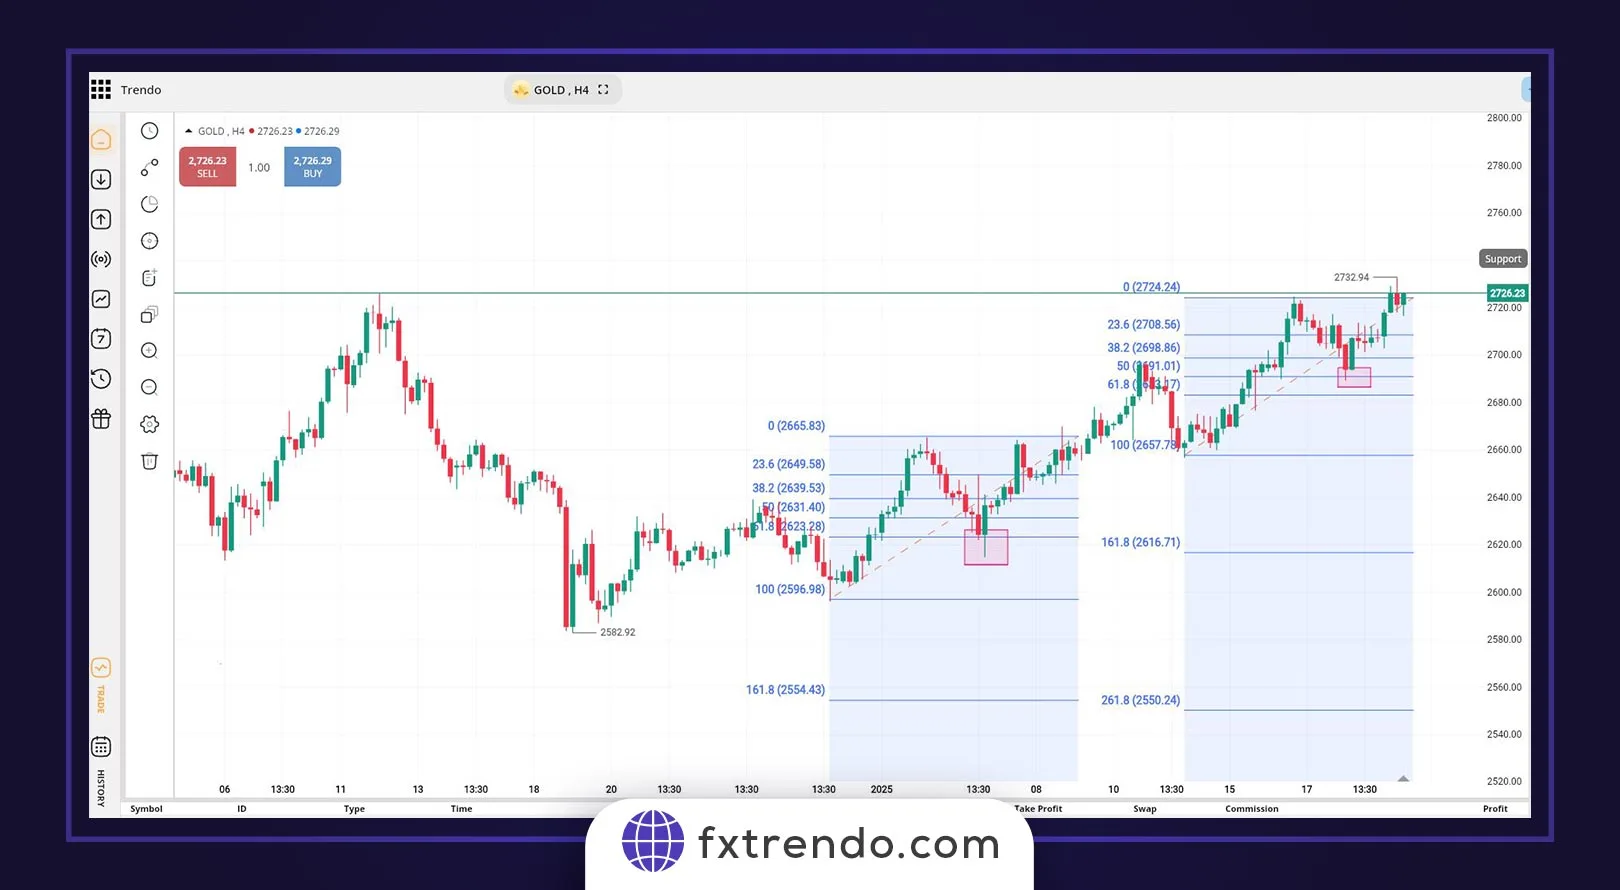
Further, we see that the trendline has performed its supporting role well, and the price jumps upwards.
And finally, this strategy works well and gives the trader a risk-to-reward ratio of 1 to 5. Remember that no strategy has a 100% success rate, and consider risk and capital management in your trades.
Read More: capital management, the best trading strategy in Forex.
Summary
Trendlines are a helpful tool in forex trading that can help traders identify the market trend direction. They are easy to use, and you can use them with other technical analysis tools to provide a more complete picture of the market. To use trendlines effectively, traders must understand the market and the various factors that can affect the trend direction well. They should also be able to identify potential support and resistance levels based on the trendline. With practice and experience, traders can use trendlines to make more informed trading decisions and increase their chances of success in the forex market.