Fake Breakout is one of the most challenging aspects of Forex trading. Fake Breakout is a term used to describe a false breakout in trading when the price breaks through a key support or resistance level but reverses its course and returns to its previous trading range.
Why do fake price breakouts happen?
Fake breakouts can occur for various reasons. Two of the most common reasons are:
- Market manipulation
- Market fluctuations
Stay tuned for the explanation of these reasons.
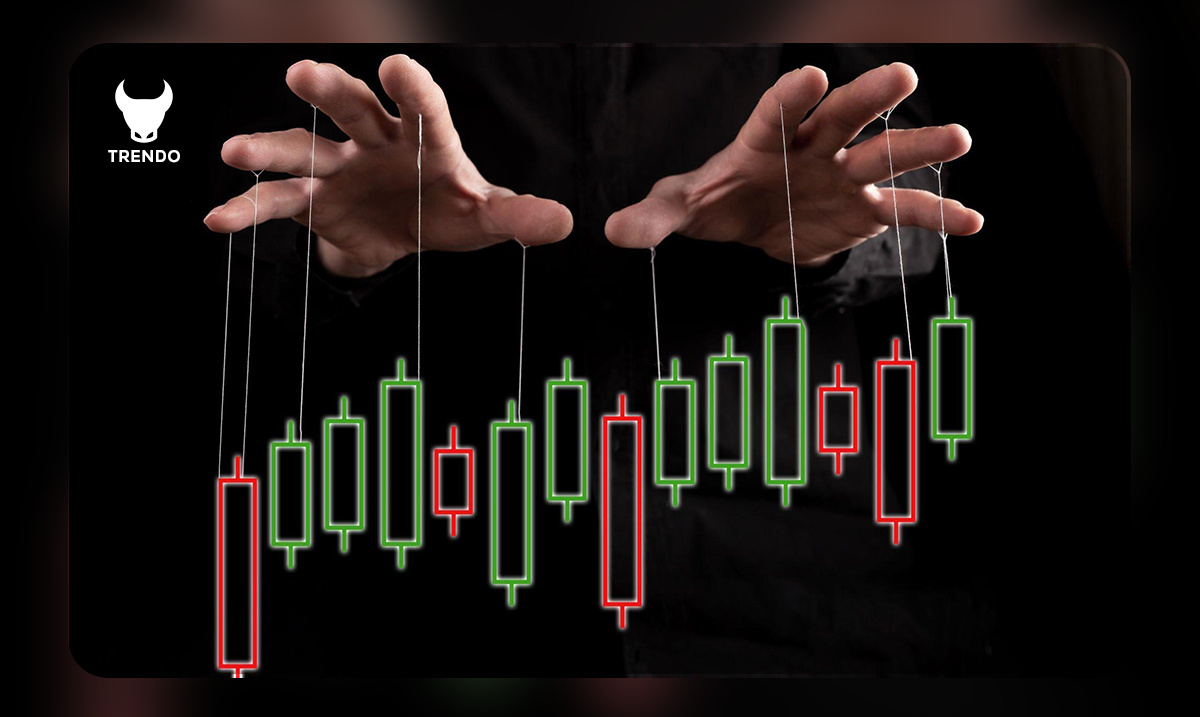
Market Manipulation: Traders or large institutions may use Fake Breakout to manipulate the market and generate false signals. They may push a currency pair’s price above or below a key level so that the price hits stop-loss orders and traps traders on the wrong side of the market.
Market Fluctuations: The Forex market can be volatile, especially during news events or major economic announcements. High volatility leads to sudden and unexpected movements, even in minor currency pairs , which can result in fake breakout.
Common Fake Breakout Patterns
Fake breakout often follow predictable setups that trap impulsive traders. Spotting them early allows you to fade the move confidently or simply stay on the sidelines. Here are three of the most common patterns traders face regularly.
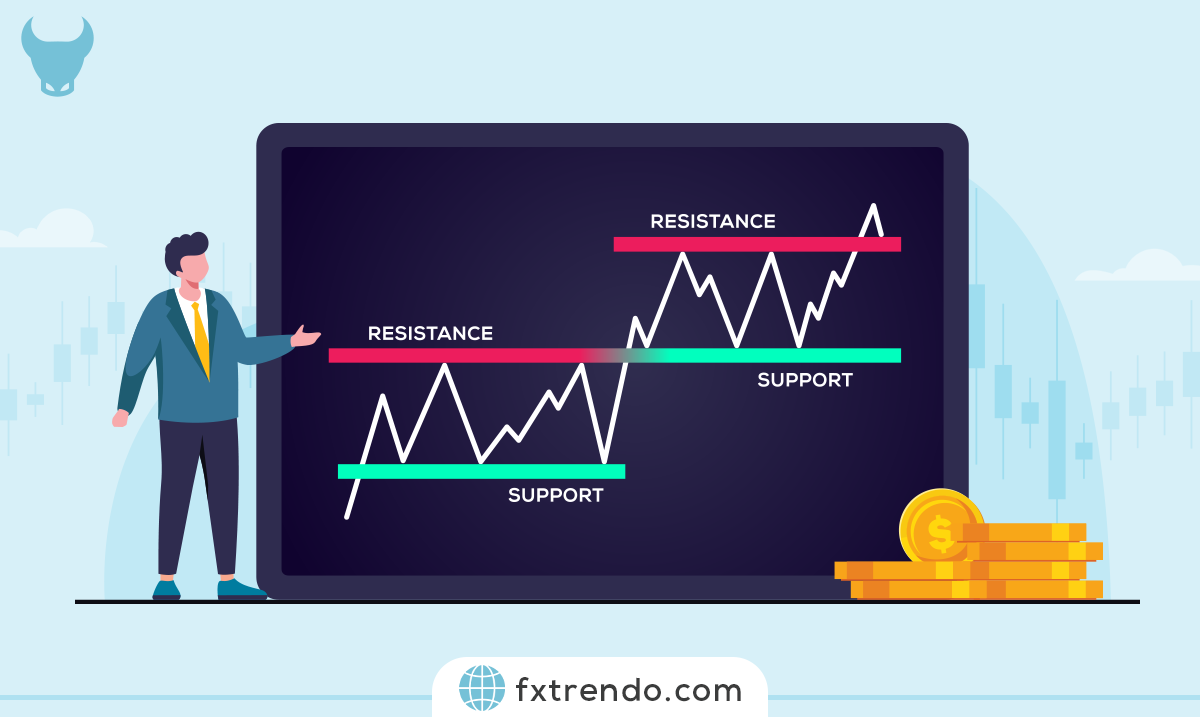
False Breakout at Support/Resistance
Price briefly pushes through a clear support or resistance level but quickly reverses back inside the range. This is especially common at round numbers or previous swing highs/lows.
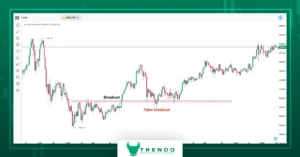
How to trade it practically: Look for rejection candles with long wicks or pin bars that show buyers/sellers failing to hold the breakout. Wait for the price to close back inside the level before entering a counter-trade. Place your stop just beyond the rejection wick’s extreme (adjust based on volatility and your risk tolerance). Target the opposite side of the range or the next logical level. On lower time frames, these reversals often develop relatively quickly, making them suitable for intraday setups. In the image below, an example of a breakout and a false breakout is shown on the H4 gold chart.
Fake Breakouts After News Releases
High-impact news events cause sharp spikes that breach levels and trigger stops, but the initial move frequently reverses once the emotional reaction fades.
Practical approach: Avoid jumping in on the immediate post-news breakout. Wait for a while until the initial volatility settles and the market shows its true direction. If price returns to the broken level and forms clear reversal candles (engulfing, pin bar, etc.), consider fading the spike. Set stops beyond the news-driven extreme and target rewards that align with your personal risk management rules. Many traders find it safest to stay out entirely during the immediate post-news period, as this is where most traps occur.
Breakouts with Low Volume
Price breaks a level, but volume remains flat or even drops compared to the consolidation phase. Genuine breakouts typically show rising volume to confirm conviction.
What to do: Always check the volume bars during a potential breakout. If volume is noticeably lower or merely average while the range buildup showed stronger activity, treat the move as suspicious. Wait for a retest of the level or a clear reversal signal before taking action. Pairing this with price action observation helps greatly—low-volume breakouts often fail when price returns to test the level.
How to identify false breakout in the forex market?
Here are some methods on how to spot false breakout in trading.
These methods include:
- Using multi-timeframe analysis
- Understanding market trends
- Identifying price patterns
- Using technical indicators
- Observing trading volume
- Attention to news events
We will explain each of these methods below.
Using multi-timeframe analysis: One of the best ways to avoid detecting a false breakout pattern is to use multiple time frames when analyzing the market. This technique allows traders to see the bigger picture of what is happening in the market and identify key trends and patterns that drive prices. For example, if a trader uses the 15-minute chart to trade, he should also look at the 1-hour and 4-hour charts to understand the overall trend better. Traders can avoid getting caught up in short-term swings that might lead to fake breakouts this way.
Read More: Multi-time frame (MTF) or Time analysis for trading in the forex market
Understanding the Market Trend: The first step to spotting a fake breakout pattern is understanding the market trend. Fake Breakouts usually occur when the market is in a bearish or neutral trend. Traders should identify the trend, and if the market is in a ranging trend, they should be extra careful of fake breakouts because they are more likely to occur.
Identifying Price Patterns: Price patterns are essential tools for forex traders to identify fake breakouts. Traders should look for patterns such as triangles, heads and shoulders, and double bottoms or tops. These patterns provide clues about the market’s direction and can help traders identify potential fake breakouts. For example, a double-top pattern may indicate a potential fake-out because the market will likely reverse after testing the resistance level.
Using Technical Indicators: Technical analysis indicators are another tool that traders can use to identify false breakout in trading. Indicators such as the Relative Strength Index (RSI), MACD , and Bollinger Bands can help traders identify potential fake breakouts. For example, when the RSI is in the overbought zone, and a price breakout occurs, it may indicate a fake out, and a reversal is likely to occur.
Read More: Relative Strength Index (RSI) indicator and teaching its use in technical analysis
Observing Trading Volume: Volume is a fundamental factor in forex trading, and traders should monitor it to detect possible fake breakouts. A sudden increase in volume may indicate a potential fake breakout because market participants may take a position in the wrong direction. Traders should also monitor the volume in the trend because it provides clues about the market direction.
Attention to News Events: News events can significantly affect the forex market, and traders should pay attention to them to identify potential fake breakouts. For example, when a news event causes a sudden jump in the market, it may indicate a potential fake breakout because the market may return to the main trend. Traders should also be attentive to news events such as interest rate announcements or economic data releases that may cause market volatility. You can get this information from Trendo Broker’s economic calendar analysis page.
Tools and Indicators That Help Confirm Breakouts
Waiting for confirmation reduces fakeouts dramatically. These tools give objective filters you can apply on any chart in seconds.
Volume Indicator
Real breakouts show expanding volume in the direction of the move.
Practical use: On the Trendo Trading Platform, add the standard volume oscillator. Only take breakouts when the breakout candle’s volume is at least 50–100% higher than the average of the last 10–20 candles. If volume shrinks on the break, skip the trade or prepare to fade. Pair with price closing strongly away from the level for higher probability.
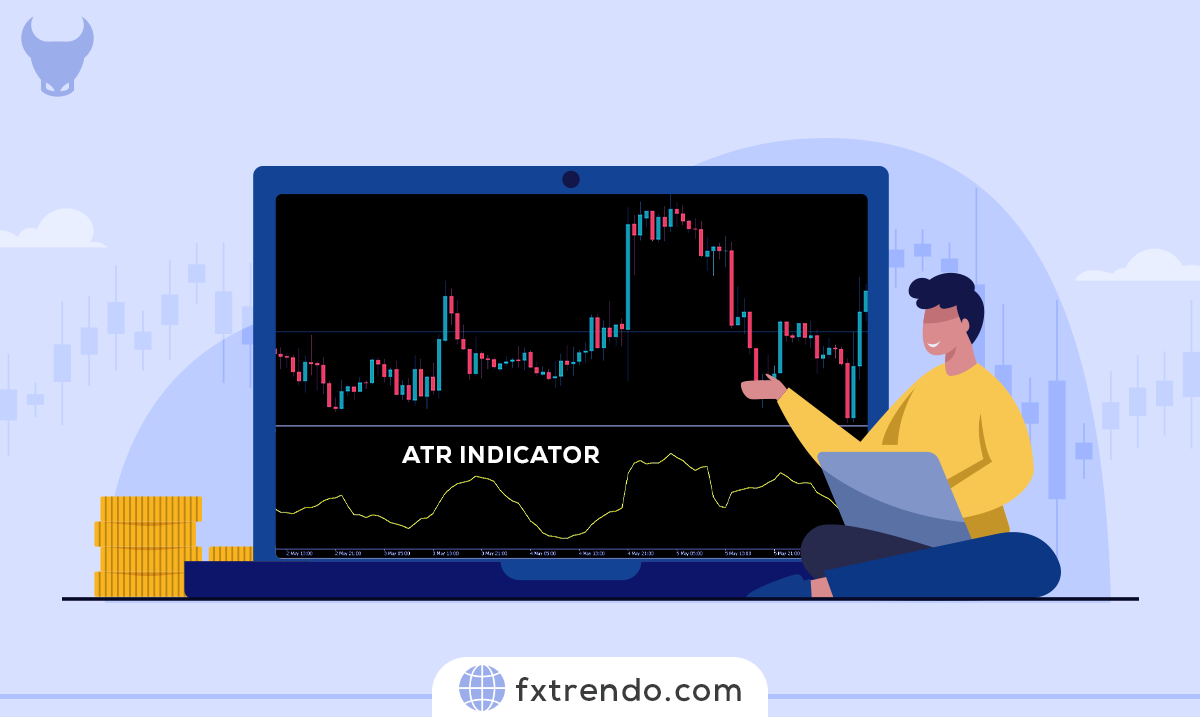
ATR (Average True Range)
ATR measures average volatility. Genuine breakouts typically move 1–2X the daily ATR quickly.
How to apply it: Set ATR to 14 periods. When price breaks a level, check if the move covers at least 1X ATR within 3–5 candles. Smaller moves are often traps. Use ATR to set realistic stops (1–1.5X ATR beyond the level) and targets (2–3X ATR). Great filter during low-volatility sessions like Asia.
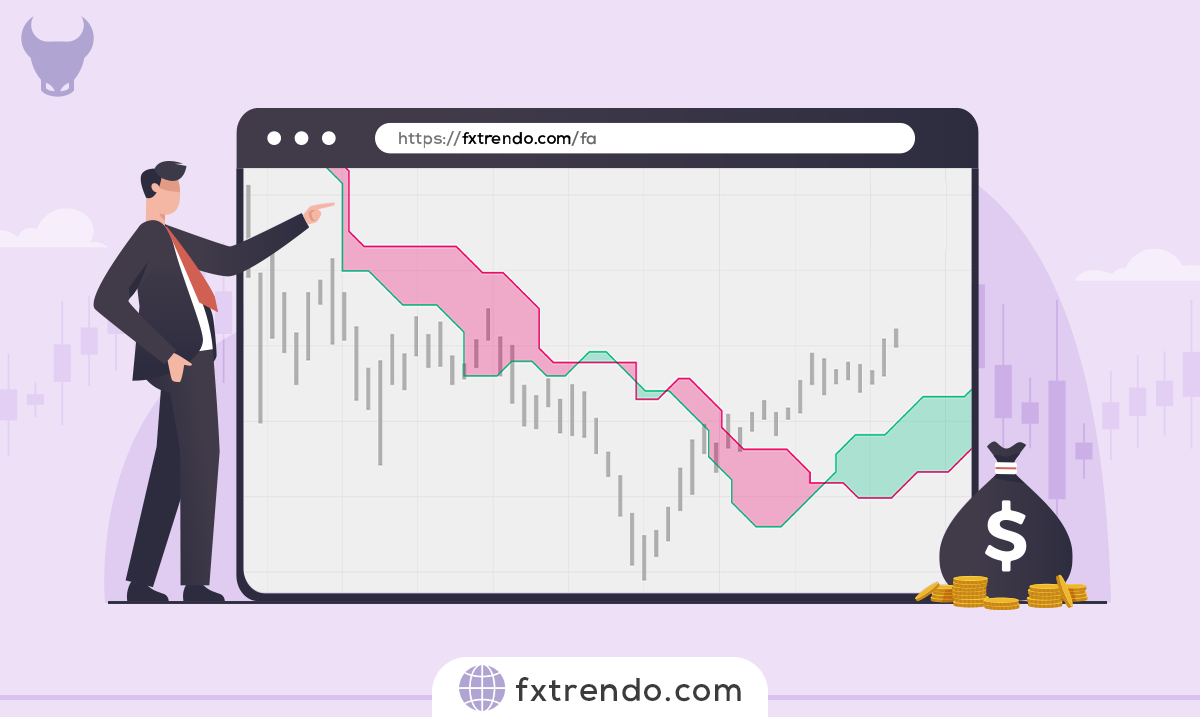
VWAP / Moving Averages
VWAP acts as dynamic intraday fair value; simple MAs (50/200 EMA) show trend bias.
Real trading use: Only take upside breakouts when price is above daily/4H VWAP and the 50 EMA. For confirmation, wait for a pullback to VWAP/EMA that holds, then enter on continuation. If the breakout happens below VWAP with no MA support, it’s usually fake. Institutional traders watch VWAP heavily—respect it.
Order Flow Tools
Footprint charts, cumulative delta, or volume profile show buying/selling absorption.
Practical application: Look for absorption at the breakout level—high volume but little price progress means smart money is defending the level. Positive/negative delta divergence on the break signals weakness. If you have Bookmap, Jigsaw, or Sierra Chart, wait for aggressive buyers/sellers to dry up before fading. Even basic volume profile helps—breakouts failing at high-volume nodes usually reverse.
Breakout Filters
Simple rules that stack the odds: higher timeframe alignment, session timing, and retest requirement.
How to use them daily: Only trade breakouts in the direction of the 4H/daily trend. Prefer London/New York overlap hours—Asian session breaks fail more often. Always require a retest of the broken level as new support/resistance before entering. These three filters alone cut fakeouts by 60–70% in most backtests.
False Breakout Strategy
Read this section carefully to find the answer to the vital “what is a false breakout in trading” question. Trading fake-outs might seem impossible, but this is not correct. You can use the false breakout trading strategy as discussed below, but to do so, we need a proper and comprehensive understanding of the market.
For Buy
The chart below shows a fake breakout pattern in the EURCAD currency pair in the 15-minute time frame.
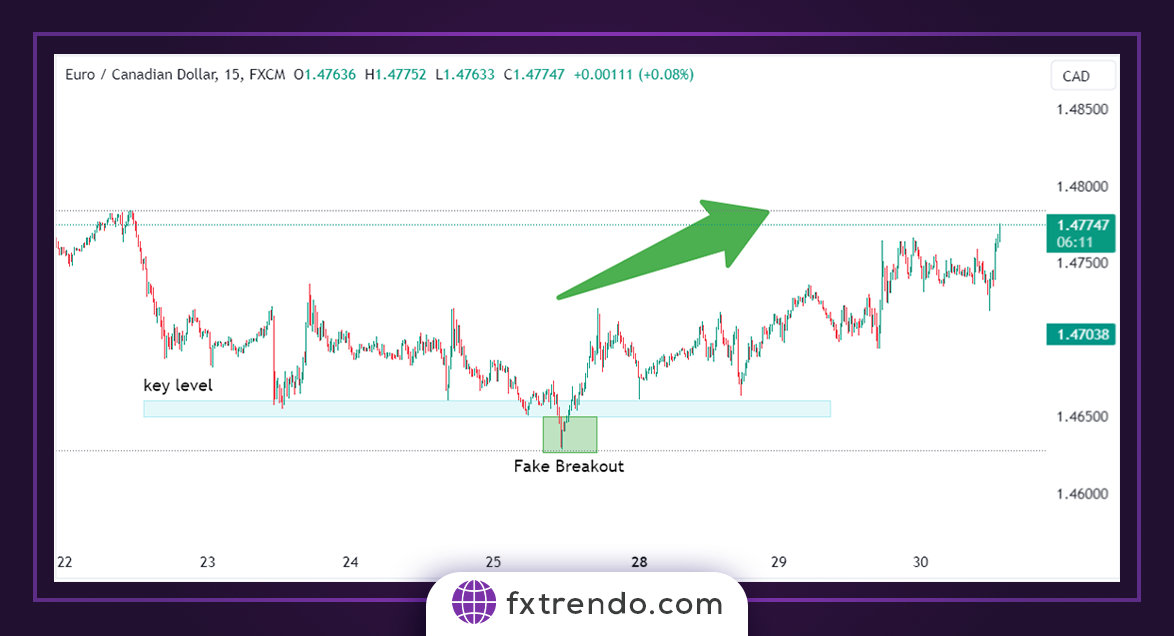
As you can see in the image above, we can enter a buy trade after the price falsely breaks below the support zone and quickly returns above the level. This quick return above the support level shows that the sellers failed to control the market. Now, the buyers have taken over and are driving the market to a higher ceiling.
For Sell
The chart below shows a EURUSD fakeout in the 15-minute time frame.
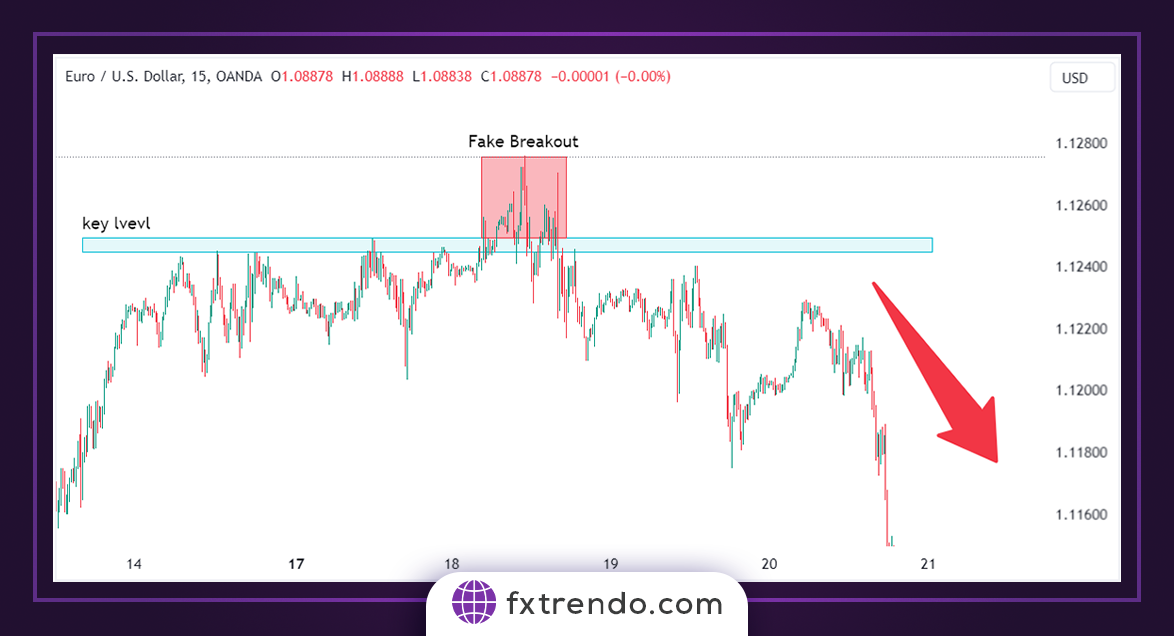
The image above shows a fake breakout in this forex pair. This currency pair was in an uptrend, and while trying to go above the resistance line, it immediately returned below the resistance level. That confirms the fake out and allows us to enter a sell trade. The price then creates lower floors in a downtrend.
What points to consider when trading fake breakouts?
- First, find key levels on the price chart. These levels are areas that provide a lot of liquidity to market participants.
- Avoid trading with breakouts occurring in ranging or neutral trends because buyers and sellers have equal power in these moments. In this situation, the probability of sharp movements is very high, so we always recommend trading breakouts only in trending markets.
- Wait for the price to break through a key level in the uptrend or downtrend with the close of a candlestick.
- After the breakout, wait for the price to test the breakout level with a pullback to confirm the breakout’s correctness.
Summary
Fake breakouts are a common occurrence in financial markets. This type of breakouts can be frustrating and costly for traders, but can also provide opportunities for profitable trades. Traders who can identify and manage fake breakouts using different strategies and techniques can increase their chances of success in the forex market.