Understanding the term “cycle” and finding the answer to the question “What are market cycles?” is one of the fundamental principles of technical analysis and plays a key role in traders’ success. Most price changes in financial markets appear in the form of specific market cycles that follow repetitive patterns and trends. Recognizing and analyzing these market cycles can help traders make informed decisions and capitalize on market opportunities. Market cycles not only reflect the collective behavior of investors but also serve as a tool for predicting the future. In this article from Trendo, we first explore the concept of the market cycle and its importance in technical analysis. Then, by introducing the different market stages and market phases of the market cycle along with the confirmation signs for each market phase, we aim to provide you with a better understanding of how the market behaves. Join us to gain one of the most practical tools in financial markets.
What is a Cycle | What is a Market Cycle?
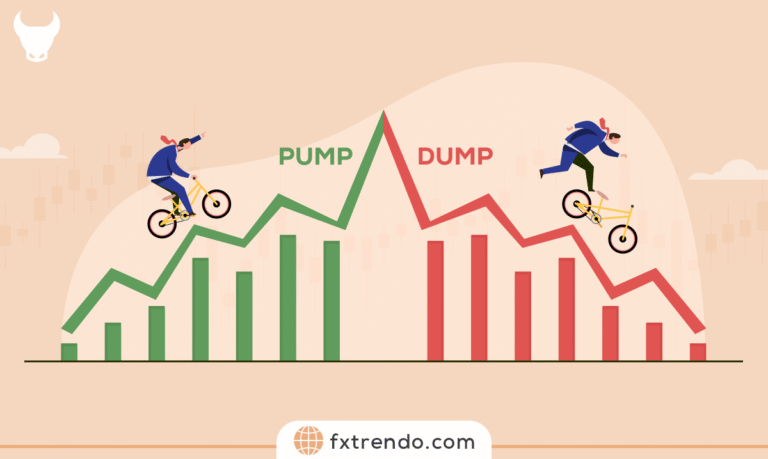
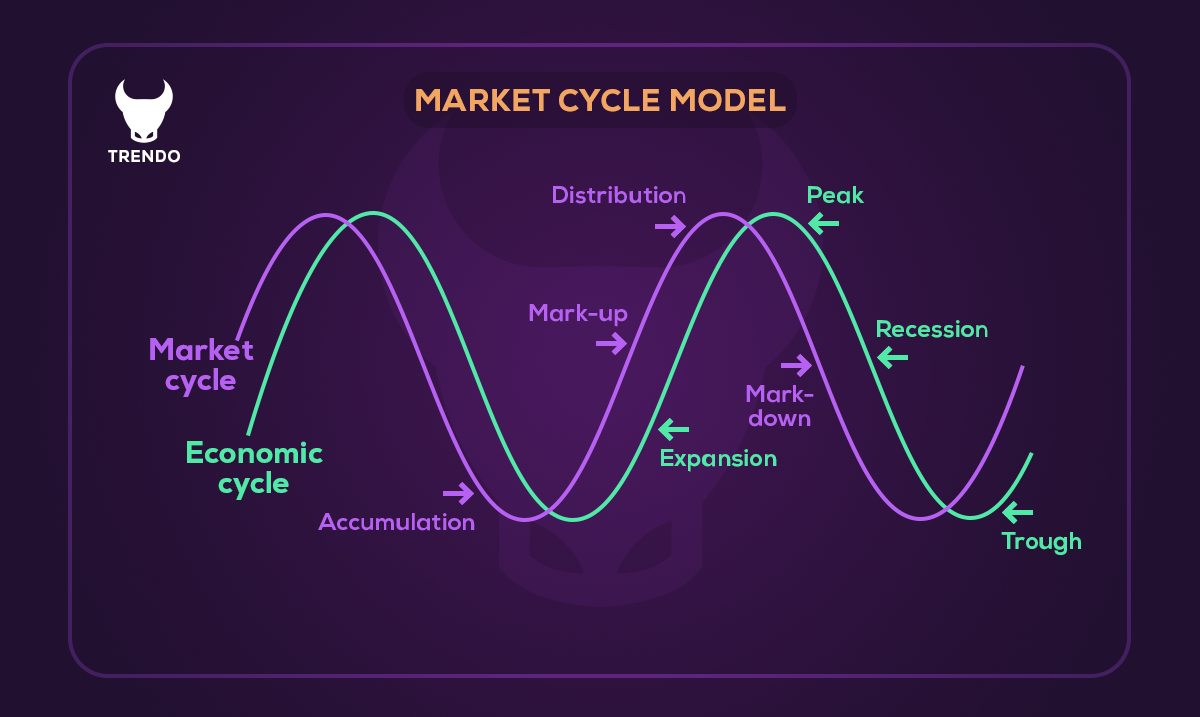
In financial markets, there are repetitive trends that we call market cycles—and to be more precise, when asked “what is a cycle,” it refers exactly to these market cycles. Achieving a complete understanding of financial market cycles and their various market stages is extremely vital. Some market cycles represent strong patterns of asset price changes that show us in which market phase the financial markets are currently. Others relate to economic growth or recession. For example, one of the well-known examples of time cycles in trading is the four-year Bitcoin price cycle, which typically occurs after halving events and delivers substantial profits to traders. In this article, we focus on introducing price-based market cycles in financial markets. Simply put, the distance between two major lows or two major highs in price is called one market cycle. These market cycles consist of the 4 stages of market cycle: accumulation, markup (rally), distribution, and markdown (decline). In the following sections, we will examine these market cycles in detail and the role of each market phase.
What is the Difference Between Trend and Market Cycle?
Trend and market cycle are two related but distinct concepts in analysis. A trend refers to the dominant direction of price movement over a period: bullish (higher highs and higher lows), bearish (lower highs and lower lows), or ranging. However, the market cycle is a broader, repetitive structure that includes the 4 stages of market cycle: accumulation, markup, distribution, and markdown. It is largely based on the Wyckoff method. In reality, a trend is part of the market cycle—for instance, the markup market phase corresponds to a bullish trend—but the full market cycle also includes ranging periods (accumulation/distribution) that lack a clear trend. Thus, trends are shorter-term and directional, while market cycles are longer-term and cyclical. Understanding this difference allows you to trade within trends while using market cycles for long-term strategy planning.
Types of Phases in a Market Cycle
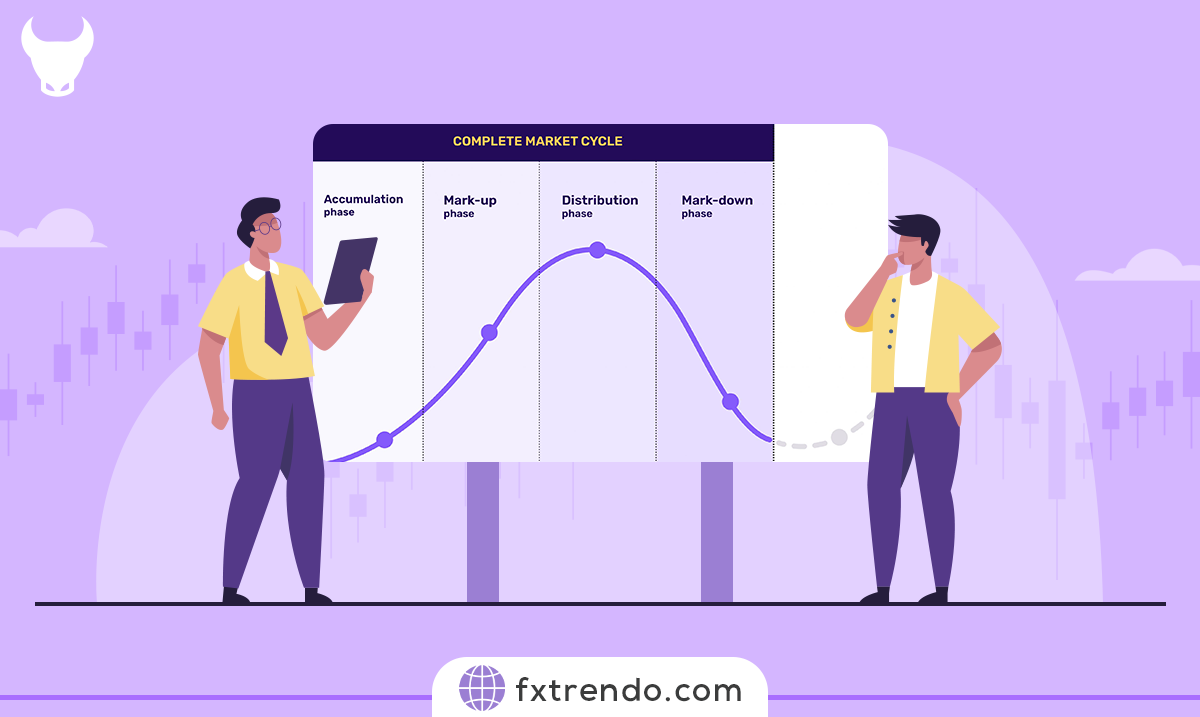
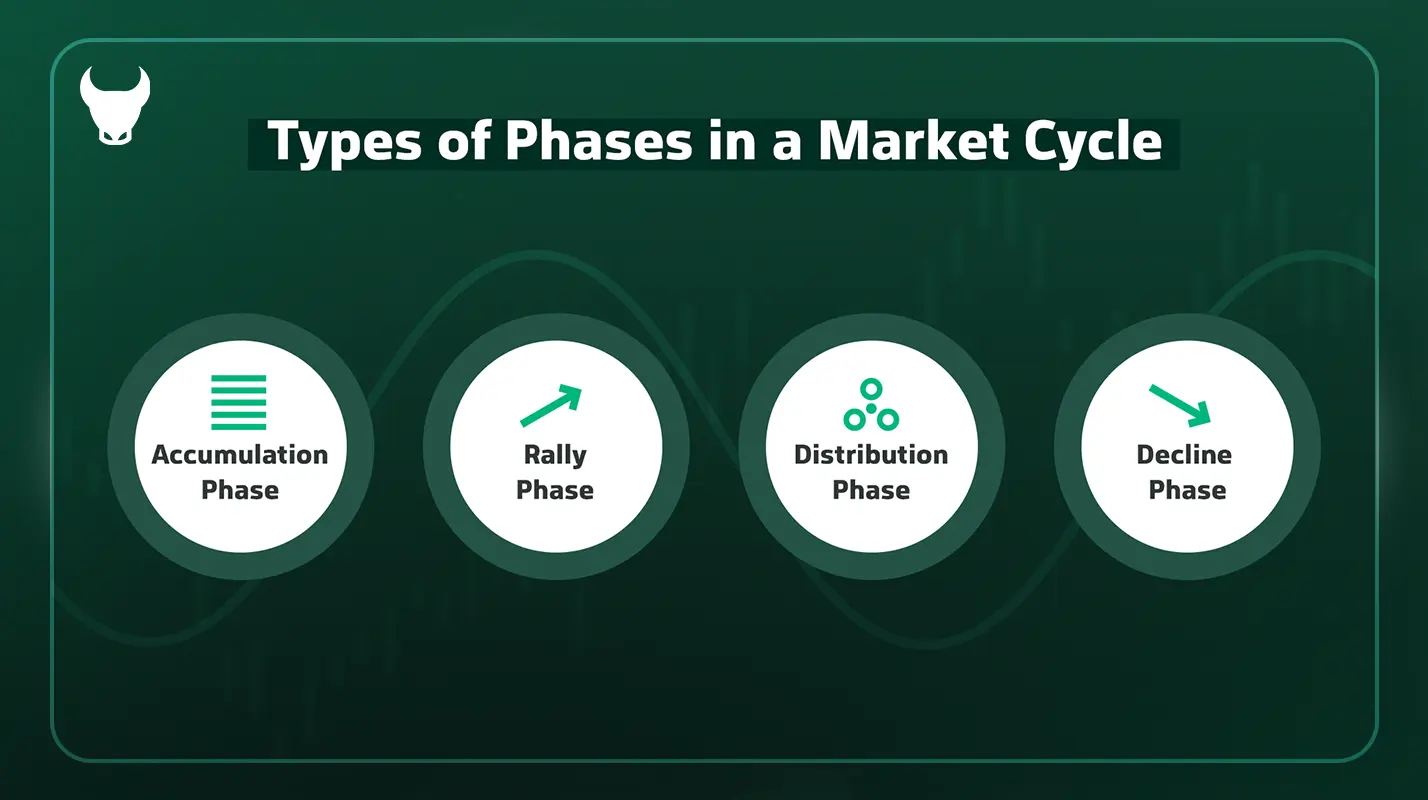
A complete market cycle consists of four distinct market phases (the 4 stages of market cycle): Accumulation, Rally, Distribution, and Decline. This division, popularized by Wyckoff’s trading methodology, provides a framework for identifying opportunities and risks in various market stages of the market cycle.
Let’s explore each market phase in detail:
1. Accumulation Phase
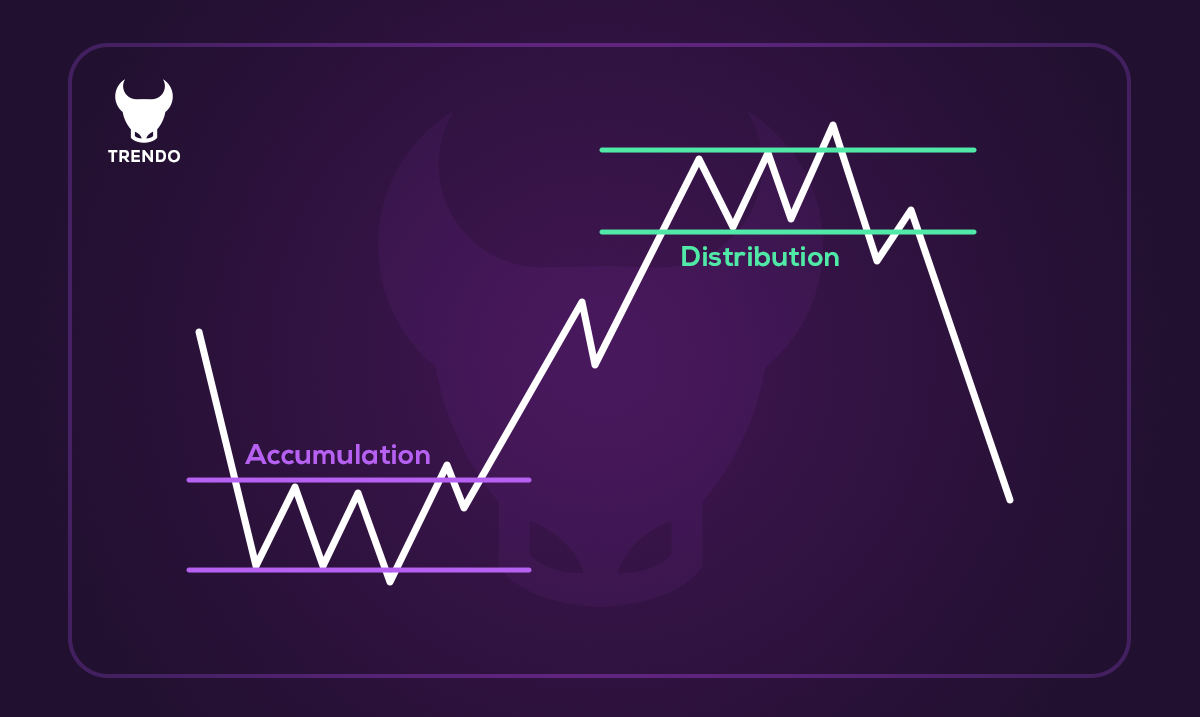
The accumulation phase marks the bottom of the market cycle, where asset prices reach their lowest levels. During this phase, professional investors and institutions quietly buy assets at undervalued prices while most retail traders remain cautious or pessimistic after a previous market decline.
This phase often spans a long period and can be challenging to identify in real-time. Prices generally move sideways, forming a consolidation range.
Read more: What is a trading strategy?
The key to succeeding in this phase is thorough market analysis to recognize when prices are significantly below their intrinsic value. Patience is vital, as this stage lays the groundwork for the next upward trend. Traders who buy during this phase and hold their positions often benefit the most when the market transitions into a rally.
2. Rally Phase
Also known as the uptrend phase, the rally represents a period of strong price growth across the market. Demand outpaces supply, driving asset prices higher. This phase is typically fueled by increasing investor confidence, positive market sentiment, and favorable economic conditions.
Traders who bought during the accumulation phase see their investments grow, while those entering during the rally must exercise caution. Risk management is crucial, as rapid price increases can lead to occasional corrections. Professional traders often take partial profits during these corrections, ensuring they secure gains while remaining exposed to the continued upward trend.
3. Distribution Phase
The distribution phase occurs when the market reaches its peak. Prices stabilize or fluctuate within a narrow range, and experienced investors begin selling their holdings to lock in profits. This phase is marked by high trading volume, as optimism and greed dominate market sentiment, luring inexperienced traders into buying at elevated prices.
Identifying this phase is essential for professional traders, as it signals the need to exit positions before a market downturn. Poor risk management or failure to recognize distribution patterns can lead to significant losses when the market shifts into the next phase.
Read more: Grave trading mistakes in the Forex and financial markets that waste your capital
4. Decline Phase
The decline phase, or downtrend, is characterized by falling asset prices and widespread pessimism. Large-scale selling by institutions and investors drives prices lower, creating an environment of uncertainty and fear.
Traders face significant risks during this phase, especially those attempting to trade against the prevailing trend. The safest strategies involve exiting positions early, adhering to strict stop-loss levels, or capitalizing on the downtrend by short-selling. Maintaining a well-defined trading plan and limiting exposure to high-risk trades are essential for preserving capital during this phase.
By understanding the characteristics of each phase in a market cycle, traders can better anticipate market movements and make informed decisions. This knowledge allows them to identify profitable opportunities while managing risks effectively throughout the cycle.
Common Mistakes Traders Make in Each Market Cycle Phase
Traders in every phase of the market cycle may commit errors due to psychological issues and failure to follow principles, often leading to significant losses. These mistakes can be mitigated by truly understanding what a cycle means in trading. Below, we review the most common mistake in each phase:
Lack of patience and premature entry in the accumulation phase:
Many traders enter positions too early without waiting for full confirmation of the accumulation phase (such as increased volume or a breakout from the range) and fall into stop-hunts by whales. For example, buying at a false bottom without RSI confirmation above 30 or high volume can lead to 10-15% losses, sidelining the trader for the rest of the cycle.
Greed and holding positions too long in the markup phase:
During the markup stage, traders often ignore their predetermined take-profit levels and hold positions excessively, hoping for further gains. This greed causes them to experience corrections and lose the profits already earned.
Fear of missing out and late entry in the distribution phase:
FOMO drives traders to enter near the end of the distribution phase, close to the top, often with high leverage. Buying in overbought conditions (RSI above 80) is frequently followed by sharp drops and heavy losses.
Denial of the trend and averaging down losses in the markdown phase:
In the markdown stage, the most common error is denying the downtrend and hoping for a reversal—for example, adding to losing positions during a strong decline without proper risk management, which can lead to margin calls.
These errors are primarily psychological and can be prevented by adhering to risk management, maintaining a trading journal, and sticking to your plan.
Confirmation Signs for Each Phase in a Market Cycle
Identifying the phase of a market cycle is crucial for making informed trading decisions. Each phase—Accumulation, Rally, Distribution, and Decline—has distinct confirmation signs that traders can observe to anticipate market behavior. Let’s explore these signs to help you navigate the markets more effectively:
Accumulation Phase Signs
1. Price Insensitivity to News: During accumulation, the market may not react as expected to news or economic data. This lack of movement signals that large investors are quietly buying assets without drawing attention.
2. Frequent Stop-Loss Hits: Retail traders often find their strategies ineffective during this phase, leading to repeated stop-loss triggers. This is because the market typically moves in a tight range with low volatility.
3. Unusual Calm in Sentiment: Market sentiment may feel neutral, with neither excessive optimism nor pessimism. Recognizing this quiet period is key to identifying accumulation.
Rally Phase Signs
1. Higher Highs and Higher Lows: The market consistently breaks previous resistance levels, establishing a clear uptrend.
2. Increased Trading Volume: A surge in volume indicates strong participation from both institutional and retail investors.
3. Positive Sentiment: Optimism prevails, with traders and investors showing increased confidence in the market’s direction.
Distribution Phase Signs
1. Resistance at Key Levels: Prices struggle to break new highs and may repeatedly test resistance levels.
2. Mixed Sentiment: While some traders remain optimistic, others begin to sense overvaluation, leading to conflicting opinions in the market.
3. High Trading Volume with Sideways Movement: This phase often features significant trading activity but with little price progression, as large players start selling off their holdings.
Decline Phase Signs
1. Price Sensitivity to Negative News: The market reacts strongly to even minor bad news, amplifying downward trends.
2. Lower Highs and Lower Lows: A clear downtrend emerges, with prices consistently breaking support levels.
3. Panic and Extreme Pessimism: Fear dominates the market, causing many traders to exit positions at a loss, while others hesitate to re-enter.
By understanding these confirmation signs, traders can better align their strategies with the market’s phase. Whether it’s recognizing the quiet build-up in the accumulation phase or the emotional extremes in distribution and decline, staying vigilant can significantly enhance decision-making and profitability.
Tools for Detecting Market Cycles and How to Use Them
Detecting the market cycle is one of the most critical skills in technical analysis, with various tools available to identify the phases of accumulation, markup, distribution, and markdown. The RSI indicator is one of the most widely used; when RSI is below 30, it signals oversold conditions and potential entry into accumulation, while above 70 indicates overbought conditions and proximity to distribution. For instance, in the EUR/USD pair, if the daily RSI reaches 25 and price consolidates in a support range, the start of accumulation can be anticipated.
The MACD indicator is also useful for spotting divergences—positive divergence at price lows signals accumulation. Volume is another key tool for cycle detection: rising volume on a breakout from a range confirms the markup phase. For example, if volume in the accumulation phase is 50% above the 30-day average, it demonstrates strong institutional buying. Combining these tools with the Wyckoff method yields the best results: first identify ranging market behavior, then confirm the phase using volume and RSI. This data-driven approach reduces error probability and helps traders enter at optimal points.
Using Time Cycles in Technical Analysis
Understanding market cycle and its impact on price behavior is a powerful tool for strengthening technical analysis.
The first step in utilizing market cycles in technical analysis is identifying the different phases, which we have thoroughly discussed throughout this article. Once you’ve determined the current phase of the market cycle, you can use various techniques to optimize your entry and exit strategies for both bullish and bearish phases.
One effective method is using candlestick patterns. By recognizing these patterns at the beginning and end of rallies or declines, you can pinpoint the best entry and exit points. Candlestick patterns give clear signals that help confirm the market’s direction at specific times, increasing your chances of making profitable trades.
Another approach is incorporating indicators such as the Relative Strength Index (RSI) and Moving Average Convergence Divergence (MACD). These indicators are useful in identifying overbought or oversold conditions, which often coincide with the end of accumulation or distribution phases.
By recognizing these levels, traders can forecast potential reversals and act accordingly. For example, when the RSI reaches extreme levels, it may signal the end of a trend and the start of a new market cycle.
If you’re skilled in price action trading, combining this knowledge with an awareness of market cycles can further refine your strategy. Recognizing Order Blocks at key price levels—such as at market peaks or troughs—can be particularly useful. These areas often act as support or resistance zones, and waiting for confirmation signals (like price rejection or a break of structure) in these regions can provide high-probability entry points.
This technique is especially beneficial for traders using smart money strategies or RTM (Return to Market), as these styles focus on capturing market shifts based on institutional price movements. Short-term traders, in particular, can use market cycles to pinpoint turning points and the beginning of new phases, significantly improving their chances of success in fast-moving markets.
By integrating market cycle knowledge with time-based analysis tools and indicators, traders can develop more robust strategies for identifying profitable trade opportunities at critical market junctures.
The Impact of Time Frame on Market Cycle Detection
Time frame plays a crucial role in accurately detecting market cycles, as each timeframe provides a different perspective. Lower time frames contain a lot of noise and show small (micro) cycles that are often short-term corrections. In contrast, higher time frames clearly reveal the main market cycle. For best results, multi-timeframe analysis is recommended: use the higher timeframe to identify the overall phase, then the lower timeframe for precise entry.
For example, if the daily RSI is around 35 with average volume, but the weekly RSI is around 25, the likelihood of an accumulation phase is high—you can take a long position with low risk and expect 3-5x rewards in the upcoming markup phase.
Trading Strategies Based on Market Cycles
Market cycles not only reflect patterns in price changes, but they also serve as essential tools for designing and executing successful trading strategies. Each phase of the market cycle—Accumulation, Rally, Distribution, and Decline—presents unique opportunities and challenges for traders.
Recognizing these phases and effectively leveraging them can lead to sustained profitability. Below, we will explore a trading strategy based on market cycles and how it can be applied.
Keep in mind that strategies built on market cycles require a deep understanding of market behavior, both technical and fundamental analysis, and effective risk management.
Buy Strategy in the Accumulation Phase
As mentioned earlier, the Accumulation phase typically follows a long-term downtrend and refers to a period where prices move within a relatively stable and low-volatility range. During this phase, smart traders begin to gradually buy assets, while overall market sentiment remains mostly negative. This creates an opportunity for those with a keen eye to enter positions before the market shifts to a bullish trend.
One key indicator to watch in the Accumulation phase is increased trading volume near key support levels. When the market tests support levels multiple times without a significant price breakdown, it can signal that strong hands (institutional investors) are quietly accumulating the asset. The market’s inability to break down further indicates that the asset may be poised for a potential upward move.
Additionally, tools like the Relative Strength Index (RSI) can help identify oversold conditions. When the RSI reaches lower levels (typically below 30), it signals that an asset might be oversold and due for a reversal. This gives traders a more precise entry point during the Accumulation phase.
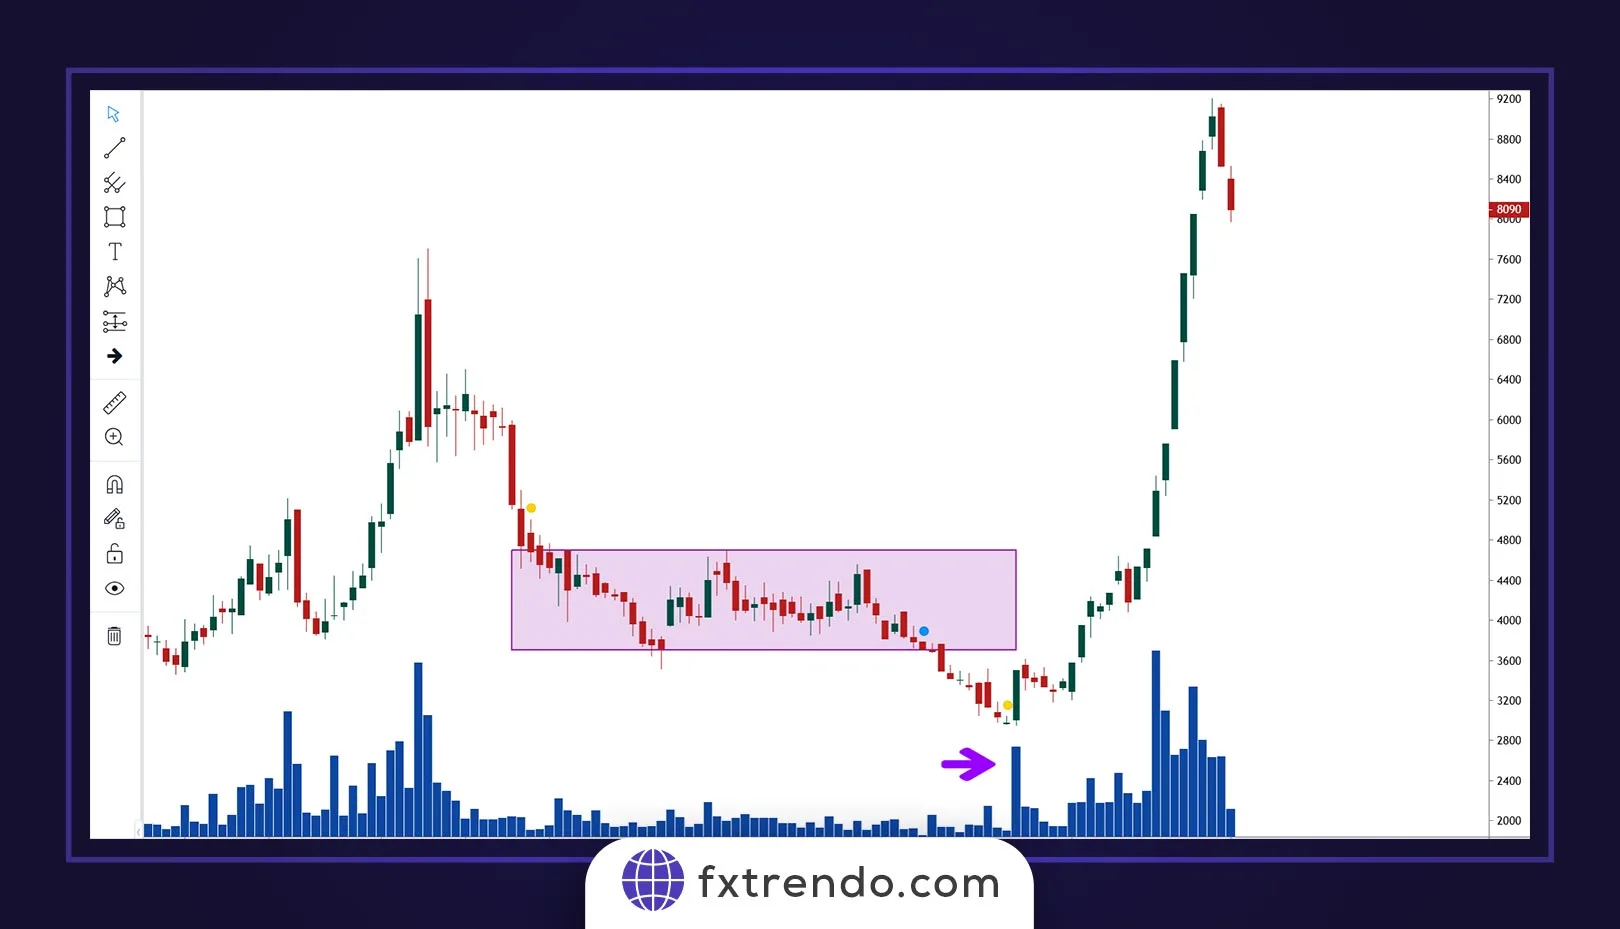
For example, as you can see in the chart below, the market has been in an accumulation phase for a long time, and after recording the last bottom, which caused concern and the exit of most novice traders, it has begun its powerful upward trend after recording a large trading volume:
Developing an Effective Market Cycle Strategy
While the Accumulation phase offers a buying opportunity, it’s essential to apply a comprehensive approach to trading strategies based on market cycles. Traders should combine insights from technical indicators, price action analysis, and fundamental analysis to confirm entry and exit points.
In addition, effective risk management should always be a priority. Using stop-loss orders, position sizing, and diversifying trades can help protect capital during volatile market phases.
By staying disciplined and leveraging the patterns of market cycles, traders can increase their chances of making profitable trades while managing risk appropriately.
Conclusion
Market cycles, consisting of phases such as Accumulation, Rally, Distribution, and Decline, play a crucial role in the financial and investment world. A deep understanding of these cycles and the role each phase plays can significantly enhance a trader’s ability to make informed investment decisions.
Equally important is risk management and accurate market analysis at every phase. Whether the market is in a period of accumulation or nearing a decline, knowing when to enter or exit positions can make a substantial difference in the profitability of trades.
Traders who take the time to understand these cycles, use them to guide their decisions, and manage their risk effectively are more likely to experience sustained success in the market.