The Supertrend indicator explained in simple terms: It’s a powerful trend-following tool that helps traders identify market direction with clear visual signals. Despite its name suggesting perfection, the Supertrend indicator is a practical technical analysis tool based on price movements and volatility—nothing magical, but highly effective when used correctly. In this comprehensive guide, we’ll dive deep into the Supertrend indicator explained, including its mechanics, how to use Supertrend effectively, trading Supertrend indicator strategies, and a realistic look at Super Trend indicator accuracy. Stay with us as we separate the myth from reality and uncover the true role of the Super Trend Indicator in modern trading.
What is the Supertrend Indicator?
The Supertrend Indicator is a popular tool in technical analysis designed to help traders identify market trends more effectively.
As its name suggests, this indicator focuses on analyzing trends and operates based on market price movements and volatility. Its primary purpose is to provide clear buy and sell signals, enabling traders to make informed decisions with greater confidence.
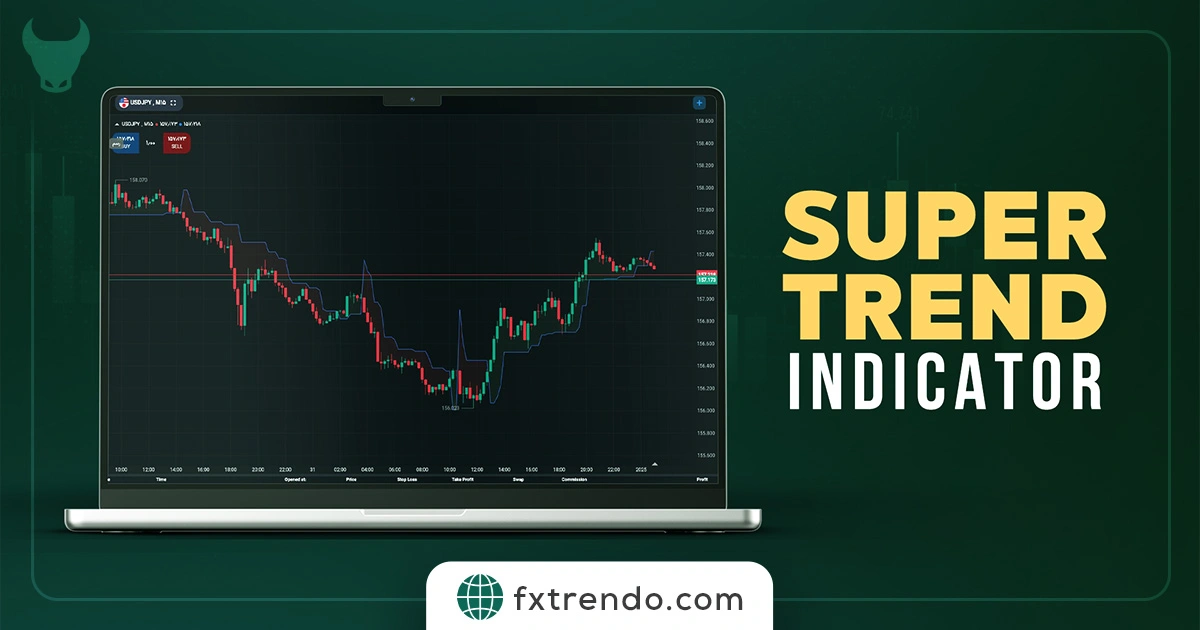
At its core, the Supertrend Indicator works by plotting a line on the price chart that shifts above or below the market price, depending on the direction of the trend.
When the price moves above the indicator line, it generates a buy signal, indicating an uptrend. Conversely, when the price falls below the line, it signals a sell, indicating a downtrend. This simplicity makes it a favorite among both novice and experienced traders.
What sets the Super trend Indicator apart is its ability to adapt to changing market conditions. By incorporating market volatility into its calculations, it minimizes false signals during periods of choppy or sideways movements. This makes it an effective tool for identifying genuine trends while reducing the risk of entering trades prematurely.
Read more: What is a Trading Strategy?
Nature and How the Super Trend Indicator Works
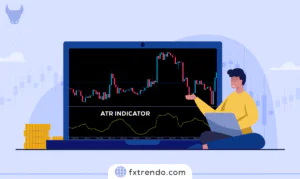
The Super Trend indicator typically operates based on the combination of the midpoint price (HL2) and the Average True Range (ATR). ATR plays a key role here, as it measures market volatility and makes the indicator sensitive to real market conditions.
Super Trend indicator calculation formula:
- First, calculate the midpoint of high and low for the period (HL2): HL2 = (High + Low) / 2
- Initial Upper Band: Upper Band = HL2 + (Multiplier × ATR)
- Initial Lower Band: Lower Band = HL2 – (Multiplier × ATR)
Then, the indicator adjusts with a “final band” mechanism to prevent unnecessary fluctuations (the final band cannot sharply reverse direction compared to the previous period).
- If the previous trend was uptrend, Super Trend follows the final lower band until the price closes below it.
- If the previous trend was downtrend, it follows the final upper band.
Role of ATR and Multiplier:
- ATR (usually period 10 or 14): Measures market volatility. Higher ATR in volatile markets increases the distance of the Super Trend line from price, reducing false signals.
- Multiplier (typically 3): Adjusts sensitivity. Higher values (e.g., 4) keep the line farther from price, producing fewer but more reliable signals; lower values (e.g., 2) make it more sensitive, generating more signals.
Simple numerical example:
Assume in a candle: High = 100, Low = 90, ATR = 5, Multiplier = 3.
- HL2 = (100 + 90)/2 = 95
- Upper Band = 95 + (3 × 5) = 110
- Lower Band = 95 – (3 × 5) = 80
If the price closes above the Super Trend line (e.g., the final lower band), the line turns green and gives a buy signal. This mechanism allows Super Trend to act as dynamic support/resistance.
In simpler terms:
- When the price is above the Super Trend line, the market trend is considered bullish, and the indicator typically gives a buy signal.
- When the price is below the Super Trend line, the trend is considered bearish, and the indicator provides a sell signal.
This tool is easy to use due to its simple structure, but understanding its exact performance and market conditions is crucial for proper application.
Advantages of Using the Supertrend Indicator in Trading
The Supertrend Indicator is widely appreciated by traders for its simplicity and practicality, making it a go-to tool for analyzing market trends. It helps traders make more confident decisions and improve their trade entry and exit points.
Let’s explore its key advantages:
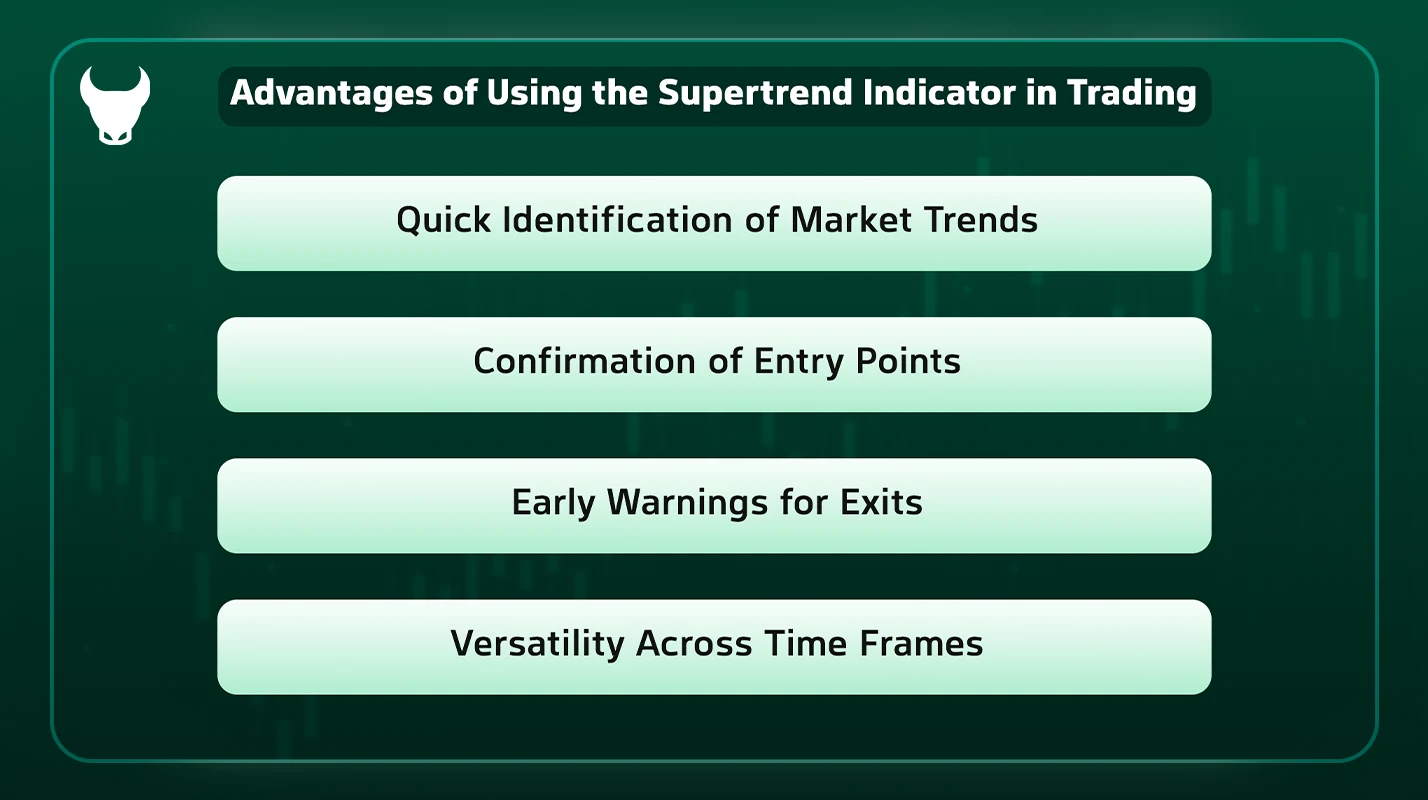
1. Quick Identification of Market Trends: The Super trend Indicator provides a clear view of the overall market trend. By observing the price’s position relative to the Supertrend line, traders can quickly determine whether the market is in an uptrend, downtrend, or a sideways phase. This high-level perspective is particularly valuable when analyzing higher time frames.
2. Confirmation of Entry Points: One of the standout features of the Super trend Indicator is its ability to validate entry points. For instance, when the price remains above the Supertrend line, it confirms the strength of an uptrend, giving traders more confidence to enter a long position.
3. Early Warnings for Exits: Exiting a trade prematurely can sometimes be necessary, especially when signs of a trend reversal emerge. The Super trend Indicator acts as a warning system, signaling traders to exit when the price drops below the indicator line. This minimizes losses and helps lock in profits.
4. Versatility Across Time Frames: This indicator can be used effectively across all time frames, from short-term intraday charts to long-term investment horizons. Its adaptability allows traders to evaluate market trends in various time intervals and adjust their strategies accordingly.
While the Super trend Indicator is a powerful tool, its accuracy improves significantly when combined with other indicators and trading strategies. By integrating it into a broader analysis framework, traders can enhance their decision-making and achieve more consistent results.
How to Use the Supertrend Indicator?
Using the Supertrend Indicator on platforms like Trendo is straightforward and beginner-friendly. You can easily add it to your chart and start analyzing market trends in just a few steps.
Here’s a simple guide to get you started:
1. Log in to the Trendo Trading Platform: Begin by logging into your Trendo account. Once logged in, select the chart of the financial instrument you wish to analyze.
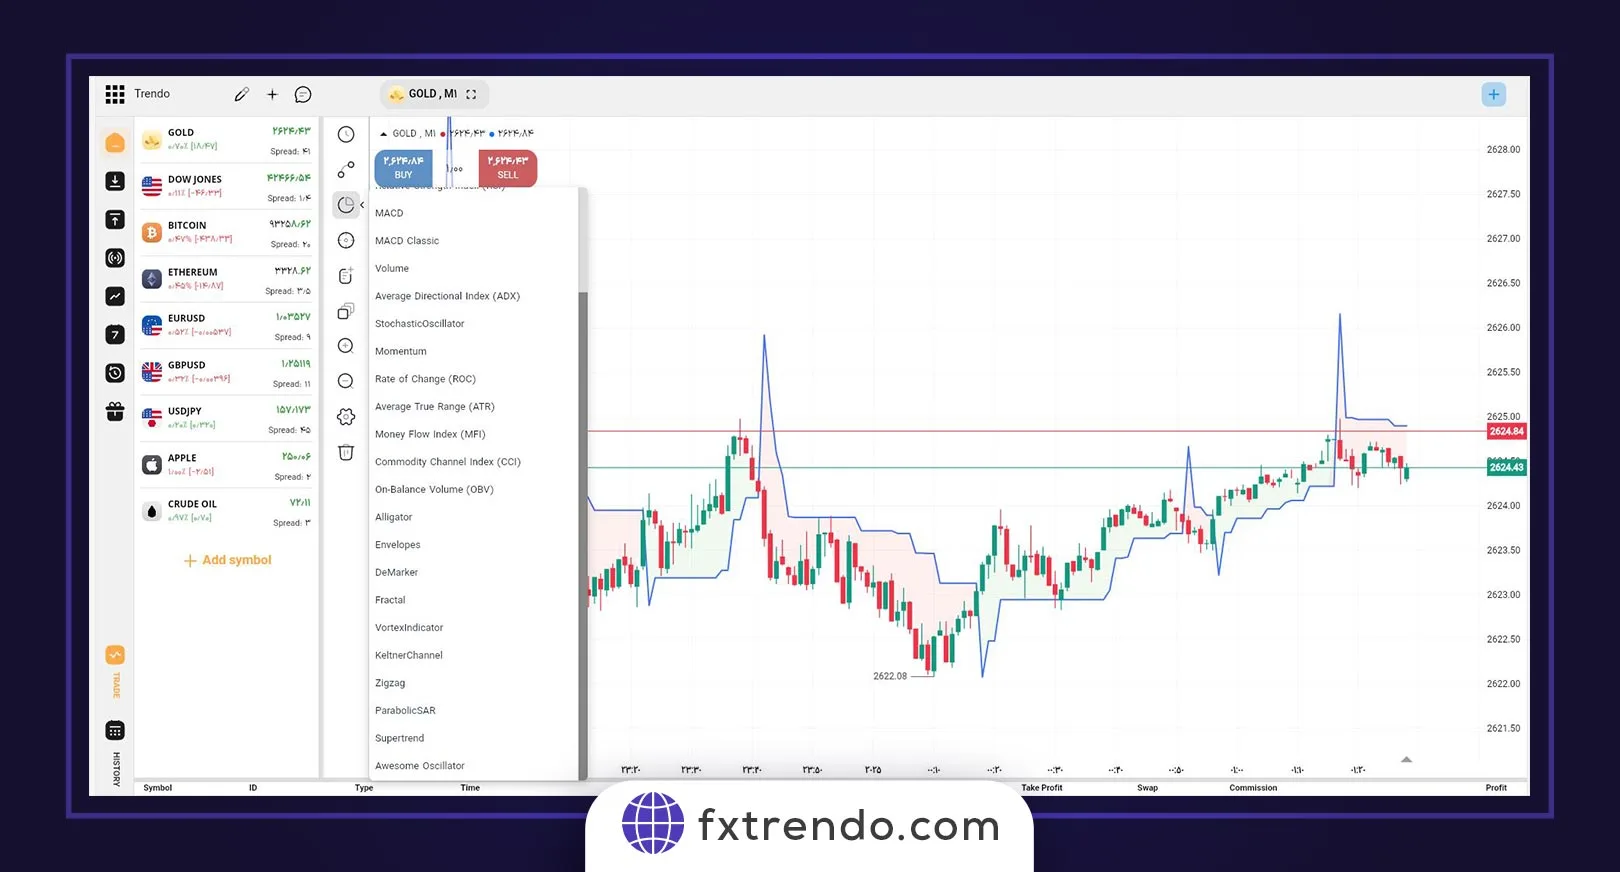
2. Access the Indicators Menu: On the left-hand side of the platform interface, locate and click on the “Indicators” section. This menu includes a wide range of commonly used technical tools for analysis.
3. Add the Supertrend Indicator: From the list of available indicators, find and select “Supertrend.” After clicking on it, the indicator will automatically appear on your chart. There’s no need to manually adjust the default settings, as the standard configuration is ready for immediate use.
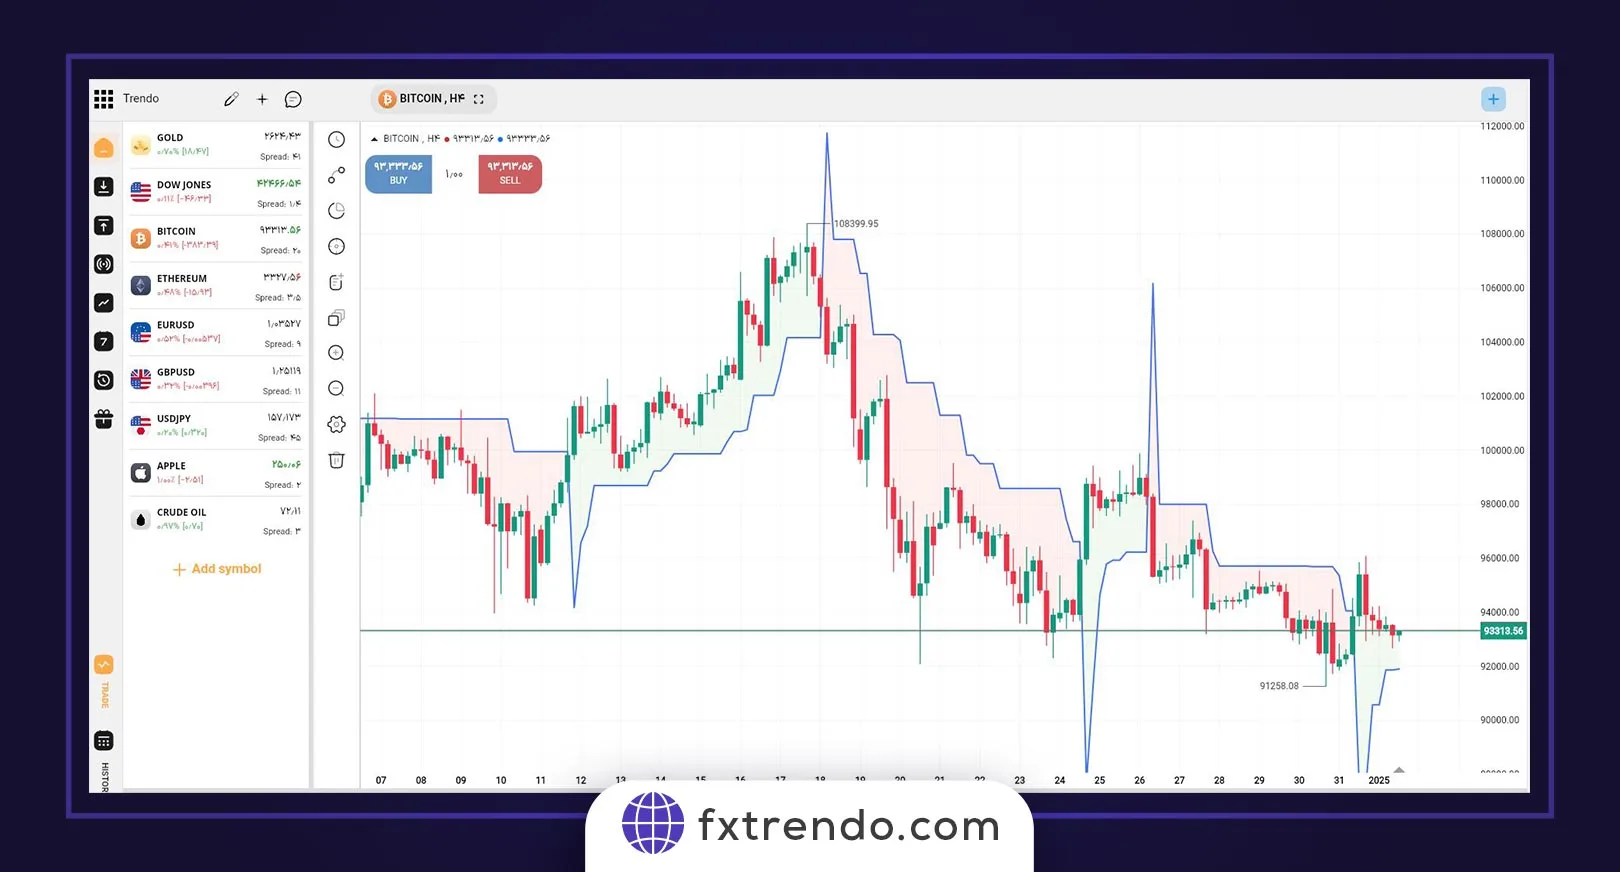
4. Analyze the Chart with the Supertrend Indicator: Once the indicator is applied, its lines will display directly on the chart, helping you identify market trends:
- If the price is above the Supertrend line, it signals an uptrend.
- If the price is below the Supertrend line, it indicates a downtrend.
The Supertrend Indicator’s simplicity and automation make it an excellent tool for quick trend analysis. By leveraging platforms like Trendo, you can efficiently utilize this indicator without any technical complexities, giving you a reliable edge in your trading strategy.
Can You Trade with Just the Supertrend Indicator?
Some traders might believe that the Supertrend Indicator alone can fulfill all their analytical needs and guide every trading decision. However, the reality is that no single indicator can replace a well-rounded and comprehensive trading strategy.
While the Supertrend Indicator is a reliable tool for identifying trends and generating entry and exit signals, it is based on historical market data and lacks the ability to account for real-time factors like news events or key market levels.
Relying solely on the Supertrend Indicator may not yield consistent results in the long term. Instead, it’s better to view it as a complementary tool that enhances your overall trading approach.
For instance, you can use it to confirm entry and exit signals provided by your primary strategy. When paired with other analytical methods, such as price action or additional indicators, the Supertrend Indicator becomes far more effective in improving trade accuracy.
Ultimately, success in trading requires a smart combination of tools and a comprehensive understanding of market conditions.
By integrating the Supertrend Indicator into a broader strategy, you can enhance your decision-making and create a more robust approach to trading.
Best Ways to Use the Supertrend Indicator
The Supertrend Indicator can yield impressive results when used as a confirmation tool in your trading strategy. However, relying on it solely, or even in combination with other indicators, does not guarantee success.
The key to optimizing this tool’s potential lies in integrating it with your unique trading setup and using it to confirm trading signals.
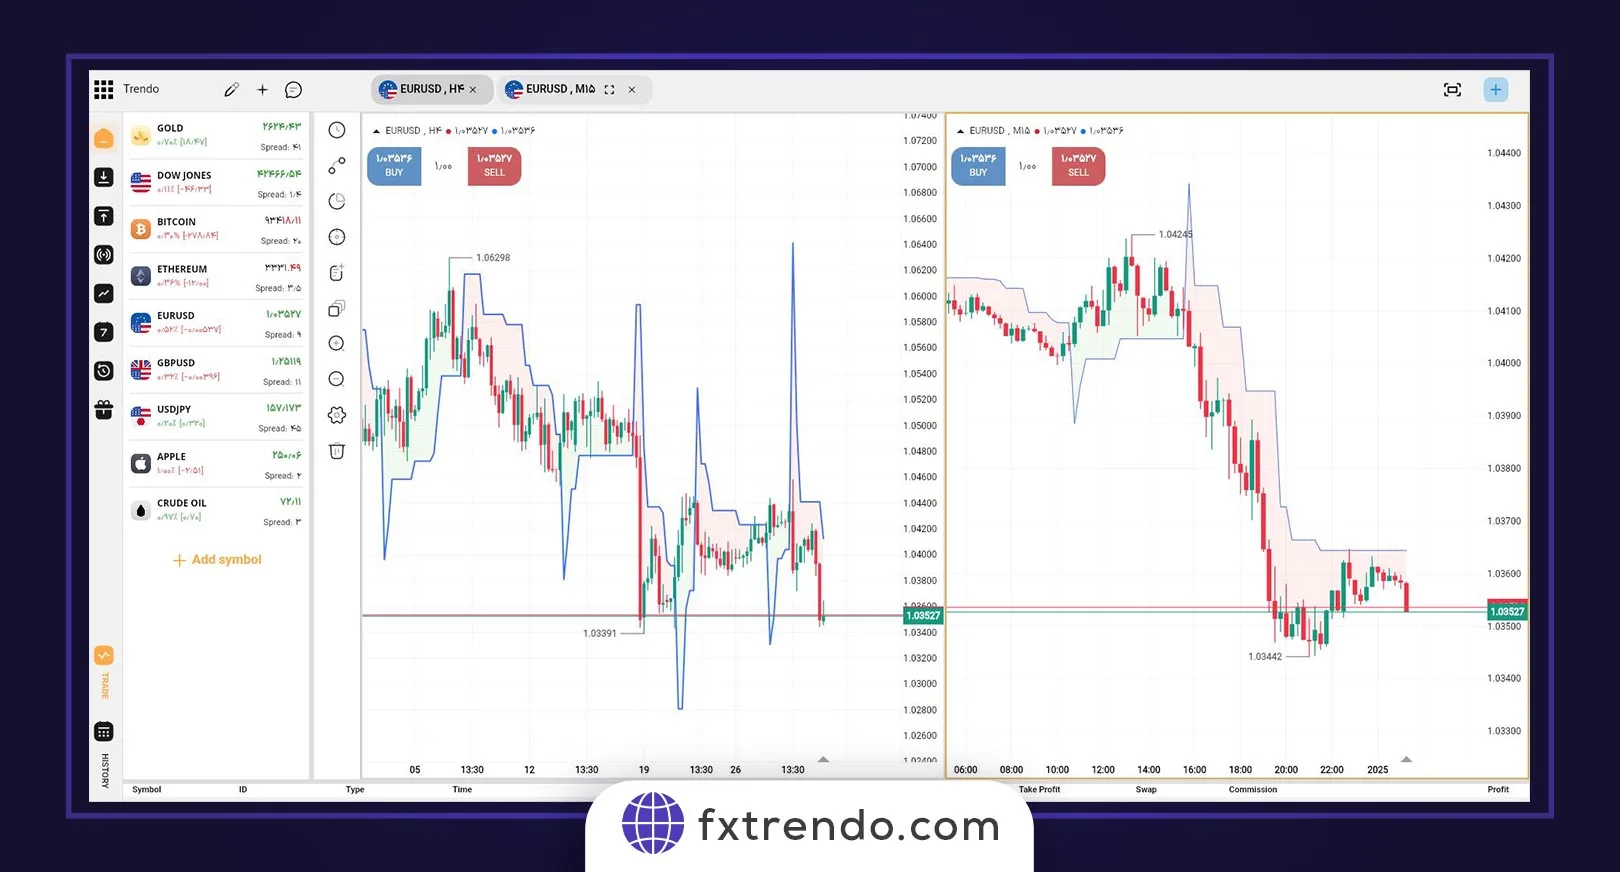
For example, let’s say your strategy generates a buy signal on a 4-hour time frame. Before entering the trade, you can check a lower time frame, such as the 1-hour chart, to verify the Supertrend Indicator’s position. If the indicator also confirms the signal on the smaller time frame, you can enter the trade with greater confidence. This layered approach ensures that you make trading decisions based on multiple confirmations, rather than relying on a single signal.
Read more: What are the best time frames for trading in forex?
The Supertrend Indicator also plays a crucial role in managing trade exits. For instance, if the price drops below the Supertrend line during a trade, it signals a change in trend and indicates that it might be time to exit the position.
Using the Supertrend Indicator as a risk management tool helps you avoid unnecessary losses by providing early warning signs of trend reversals.
The best way to use the Supertrend Indicator is to view it as a part of a broader, comprehensive strategy, not as the primary tool. It will have the most significant impact when combined with thorough market analysis, professional risk management, and a deep understanding of your personal trading strategy.
Remember, success in trading comes from the smart combination of tools and making well-informed decisions based on multiple layers of confirmation.
Read more: What is the Risk-Reward Ratio?
Best Supertrend Indicator Settings for Different Trading Styles
The default Supertrend settings (ATR period 10 and Multiplier 3) work well in many market conditions. However, depending on your trading style, these parameters can be optimized for better performance.
Scalping
For very low timeframes (1–5 minutes), use more sensitive settings such as ATR 7–10 and Multiplier 1.5–2.
These settings generate faster signals to capture small price fluctuations, but they also increase the risk of false signals.
Day Trading
An ATR of 10 and Multiplier of 2–3 on 15-minute to 1-hour timeframes is suitable.
This configuration offers a good balance between sensitivity and noise filtering.
Swing Trading
Use ATR 10–14 and Multiplier 3–4 on 4-hour or daily timeframes.
This setup produces fewer but more reliable signals, helping traders capture medium-term trends.
Position Trading (Long-Term)
For long-term trading, apply ATR 14–20 and Multiplier 4–5 on daily or weekly charts.
Keeping the Supertrend line further away from price filters out short-term noise and helps maintain larger trends.
Always customize your settings based on the asset being traded (e.g., volatile Forex pairs versus stable stocks) and perform personal backtesting.
Weaknesses of the Supertrend Indicator and How to Identify False Signals
Supertrend performs exceptionally well in trending markets, but it has some limitations:
-
False signals in sideways (range-bound) markets:
When price moves without a clear trend, the Supertrend line frequently changes color, causing whipsaws and consecutive small losses. -
Lagging nature:
As a trend-following indicator, signals appear after the move has already started, meaning part of the initial profit is often missed. -
Sensitivity to settings:
A low Multiplier produces many (often false) signals, while a high Multiplier reduces signals and may cause missed opportunities.
How to Avoid False Signals
To improve accuracy and filter bad trades:
-
Use confirmation indicators such as:
-
ADX (above 25 to confirm a strong trend)
-
RSI (avoid entries in overbought or oversold zones)
-
-
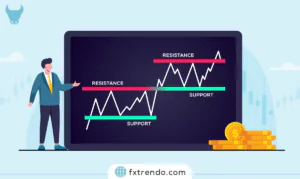
Avoid using Supertrend alone in ranging markets, or combine it with support and resistance levels.
-
Apply multi-timeframe analysis and only take signals that align with the higher-timeframe trend.
Combining Trading Strategies with the Supertrend Indicator
While Supertrend is a powerful trend-identification tool on its own, combining it with other indicators and analytical methods significantly improves signal accuracy and reduces trading risk. Below are three popular and practical strategies.
1. Supertrend Breakout Strategy
This strategy focuses on strong breakouts of the Supertrend line and is ideal for powerful trending markets, such as those driven by major news or key level breakouts.
-
Buy Signal:
Price breaks above the red Supertrend line with a strong candle (preferably with high volume), and the line turns green. -
Sell Signal:
Price breaks below the green Supertrend line, and the line turns red. -
Advantage:
Earlier entries into strong trends and the potential for larger profits.
2. Supertrend Pullback Strategy
One of the most conservative and popular approaches. Instead of chasing the start of a trend, you wait for a pullback and enter with lower risk.
-
Buy Signal:
In an uptrend (green line), wait for price to pull back toward the Supertrend line and find support near it (e.g., a bullish reversal candle). -
Sell Signal:
In a downtrend (red line), wait for a pullback to the line followed by a bearish reversal candle. -
Advantage:
High win rate and low-risk entry points.
3. EMA Crossover Strategy
This combined strategy pairs Supertrend with an exponential moving average crossover and is one of the best methods for filtering false signals.
Suggested settings:
-
Short EMA: 8 or 10
-
Long EMA: 20 or 50
-
Supertrend: Default (10, 3)
-
Buy Signal:
-
Supertrend turns green (uptrend confirmed)
-
Short EMA crosses above the long EMA (Golden Cross)
-
-
Sell Signal:
-
Supertrend turns red
-
Short EMA crosses below the long EMA (Death Cross)
-
-
Advantage:
Significant reduction of whipsaws in ranging markets and multi-layer trend confirmation.
Important Note: No strategy is 100% accurate. Always backtest on a demo account and apply proper risk management (maximum 1–2% risk per trade). Combining Supertrend with price action or volume indicators (such as Volume or OBV) can help you build more personalized and robust strategies.
Conclusion
The Supertrend indicator is one of the most powerful and popular tools in technical analysis. By combining ATR with a multiplier, it identifies market trends in a simple and visually clear way. Beyond providing buy and sell signals, Supertrend also acts as a dynamic support and resistance level and an effective risk-management tool.
With the right settings, it can be optimized for different trading styles. Although it generates false signals in ranging markets, combining it with strategies such as Pullback, Breakout, or EMA Crossover dramatically improves accuracy and profitability.
Ultimately, the Supertrend indicator is an essential tool for traders who aim to identify strong trends while maintaining controlled risk.