Support and resistance levels are the foundation of technical analysis. These key price zones show where buyers and sellers have historically clashed, often causing the price to reverse, pause, or accelerate.
Support forms when buying pressure overcomes selling pressure in a downtrend. Resistance forms when selling pressure overcomes buying pressure in an uptrend. Mastering to draw support and resistance gives you clear, high-probability areas for entries, exits, and stop placement.
Support and resistance area types
Support and resistance areas are divided into the following two categories based on whether they are a fixed price range or variable areas:
- Static support and resistance areas
- Dynamic support and resistance areas
Based on the trading time frame and whether the market is in a trading range or trend, the use of each is different, which we will explain in detail.
For reading more about the basics of support/resistance levels, click here.
How to Draw Support and Resistance Levels Correctly
Mastering how to draw support and resistance is fundamental for consistent trading results. Support and resistance levels represent key price zones where the battle between buyers and sellers often leads to reversals, pauses, or breakouts. Below is a practical guide on how to draw support and resistance lines you can apply immediately on your charts.
Horizontal Support and Resistance
Start on the 4H or daily timeframe. Scan for clear areas where price has reversed strongly multiple times. To draw resistance and support lines, connect at least two (ideally three) swing lows for support or swing highs for resistance. Focus on the bodies of the candles rather than just the wicks for cleaner levels. Stronger levels have more touches from both sides.
Static resistance and support lines
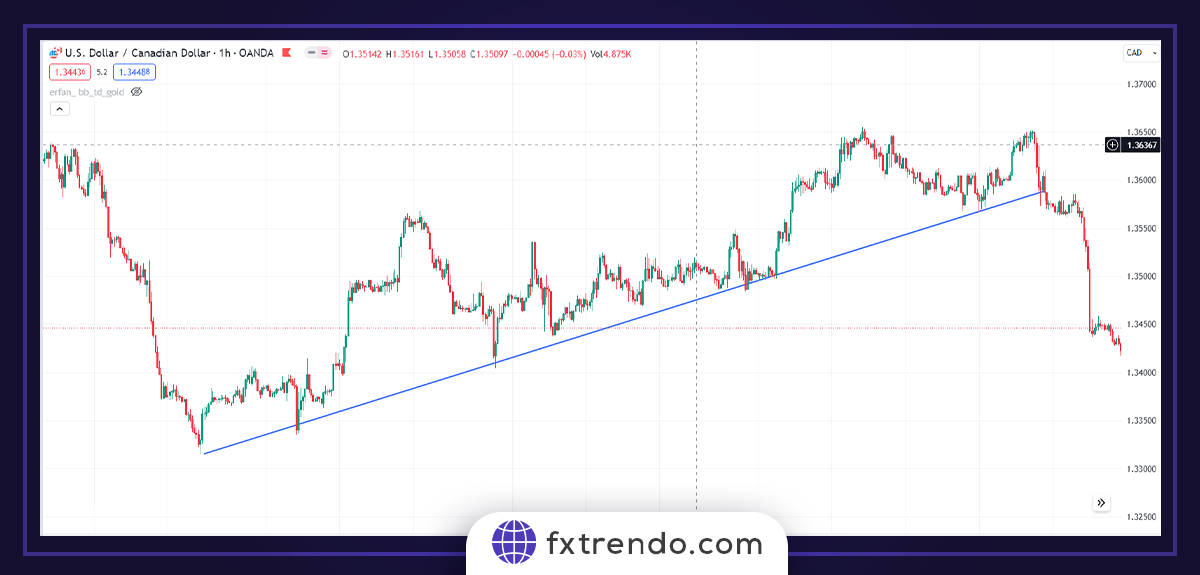
Trendline Support and Resistance
Trendlines are essential in trending markets. For an uptrend, use the line tool to connect two or more higher swing lows to form rising resistance and support lines. In a downtrend, connect lower swing highs. Adjust the line so it touches as many price points as possible without cutting excessively through candles. These dynamic drawing resistance and support lines work best when the trend is clear.
Dynamic Levels (Moving Averages)
Add the 50-period and 200-period Exponential Moving Averages (EMA) to your chart. These act as support and resistance levels that move with price. During uptrends, price frequently bounces from the rising MA as support. In downtrends, the falling MA acts as resistance. This is one of the easiest ways to identify dynamic support and resistance. This type of support and resistance is less valid than the static type, and its drawing way can differ from another trader based on each trader’s experience and personal strategy.
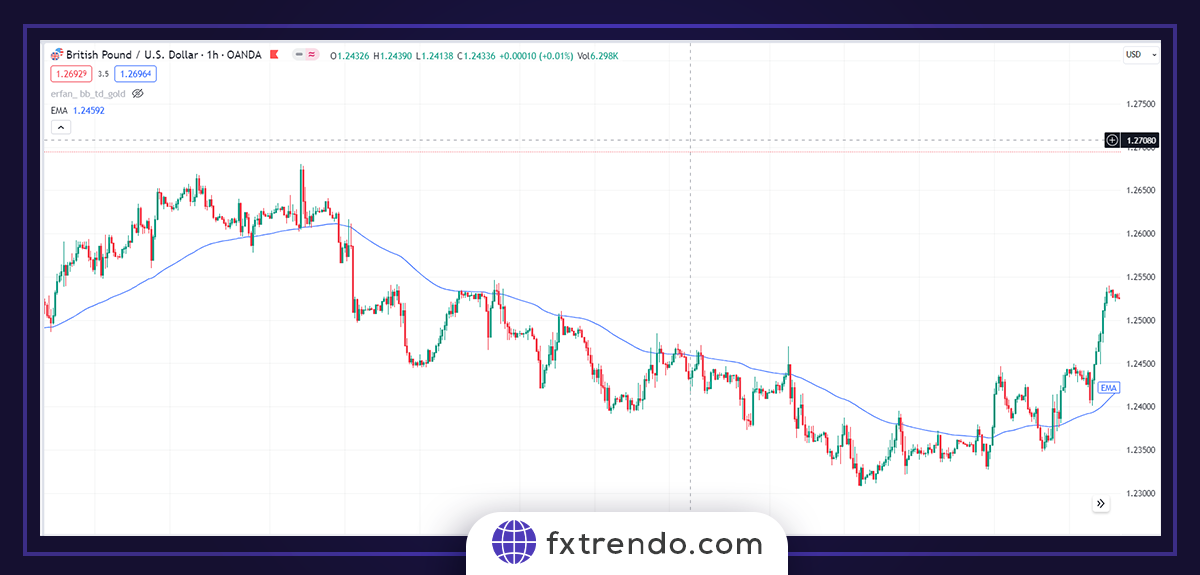
Using Moving averages can help identify support and resistance areas. If the price is higher than the MA, it plays the role of support, and if the price is lower, the MA plays the resistance role.
Read More: Moving average indicator
Round Numbers and Psychological Levels
Manually mark major round numbers such as 1.2500, 100.00 or 50,000. These psychological support and resistance levels attract significant order flow and often cause strong reactions. Always respect round numbers when how to draw support and resistance lines on any asset.
Using Swing Highs and Swing Lows
Identify swing highs (a high with lower highs on both left and right) and swing lows (a low with higher lows around it). Connect recent significant swings to draw support and resistance lines. This method gives you the most accurate and high-probability support and resistance levels. Always check higher timeframes for confirmation.
Practice how to draw resistance and support lines daily on different pairs and timeframes until it becomes second nature.
Support and Resistance in Different Timeframes
Understanding support and resistance across multiple timeframes is crucial for high-probability trading. How to draw resistance and support lines changes depending on the timeframe you analyze, as each offers different insights into market behavior.
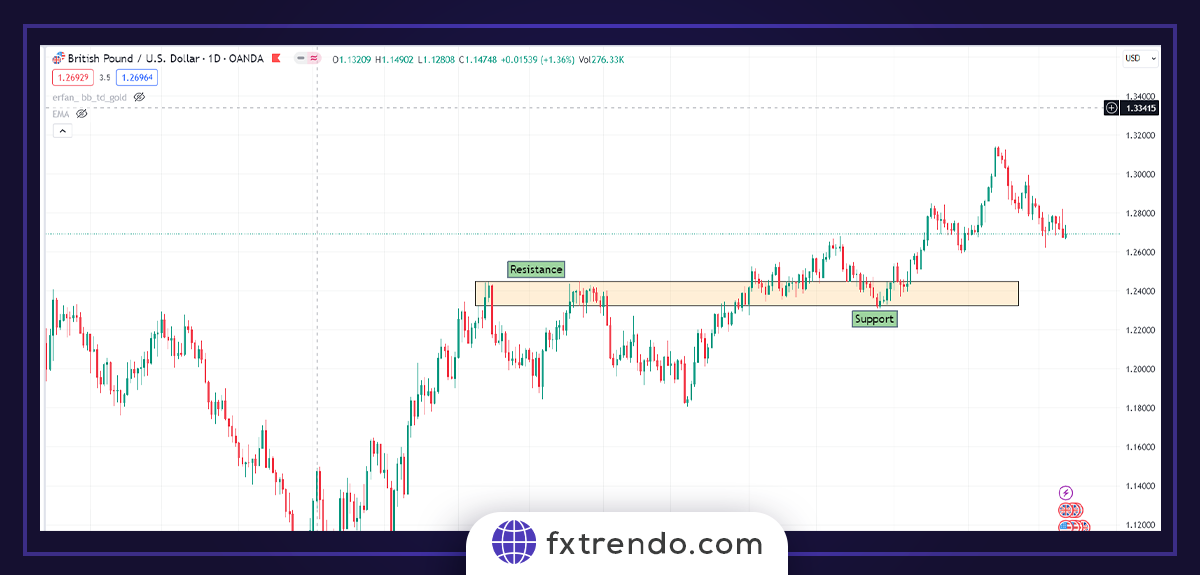
S/R on Higher Timeframes (Daily/Weekly)
Higher timeframes like Daily and Weekly charts produce the strongest support and resistance levels. These levels are respected by institutions and large players. To draw support and resistance lines here, connect major swing highs and swing lows that have been tested multiple times. These zones often act as major reversal points and should be your primary reference.
S/R on Lower Timeframes (H1/M15)
On H1 and M15 charts, support and resistance levels are more frequent but weaker and noisier. Use them mainly for precise trade entries and exits. When drawing support and resistance lines on lower timeframes, focus on recent price action and respect the direction of the higher timeframe trend.
Multi-Timeframe S/R Confirmation
The most powerful approach is multi-timeframe confirmation. First, draw support and resistance levels on the daily chart to identify major zones. Then drop to H1 or M15 to find precise entry points near those levels. When lower timeframe support and resistance levels align with higher timeframe zones, your trade probability increases significantly.
Support and Resistance Strategies for Trading
The real trading edge comes when you combine support and resistance levels with clear, repeatable strategies. Here are five practical approaches you can start applying today.
S/R with Candlestick Patterns
- Mark your key support or resistance level on the chart.
- Wait for price to reach the zone.
- Look for a strong reversal candle: bullish hammer, pin bar or engulfing at support → buy on close. Shooting star, bearish pin bar or engulfing at resistance → sell on close.
- Place stop-loss 5-15 pips beyond the level and target the next major opposite level.
This gives you precise entry timing and filters out weak signals.
S/R and Fibonacci Confluence
Draw a Fibonacci retracement from the most recent major swing high to swing low (or low to high). The strongest zones form where the 50% or 61.8% Fib level lines up exactly with your horizontal support or resistance. When price tests this confluence area, wait for a clear reaction candle, then enter. Confluence setups deliver cleaner moves and higher win rates than single levels alone.
S/R with Volume Confirmation
Always check the volume bars when price approaches a level. At support, look for rising volume on the bullish reversal candle — this shows real buying interest. At resistance, high volume on bearish rejection confirms sellers are in control. Skip any level where volume is low or average — those reactions usually fail quickly. Volume is your best filter for institutional-grade setups.
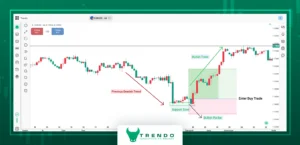
Breakout Pullback Strategy
- Wait for a decisive close beyond resistance (or below support).
- Do not chase — wait for price to pull back and retest the broken level.
- The old resistance now becomes new support (or old support becomes new resistance).
- Enter in the breakout direction on the first strong candle at the retest.
- Stop-loss just beyond the retest extreme; target next major level or 1:2 risk-reward.
This strategy catches strong trends with excellent risk-reward.
Scalping Using Support and Resistance
Switch to M5 or M15 charts during London or New York sessions. Mark minor support and resistance from the last 20-40 candles. Take quick bounces: buy at support or sell at resistance on the first or second touch. Use tight stops (5-12 pips) and aim for 1:1.5 to 1:2 targets. Exit fast if momentum fades. Ideal for ranging or mildly trending sessions.
Practice these setups on demo first, then go live with proper position sizing.
Tools to Help Identify Support and Resistance
While manual drawing is the foundation, the right tools make identifying and marking support and resistance much faster and more accurate. Here are the most useful ones professional traders rely on every day.
Drawing Tools
Focus only on these three essential built-in tools:
- Horizontal Line Tool: The tool for static levels. Click once at a clear swing low for support or swing high for resistance, then extend the line across the chart. Add alerts so you never miss a test.
- Trendline Tool: Perfect for dynamic support and resistance. In uptrends, connect two or more higher swing lows; in downtrends, connect lower swing highs. Adjust so the line touches price cleanly without cutting through candles.
- Channels: Show price movement within parallel boundaries, useful for range and trend trading.
- Rectangle Tool: Use this to mark support and resistance as zones rather than thin lines. Draw from the wick extremes of reversal candles to highlight the entire area where price is likely to react.
Master these tools to analyze any chart professionally.
Indicators (Pivot Levels, S/R Zones)
Indicators automatically calculate support and resistance levels based on price data, saving time and reducing subjective bias. They are ideal for traders who prefer rule-based analysis.
- Pivot Point Indicators: Automatically plot daily, weekly or monthly central pivot plus R1-R3 resistance and S1-S3 support levels. These objective levels work especially well for day trading and often act as magnets for price.
- Support & Resistance Zone Indicators: These create shaded boxes around high-probability areas based on recent swings. They save time and clearly show where the real battles take place.
Automated S/R Detection Tools
Automated support and resistance detection tools use algorithms and artificial intelligence to scan charts and identify key price levels in real time. These tools are increasingly popular among active and algorithmic traders.
The typical use cases of these tools are for scalping and high-frequency trading, monitoring multiple markets simultaneously, and supporting automated or semi-automated strategies
Best practice: Use automated tools to spot candidates fast, but always verify with manual drawing and higher-timeframe confirmation before you trade.
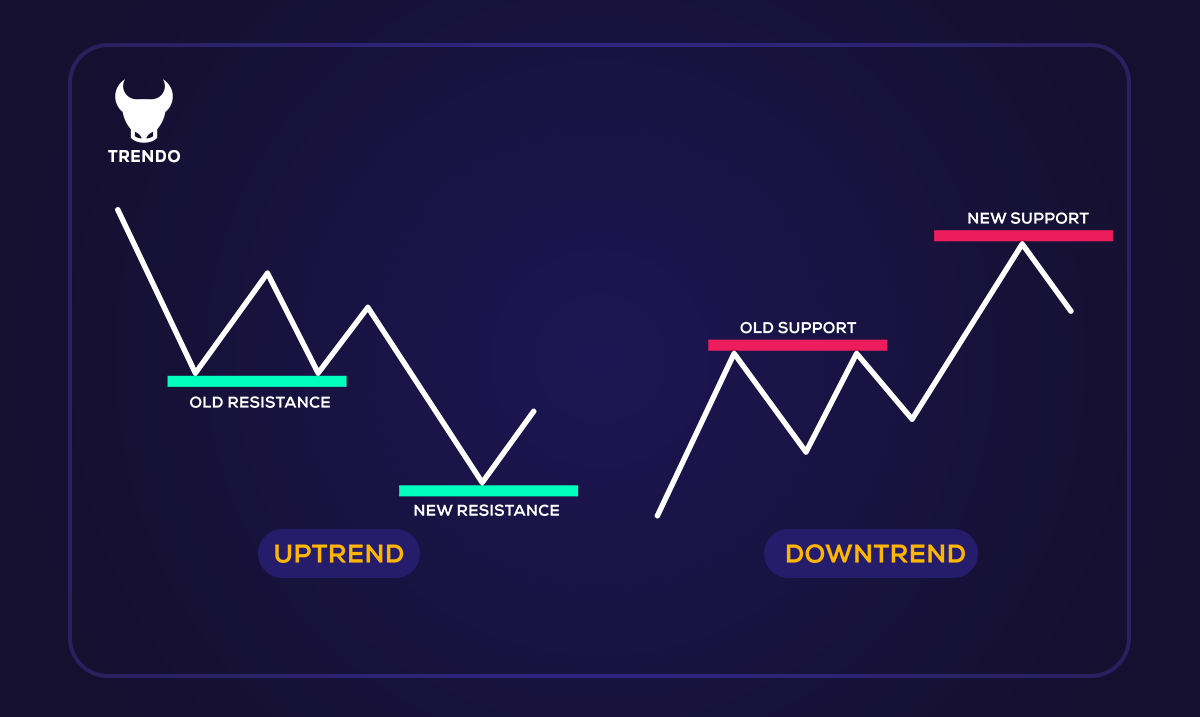
Role Reversal: When Support Becomes Resistance (and Vice Versa)
One of the most reliable signals occurs when support and resistance levels change character.
When price breaks and closes strongly above a resistance level, that level often flips to new support on any pullback. Likewise, a broken support frequently becomes new resistance when price returns from below.
Always wait for a clear retest of the flipped level before entering. A strong candle rejection at the new support (old resistance) confirms the role reversal and gives you a high-probability continuation trade in the direction of the breakout.
Conclusion
Support and resistance trading delivers the best results when you combine accurate drawing methods, multi-timeframe confirmation, and proven strategies with strict risk management. Never rely on these levels alone — always use stop-losses and proper position sizing.
Start applying these techniques today on a demo account. With consistent practice, drawing support and resistance indicators and trading them confidently will become one of your strongest trading skills.