


As of October 21, 2025, the gold price (XAUUSD) is fluctuating within the $4,315 – $4,360 range. Market analysis indicates that after a significant recent rally, gold has entered a temporary consolidation phase. However, the medium-term outlook remains bullish. In this report, the Trendo broker’s educational team provides a combined technical and fundamental analysis of the gold market to deliver a clearer picture of current conditions and potential future trends.
You can also visit the Trendo platform and take advantage of its advanced trading tools and features to perform your own analyses with greater precision and confidence.
Gold Price Action and Trend Overview
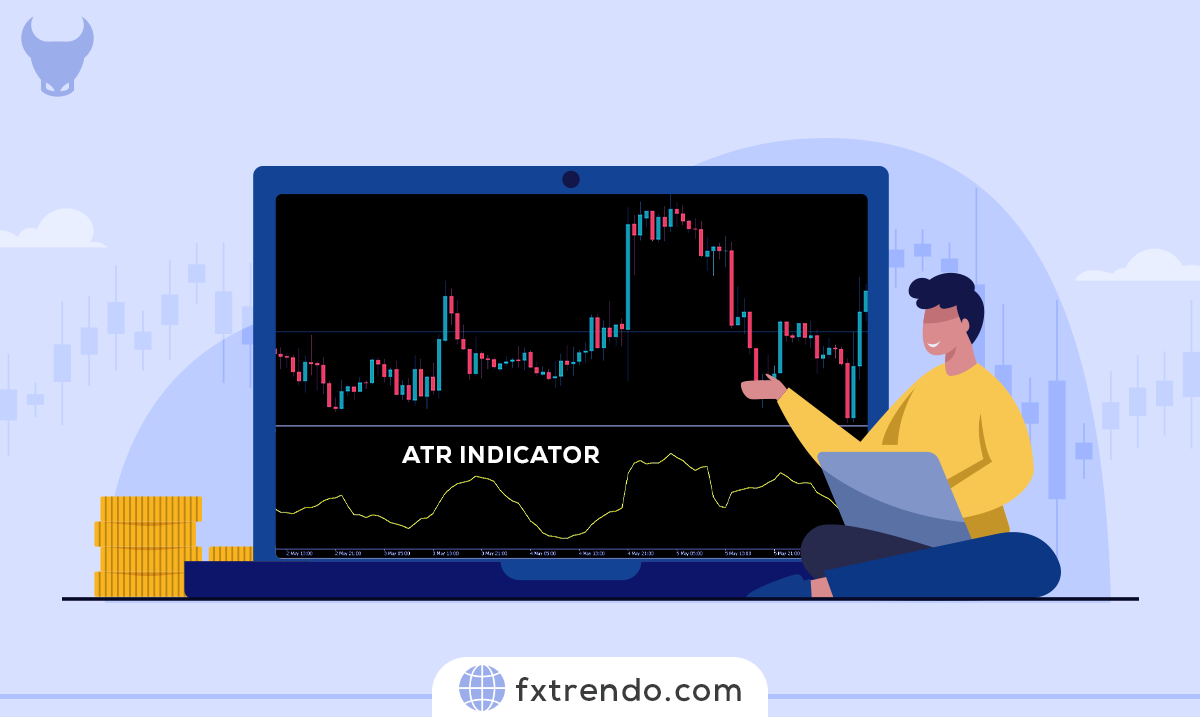
At present, the spot gold price per ounce is showing signs of slowing bullish momentum after testing the $4,378 resistance level. The 200-period Simple Moving Average (SMA-200) on the H1 timeframe is positioned around $4,161, continuing to act as the main support for the uptrend. As long as the price remains stable above this level, the overall market structure is considered bullish.
The Relative Strength Index (RSI) is currently hovering around 50, suggesting the possibility of a minor corrective move before the continuation of the upward trend. Meanwhile, trading volume increased by approximately 15% over the past week, signaling rising demand and strong buyer participation near key support zones.

Gold Technical Analysis on Trendo Platform – H1 Timeframe
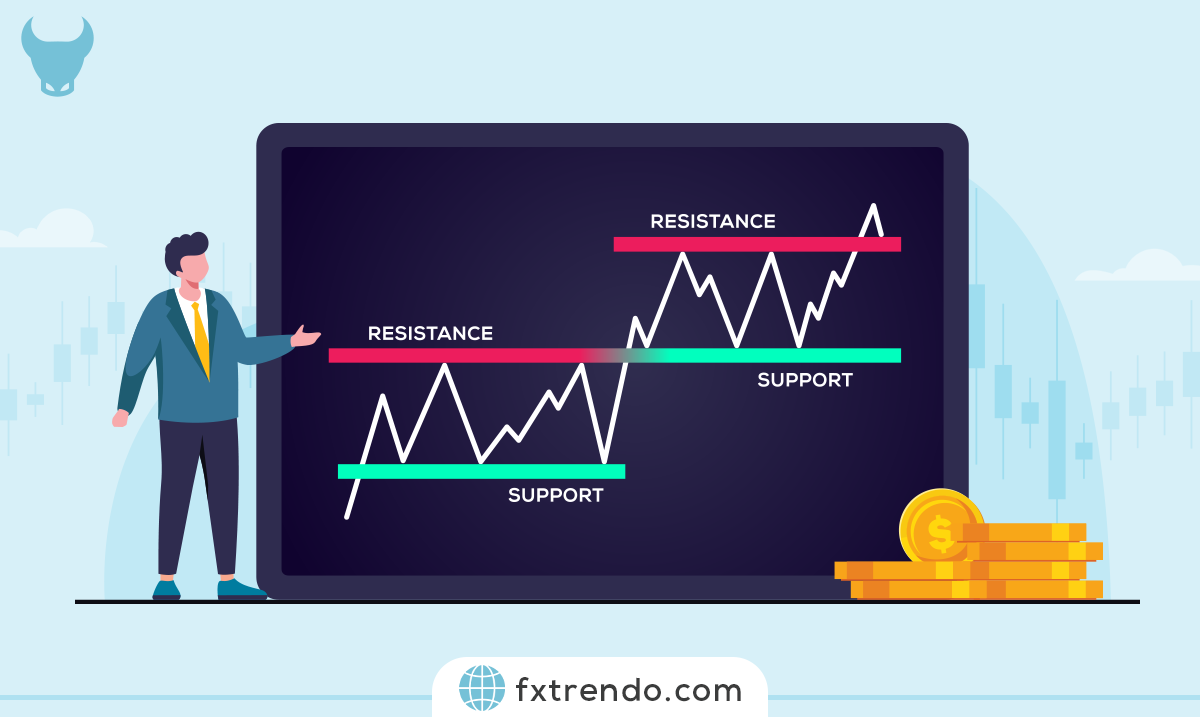
Key Support and Resistance Levels for Gold (October 21, 2025)
- Resistance: 4378
- Supports: 4194 and 4126
Trading based solely on support and resistance levels requires additional confirmations from complementary tools such as price patterns, volume analysis, technical indicators, and candlestick formations near these zones. Only when multiple signals align can traders enter the market with greater confidence and reduced risk exposure.
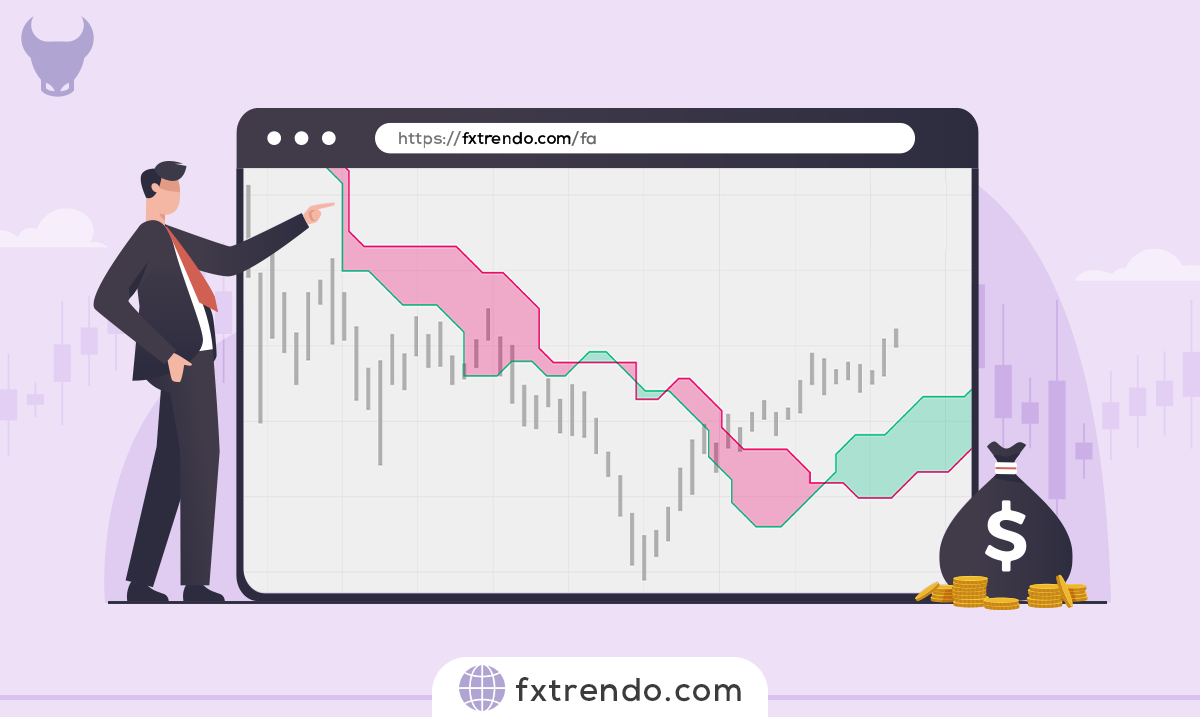
Fundamental Analysis of Gold (October 21, 2025)
From a fundamental perspective, the U.S. Dollar Index shows signs of moderate weakening, which directly provides upward momentum for gold prices.
According to a report from HSBC Bank, the average projected gold price for 2025 is around $3,350, while for 2026 it is estimated to reach approximately $4,700—reflecting continued bullish expectations in the medium term.
Additionally, increased demand from central banks and declining U.S. Treasury yields remain key supportive factors for gold’s strength. Conversely, traders are awaiting the release of new U.S. economic data, including the Purchasing Managers’ Index (PMI) and unemployment rate, as these indicators will provide insight into the Federal Reserve’s future monetary policy path, potentially shaping the next directional move in gold prices.
Gold Trading Scenarios and Outlook
1) Primary Scenario (Bullish):
If the price holds above $4,330, the upward move may extend toward $4,375 and subsequently $4,465. Many analysts’ strategy under such conditions is to buy on pullbacks and confirm stability above the 200-period moving average.
2) Alternative Scenario (Temporary Bearish):
If gold loses the $4,194 support, a deeper correction toward the $4,090 – $4,060 area may occur.
Conclusion
As of October 21, 2025, gold remains in a price consolidation phase, yet the overall market sentiment continues to be bullish. Strong supports around $4,194 and $4,126, combined with persistent institutional demand, increase the likelihood of a medium-term upward continuation. To trade with the lowest spreads and commissions, visit the comprehensive Trendo platform, where you can experience optimal trading conditions using advanced technical and fundamental analysis tools.
Disclaimer:
This analysis is provided solely for educational and informational purposes and should not be considered financial advice or a recommendation to buy or sell any asset.
Download the Trendo Platform and Trade with the Lowest Spread and Commission