
Curious about what is a doji candlestick and how it can improve your market timing? This article breaks it all down: the complete definition, different types, how to identify doji candlestick pattern, how to read doji candlestick, and actionable strategies you can use right away.
Want to put your knowledge to work? Open a free Trendo demo account and practice reading doji patterns on live charts, with zero risk and full market access.
What is a doji candlestick?
A doji candlestick is a price formation that appears when an asset’s opening and closing prices are virtually identical within a given time period. The result is a candle with a very small or nonexistent body, flanked by upper and lower wicks (also called shadows) of varying lengths. The word “doji” comes from Japanese and loosely translates to “the same thing,” which perfectly captures its defining characteristic. If you are searching for what is doji candlestick is, the answer is simple: it represents a moment of balance between buyers and sellers.
Understanding what is a doji candlestick pattern requires looking at it not just visually, but structurally. Unlike a bullish engulfing or a shooting star, the doji doesn’t push decisively in any direction. Instead, it reflects a moment when buyers and sellers reach a temporary stalemate.
What Does a Doji Candlestick Mean in Trading?
What does a doji candlestick means depends heavily on context. In isolation, it signals indecision. When buyers and sellers are equally matched throughout a trading session, neither side gains the upper hand, and the price closes nearly where it opened.
But that indecision itself carries meaning. Markets rarely pause for no reason. A doji appearing after a prolonged uptrend or downtrend often indicates that the momentum driving that trend is fading. It doesn’t guarantee a reversal, but it raises a yellow flag worth noticing.
Anatomy of a Doji Candlestick (Open, Close, Wicks)
To understand what a doji candlestick is, picture a plus sign or a cross. The anatomy includes:
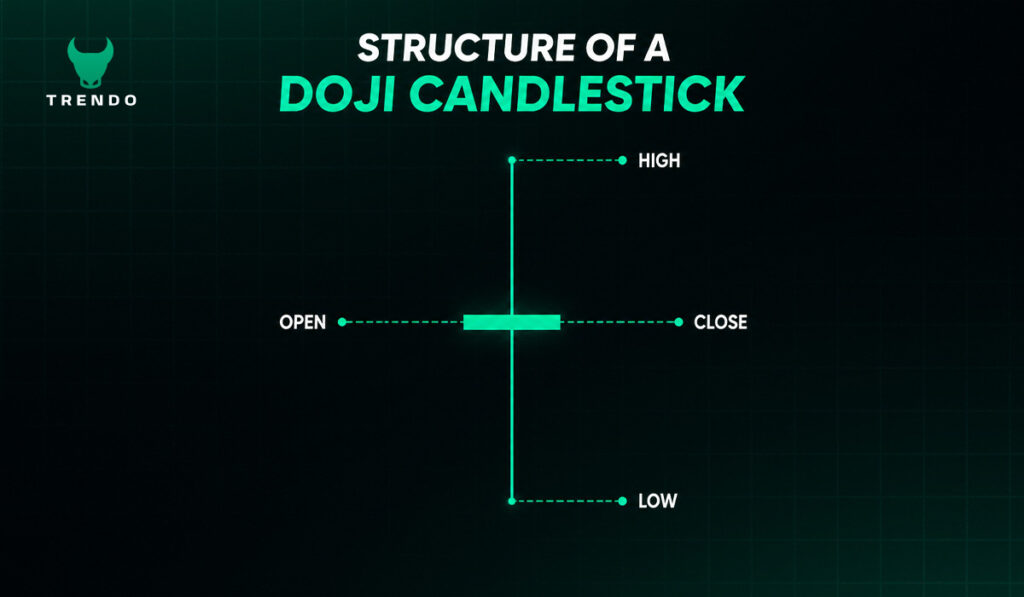
- Body: The thin rectangle (or horizontal line) between the open and close prices. In a doji, this is minimal or invisible.
- Upper wick: The line extending above the body to the session’s high price.
- Lower wick: The line extending below the body to the session’s low price.
The relationship between the body and the wicks — and how long each wick is — determines the type of doji and its implication. A doji with very long wicks suggests extreme volatility during the session before the price snapped back. A doji with almost no wicks suggests a narrow, flat trading range. Mastering the anatomy is essential when learning how to identify doji candlestick pattern.
Why Doji Candlesticks Matter to Traders
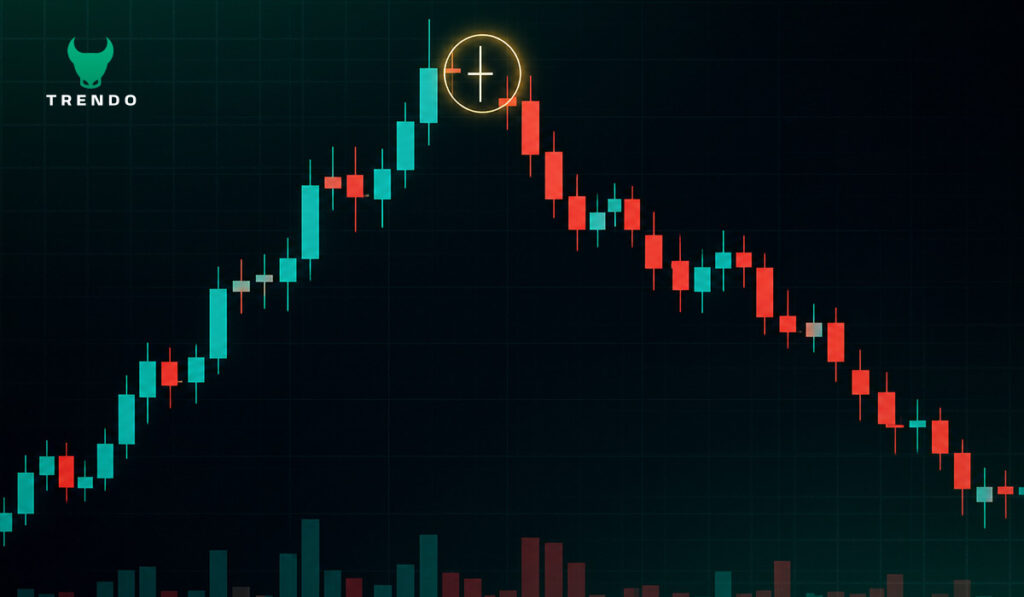
Doji patterns matter because they appear at critical junctures. They tend to show up at the tops and bottoms of trends, near significant support and resistance levels, or after sharp impulsive moves. Skilled traders watch for them specifically because a doji in the right location, confirmed by the right follow-through candle, can be one of the more reliable signals in technical analysis.
Doji vs. Regular Candlesticks: Key Differences
A standard candlestick has a noticeable body. A bullish candle closes higher than it opens; a bearish candle closes lower. The body length reflects the conviction behind that move. A doji candlestick, by contrast, has essentially no body — meaning conviction was absent. The market moved during the session (which the wicks show), but ultimately ended up exactly where it started. That distinction is what makes the doji stand apart from ordinary candles.
That is why learning how to read doji candlestick can give traders a real edge in technical analysis. That is why learning how to read doji candlestick can give traders a real edge in technical analysis.
How to Identify a Doji Candlestick Pattern
Knowing how to identify doji candlestick pattern starts with training your eye. Look for:
- A candle with a very small or flat body (open ≈ close).
- Upper and/or lower wicks of any length.
- The overall shape resembles a cross, plus sign, or “T.”
On most charting platforms, doji candles appear in neutral colors or the same as the surrounding candles, since there’s no clear direction to indicate.
Step-by-Step Guide to Spotting Doji Patterns
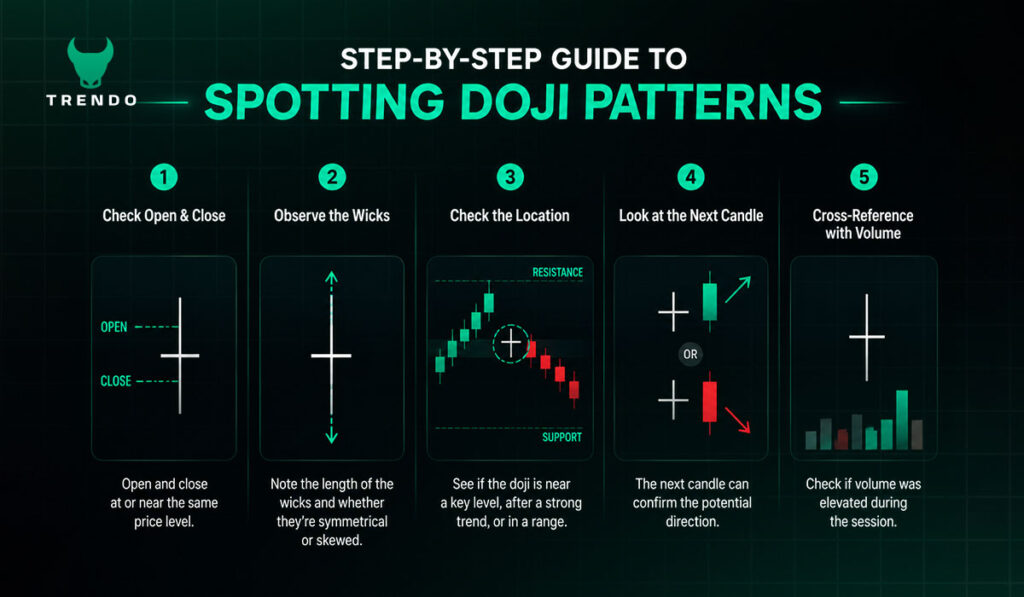
How to read doji candlestick formations on a live chart:
- Look at the candle’s open and close: are they at or near the same price level?
- Observe the wicks: how long are they, and are they symmetrical or skewed in one direction?
- Check the location: is this doji appearing near a key level, after a strong trend, or mid-range?
- Look at the candle immediately after the doji: does it confirm a direction?
- Cross-reference with volume: Was there elevated activity during this session?
Doji Candlestick on Different Timeframes
Doji patterns appear on every timeframe, from 1-minute scalping charts to monthly charts. Generally, the higher the timeframe, the more significant the doji. A doji on the daily or weekly chart carries far more weight than one on a 5-minute chart. On shorter timeframes, noise is greater and false signals are more frequent.
Common Mistakes When Identifying Doji Patterns
The most common mistake is treating every near-flat candle as a doji without applying a strict definition. Some platforms use different thresholds. Another mistake is identifying a doji visually but ignoring the broader context — a doji in the middle of a sideways consolidation is far less meaningful than one at the peak of a strong rally.
Tools and Indicators to Help Identify Doji
Most professional charting platforms automatically flag doji patterns. Beyond visual identification, pairing doji detection with volume overlays and trend indicators helps filter out low-quality signals. The goal is not to find every doji — it’s to find the ones that matter.
Read Trendo’s free Technical Analysis Starter Guide to see real chart examples of doji patterns across forex and crypto markets.
How to Read a Doji Candlestick
How to read doji candlestick requires a deep understanding of market psychology. When a doji forms, it tells you that buyers pushed the price up, sellers pushed it back down (or vice versa), and the two forces neutralized each other. The market is pausing, weighing its options. This is valuable because major moves — up or down — are usually preceded by a period of equilibrium.
Reading Doji in Uptrends vs. Downtrends
Context transforms how you interpret a doji:
- Doji in an uptrend: Suggests bullish momentum may be waning. Sellers are starting to match buyers. Watch for a bearish confirmation candle.
- Doji in a downtrend: Suggests bearish momentum may be slowing. Buyers are stepping in. Watch for a bullish confirmation candle.
- Doji in a sideways market: Less meaningful. The market is already indecisive; another indecision signal adds little new information.
Context Matters: Support and Resistance Levels
A doji forming directly at a known support or resistance zone is significantly more powerful than one appearing in random price territory. These price levels act as decision points where market participants historically react, and a doji at such a level confirms the hesitation is concentrated exactly where it matters most.
Volume Analysis with Doji Candlesticks
High volume during a doji session strengthens the signal. It means a large number of participants entered the market, the battle between buyers and sellers was intense, and yet neither side won. Low volume during a doji often signals disinterest rather than a meaningful standoff.
Doji as Indecision vs. Reversal Signal
Not every doji leads to a reversal. Many doji patterns simply reflect a brief pause before the existing trend resumes. What is the meaning of doji candlestick in any given situation depends on what follows it. A doji alone is a warning — the candle that comes after it is the verdict.
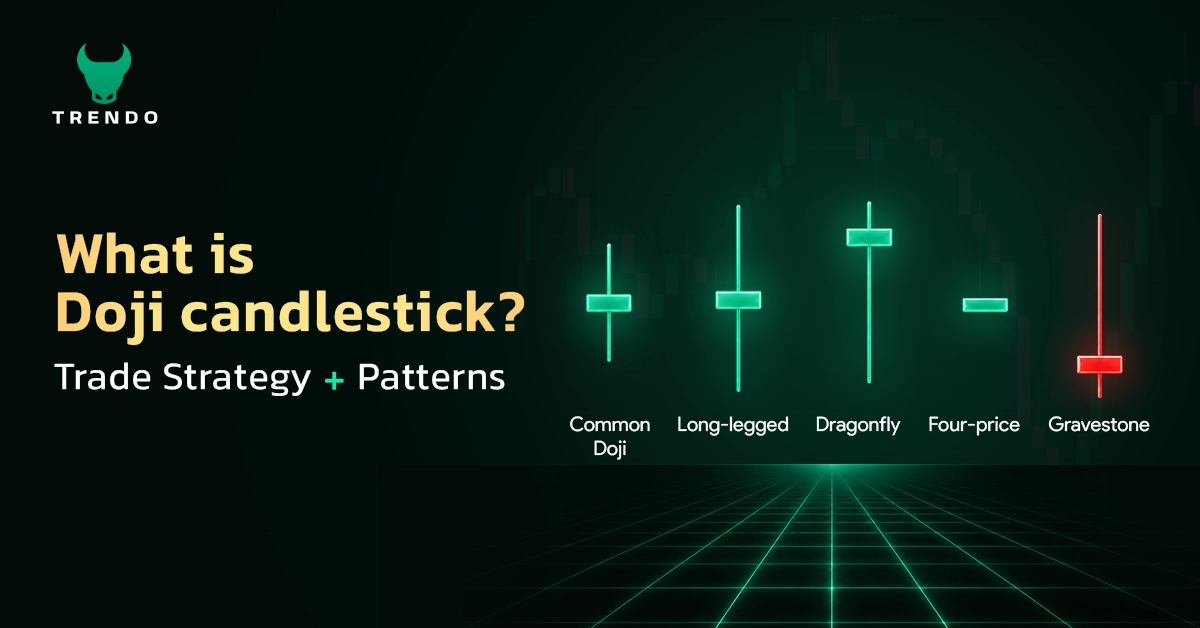
How Many Types of Doji Candlestick Are There?
To answer how many types of doji candlestick exist, most analysts recognize five primary types, each with distinct implications.
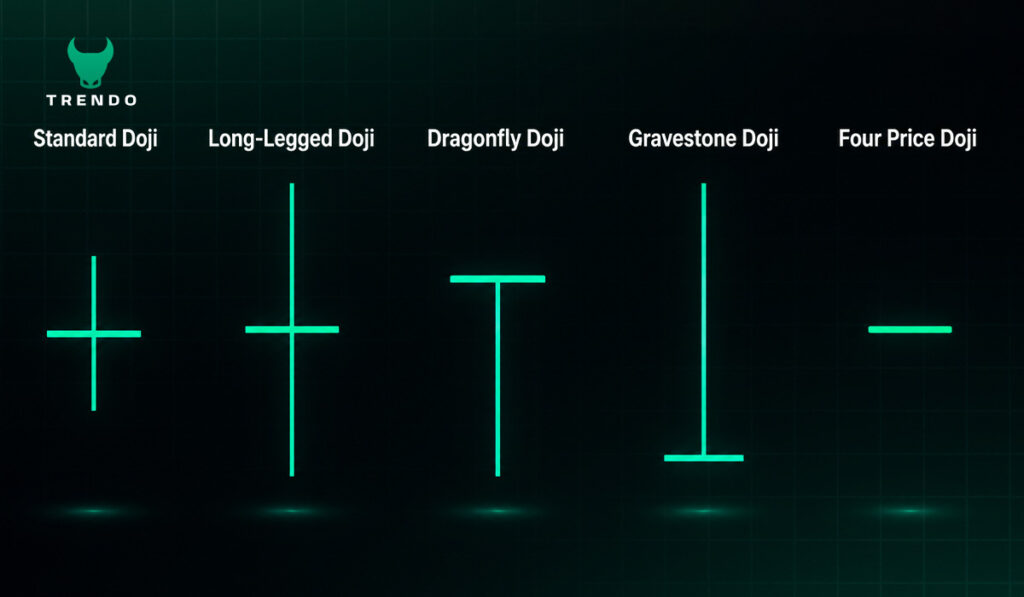
Standard Doji (Neutral Doji)
The classic form. The open and close are at the same or nearly the same price, with wicks of roughly equal length above and below. It represents pure equilibrium and is the most common doji variant. On its own, the standard doji signals indecision without a directional bias.
Long-Legged Doji (High Wave Doji)
This variant features unusually long wicks in both directions. It signals extreme volatility during the session — the price moved dramatically both upward and downward before settling back near the open. The longer the legs, the more intense the battle between buyers and sellers. This pattern is particularly significant during high-impact news events or at major turning points.
Dragonfly Doji (Bullish Reversal)
Shaped like the letter “T,” the dragonfly doji has a long lower wick and no upper wick. It forms when sellers drive the price significantly lower during the session, but buyers recover all those losses by the close. The price closed at or near the session’s high. This is typically interpreted as a bullish reversal signal, particularly when it appears at the bottom of a downtrend or at a support level.
Gravestone Doji (Bearish Reversal)
The inverse of the dragonfly. The gravestone doji has a long upper wick and no lower wick — shaped like an upside-down “T.” Buyers pushed prices significantly higher, but sellers reclaimed everything by the close. When this pattern appears at the top of an uptrend or at a resistance level, it’s read as a bearish reversal signal.
Four Price Doji (Rare Pattern)
This is the rarest type. All four price points — open, high, low, and close — are identical, meaning the price never moved during the entire session. The candle appears as a single horizontal line. This pattern typically signals extremely low liquidity and has limited analytical value in most markets.
Comparing Different Doji Types
| Doji Type | Shape | Typical Signal |
|---|---|---|
| Standard Doji | Cross/Plus | Indecision |
| Long-Legged Doji | Long cross | High volatility/indecision |
| Dragonfly Doji | “T” shape | Bullish reversal |
| Gravestone Doji | Inverted “T” | Bearish reversal |
| Four Price Doji | Flat line | Extreme illiquidity |
How to Trade a Doji Candlestick Pattern
Ready to trade doji setups with real capital? Explore Trendo’s ECN trading accounts for tight spreads and fast execution on forex, commodities, and indices.
Basic Doji Trading Rules
How to trade doji candlestick effectively comes down to a few non-negotiable principles:
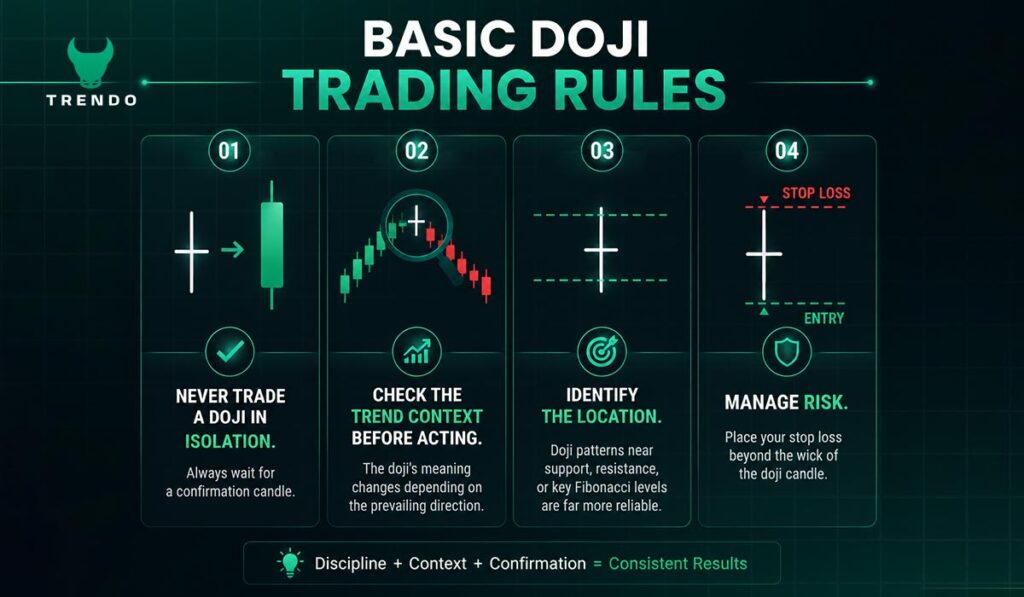
- Never trade a doji in isolation. Always wait for a confirmation candle.
- Check the trend context before acting. The doji’s meaning changes depending on the prevailing direction.
- Identify the location. Doji patterns near support, resistance, or key Fibonacci levels are far more reliable.
- Manage risk. Place your stop loss beyond the wick of the doji candle.
Confirming Doji Signals Before Entry
Confirmation is everything in doji trading. How to trade doji candlestick signals safely means waiting for the candle after the doji to show a clear direction. If a dragonfly doji forms at support, don’t buy on the doji itself — wait for the next candle to close bullish. This one rule eliminates most false signals.
Best Timeframes for Trading Doji Patterns
The daily and 4-hour timeframes strike the best balance between signal reliability and trading frequency. Weekly doji patterns are highly significant but rare. Anything below the 1-hour chart substantially increases false signals. Scalpers can trade doji patterns on lower timeframes, but require considerably more confirmation and tighter risk management.
Entry Points: When to Enter After a Doji
Two common entry approaches:
- Aggressive entry: Enter at the open of the confirmation candle, immediately after the doji session closes.
- Conservative entry: Wait for the confirmation candle to close and enter at the next candle’s open. This reduces the risk of a false break but may sacrifice some profit potential.
Doji Candlestick Trading Strategies
In the following strategies, you will discover how to use doji candlestick effectively across different market scenarios.
Doji Reversal Strategy (Trend Reversal)
This is the most widely used application of the doji pattern. The setup:
- Identify a clear, established trend (uptrend or downtrend).
- Spot a doji at an extreme, near the trend’s recent high or low.
- Wait for a confirmation candle in the opposite direction.
- Enter the trade in the reversal direction, with a stop loss beyond the doji’s wick.
- Target the next significant support or resistance level.
A gravestone doji after a sustained uptrend, followed by a strong bearish candle, is a textbook sell setup. A dragonfly doji after a sustained downtrend, followed by a strong bullish candle, is a textbook buy setup.
Doji Continuation Strategy (Trend Pause)
Not all doji patterns signal reversals. Sometimes the trend is simply pausing before continuing. If a doji forms mid-trend, far from a key level, and is followed by a candle in the original trend direction, it signals continuation rather than reversal. Traders can use this to add to existing positions or re-enter after a pullback.
Doji Breakout Strategy
In ranging markets, a doji can appear repeatedly as the price oscillates. When the price finally breaks out of the range with conviction, any doji that formed near the boundary of the range gains retrospective significance. Traders use this to confirm breakouts: if a doji forms near range resistance and the next candle breaks out bullish above it, that’s a momentum entry signal.
Doji at Support/Resistance Strategy
This is one of the highest-probability applications of how to use doji candlestick signals. When price tests a known level, a previous swing high/low, a round number, a weekly pivot, and forms a doji precisely at that level, it confirms the level is holding. The entry trigger is the confirmation candle. This strategy pairs the structural analysis of support and resistance with the timing signal of the doji.
Combining Doji with Moving Averages
Moving averages serve as dynamic support and resistance levels. When a doji forms right at a key moving average (such as the 50-day or 200-day MA), the signal becomes stronger. The moving average confirms the price level is significant; the doji confirms the level is holding. For more on how moving averages interact with price action, see Trendo’s guide on candlestick pattern strategies.
How to Use Doji Candlestick with Technical Indicators
How to use doji candlestick signals most effectively means combining them with confirming indicators. The doji identifies the moment of indecision; an indicator provides the direction.
Doji + RSI (Relative Strength Index)
When you learn how to use doji candlestick with the RSI indicator, the signal becomes much stronger. The RSI indicator measures momentum and identifies overbought (above 70) and oversold (below 30) conditions. A doji forming when RSI is in overbought territory is a much stronger sell signal than a doji alone. Similarly, a doji at oversold RSI levels strengthens the case for a bullish reversal.
Doji + MACD
The MACD is useful for identifying the trend direction and momentum shifts. If a doji appears while the MACD histogram is shrinking (momentum declining), it confirms that the current trend is losing steam. This is particularly effective for the doji reversal strategy.
Doji + Bollinger Bands
Bollinger Bands mark the statistical boundaries of price movement. A doji touching or piercing the outer Bollinger Band often marks an extreme — the price has moved beyond its normal range and is now pausing. This combination is especially useful for mean-reversion strategies.
Doji + Fibonacci Retracement
Key Fibonacci levels (38.2%, 50%, 61.8%) often act as invisible magnets for price. When a doji appears precisely at one of these levels during a retracement, it signals that the pullback may be over. This setup is one of the most studied entry triggers in technical analysis.
Doji + Volume Indicators
Volume provides the raw confirmation that a doji’s indecision is genuine. High volume during a doji session indicates a real tug-of-war. Low-volume doji candles can often be ignored. Volume analysis is the final filter before committing to a trade.
Doji Candlestick in Different Markets
What are doji candlestick patterns like across different asset classes? The fundamentals are consistent, but each market has its nuances:
- Forex: Doji patterns are common and reliable on major pairs like EUR/USD and GBP/USD. The 24-hour nature of forex means session-based doji patterns form more frequently.
- Stocks: Doji candles at earnings boundaries or major price levels carry strong signals, especially on daily and weekly charts.
- Crypto: Highly volatile markets produce doji patterns frequently. More confirmation is advisable in crypto due to lower liquidity and higher susceptibility to manipulation on some assets.
- Commodities (Gold, Oil): Doji patterns at cyclical highs and lows, especially near fundamental price zones, are widely watched by professional traders.
Common Mistakes When Trading Doji Candlesticks
Trading Doji Without Confirmation
The single biggest mistake. Entering a position the moment you see a doji — before the next candle confirms direction- leads to being stopped out when the trend continues. Always require a confirmation candle.
Ignoring the Trend Context
A doji in isolation, without reference to the surrounding trend, is meaningless. A doji during a strong uptrend near a key resistance is a potential reversal signal. The same doji mid-trend, far from any level, is likely noise. Context determines everything. For a fuller understanding of price action analysis, which is the broader framework that doji trading belongs to, Trendo’s price action guide is an essential read.
Using Doji on Wrong Timeframes
Doji signals on very short timeframes (1-minute, 5-minute charts) are frequent, noisy, and largely unreliable for most trading styles. Unless you’re an experienced scalper with a well-defined system, stick to timeframes of 1 hour and above.
These mistakes usually happen when traders don’t fully understand what is the meaning of doji candlestick in the proper context.
Real Trading Examples with Doji Candlesticks
Example 1: Dragonfly Doji Reversal Trade
- Setup: EUR/USD has been falling for three consecutive days. On day four, a dragonfly doji forms at a well-defined horizontal support level. The next candle opens bullish and closes near its high.
- Action: Enter long at the open of the confirmation candle. Stop loss below the dragonfly’s low. Target the next resistance level.
- Result: The trade aligns trend context, structural level, and candlestick signal — three independent confluences supporting the same conclusion.
Example 2: Gravestone Doji at Resistance
- Setup: Gold (XAU/USD) has rallied strongly and is approaching a major resistance zone. A gravestone doji forms at the resistance level, with a notably long upper wick.
- Action: Await a bearish confirmation candle. Enter short once confirmed. Stop above the gravestone’s high. Target the recent swing low.
- Why it works: Buyers pushed strongly into resistance, were rejected, and the close near the lows signals sellers are now in control.
Conclusion: Mastering Doji Candlestick Trading
By now, you should have a solid understanding of what is a doji candlestick, what does a doji candlestick mean in different market contexts, how to identify doji candlestick pattern, how to read doji candlestick signals, and how to trade a doji candlestick pattern profitably. Mastering these concepts will help you spot high-probability setups and make more informed trading decisions.
The market’s biggest moves are often preceded by its quietest moments — and few candlestick formations capture that silence better than the doji.
Ready to apply what you’ve learned? Create your free Trendo account and start practicing doji strategies on real charts today, with access to hundreds of instruments across forex, commodities, and indices.