What Is the Price Channel Pattern in Forex? A Complete Guide


The Price Channels Pattern in forex is one of the technical analysis tools and their types are used to better understand the fluctuations of the forex market and successful trading.
These patterns form when a currency pair's price moves between two parallel lines, indicating its highs and lows over time. Identifying these channels helps traders predict price movements and make informed decisions.
This guide, from Trendo broker, dives into the mechanics of price channel patterns, offering insights and tips to enhance your trading strategy. Let's get started.
Contents
What Is a Price Channel Pattern?
A price channel pattern in Forex is a technical analysis tool that shows the range within which a currency pair's price moves. This range is defined by two parallel lines: the upper resistance line and the lower support line. These lines act as barriers that the price tends to bounce between.
The upper resistance line marks the highest points the price reaches before reversing downward. The lower support line highlights the lowest points the price hits before bouncing back up. When the price stays within these boundaries, it forms a price channel.
Price channels can be ascending, descending, or horizontal, depending on the trend. An ascending channel shows an uptrend with higher highs and higher lows. A descending channel indicates a downtrend with lower highs and lower lows. A horizontal channel, or sideways channel, occurs when the price moves within a constant range without a clear trend.
Recognizing price channel patterns is vital because they provide insights into potential price movements. Traders use these patterns to identify breakout opportunities, gauge market strength, and make informed trading decisions.
Key Components of a Price Channel
A price channel in Forex trading includes two main elements: the support line and the resistance line. These lines run parallel, enclosing the price movements within a set range.
1. Support Line: The lower boundary of the channel, connecting the lowest points. It acts as a floor, preventing the price from falling further. Traders often buy when the price nears this line, expecting it to bounce back up.
2. Resistance Line: The upper boundary of the channel, connecting the highest points. It serves as a ceiling, stopping the price from rising further. Traders usually sell when the price approaches this line, anticipating it will reverse downward.
3. Channel Width: The distance between the support and resistance lines. It shows the range of price fluctuations. A wider channel indicates greater volatility; a narrower channel suggests more stable price movements.
4. Trend Direction: Price channels can be ascending, descending, or horizontal. An ascending channel indicates an uptrend with higher highs and lows. A descending channel shows a downtrend with lower highs and lows. A horizontal channel suggests a sideways market with no clear trend direction.
5. Breakouts: Occur when the price moves outside the established channel. Breakouts can signal a potential trend change and are key trading opportunities.
Types of Price Channels
Price channels come in three main types: ascending, descending, and horizontal. Each type reflects a different market trend and helps traders make informed decisions.
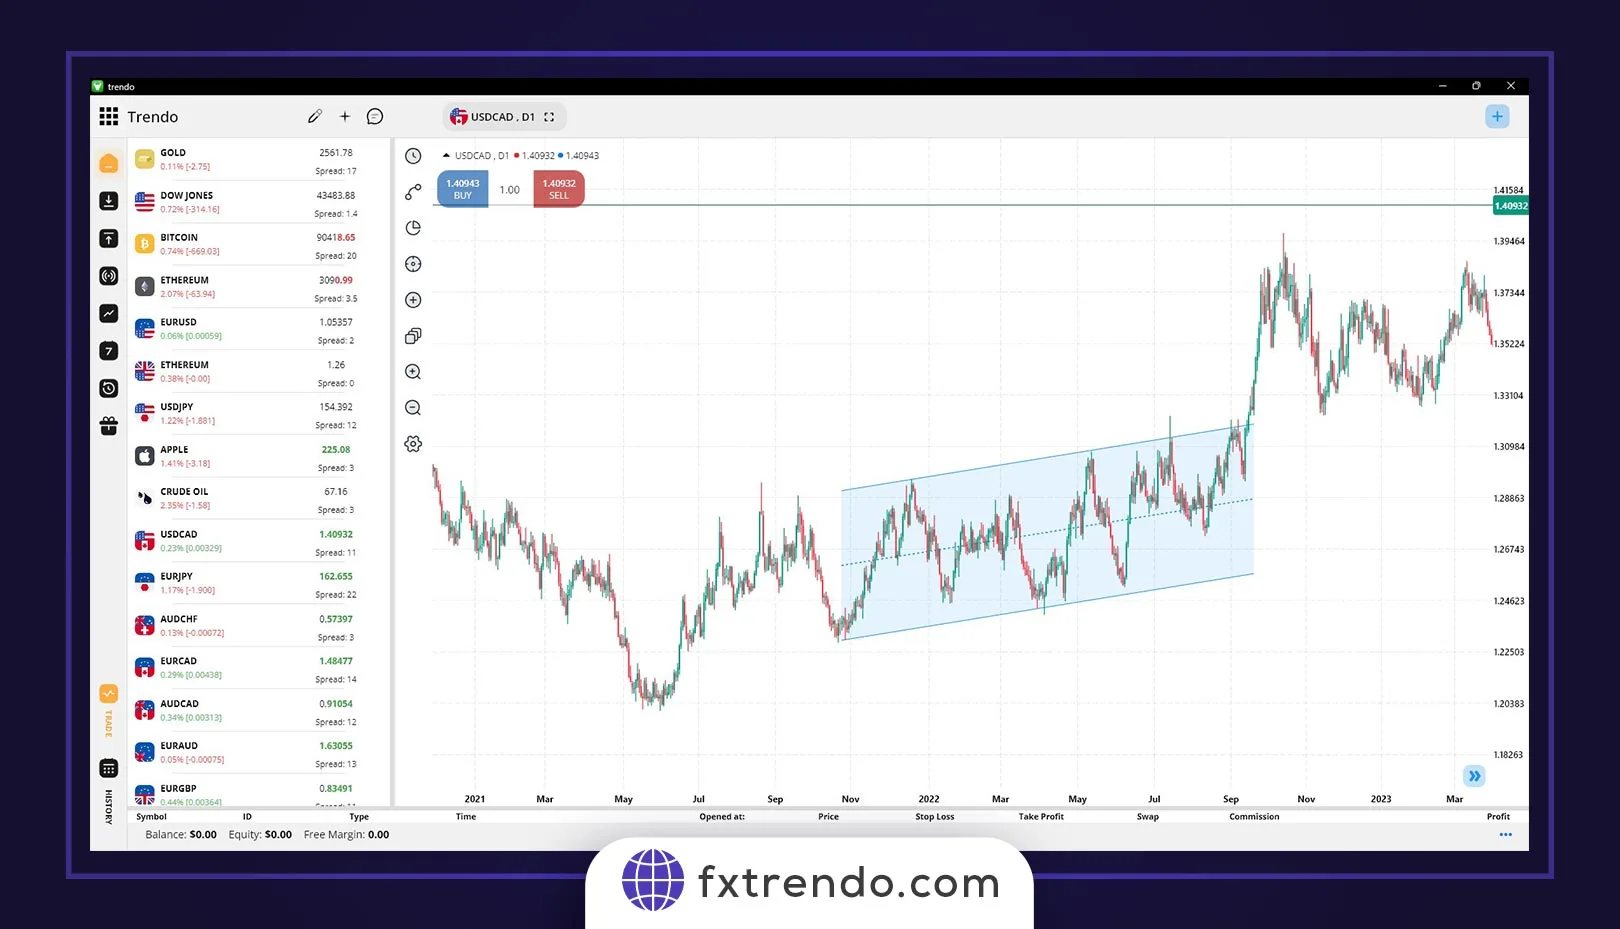
Bullish Price Channel: This type forms during an uptrend. It is characterized by higher highs and higher lows within the channel. The support line slopes upward, indicating increasing price levels over time. Traders look for buying opportunities near the support line and selling opportunities near the resistance line.
An example of a bullish price channel
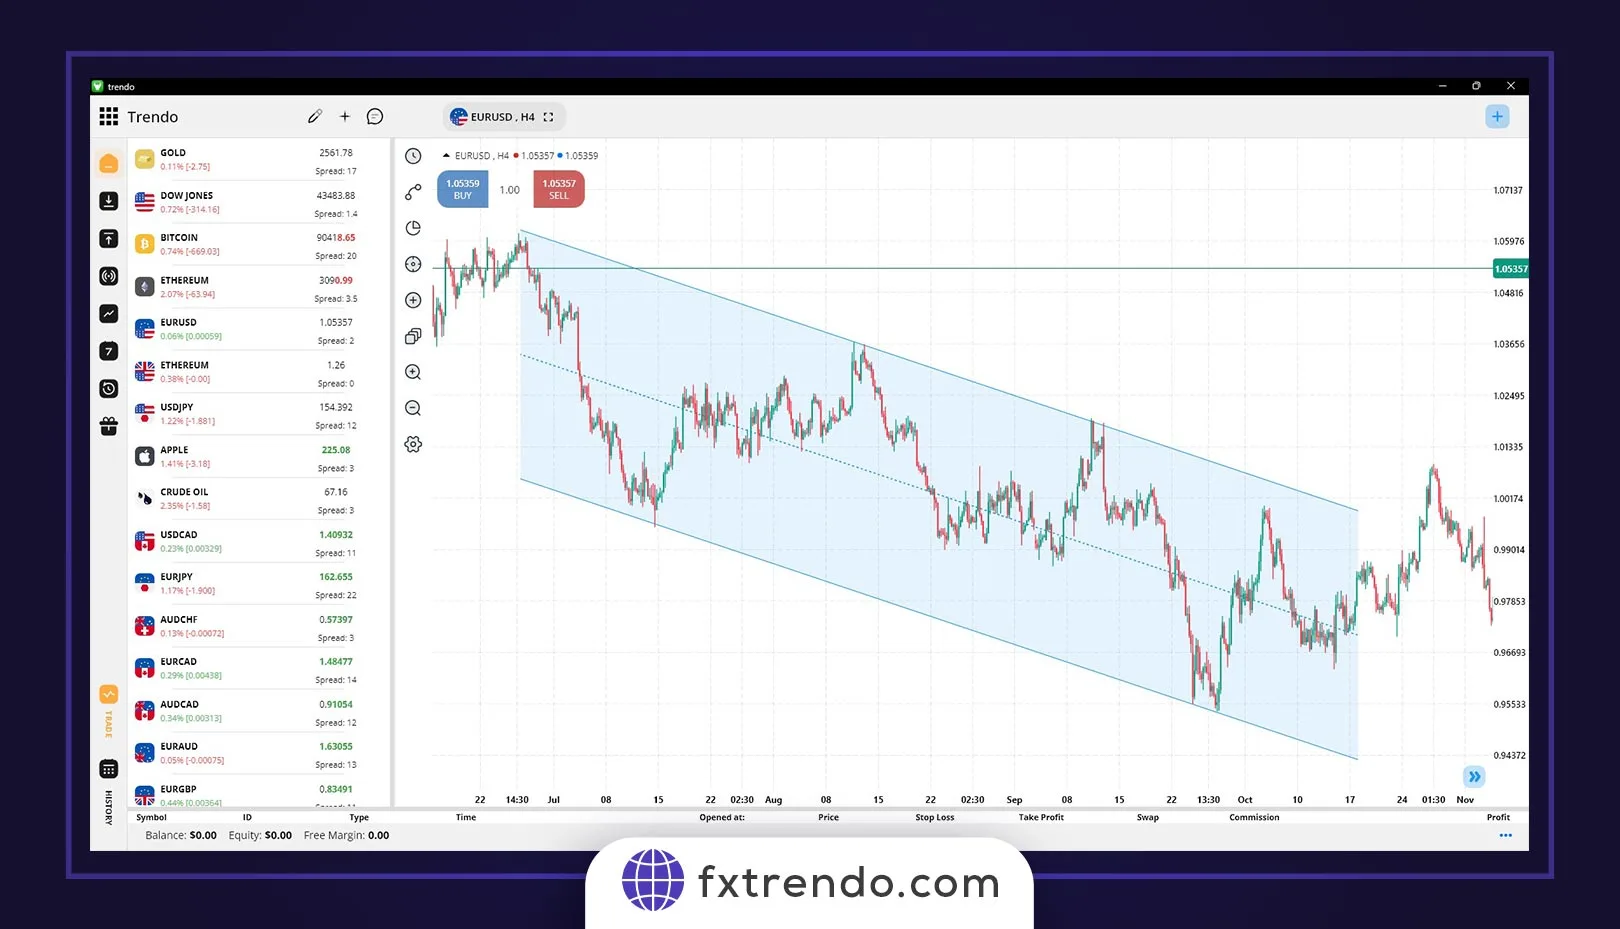
Bearish Price Channel: Formed during a downtrend, this channel is marked by lower highs and lower lows. The resistance line slopes downward, showing decreasing price levels. Traders often sell near the resistance line and buy near the support line.
An example of a bearish price channel
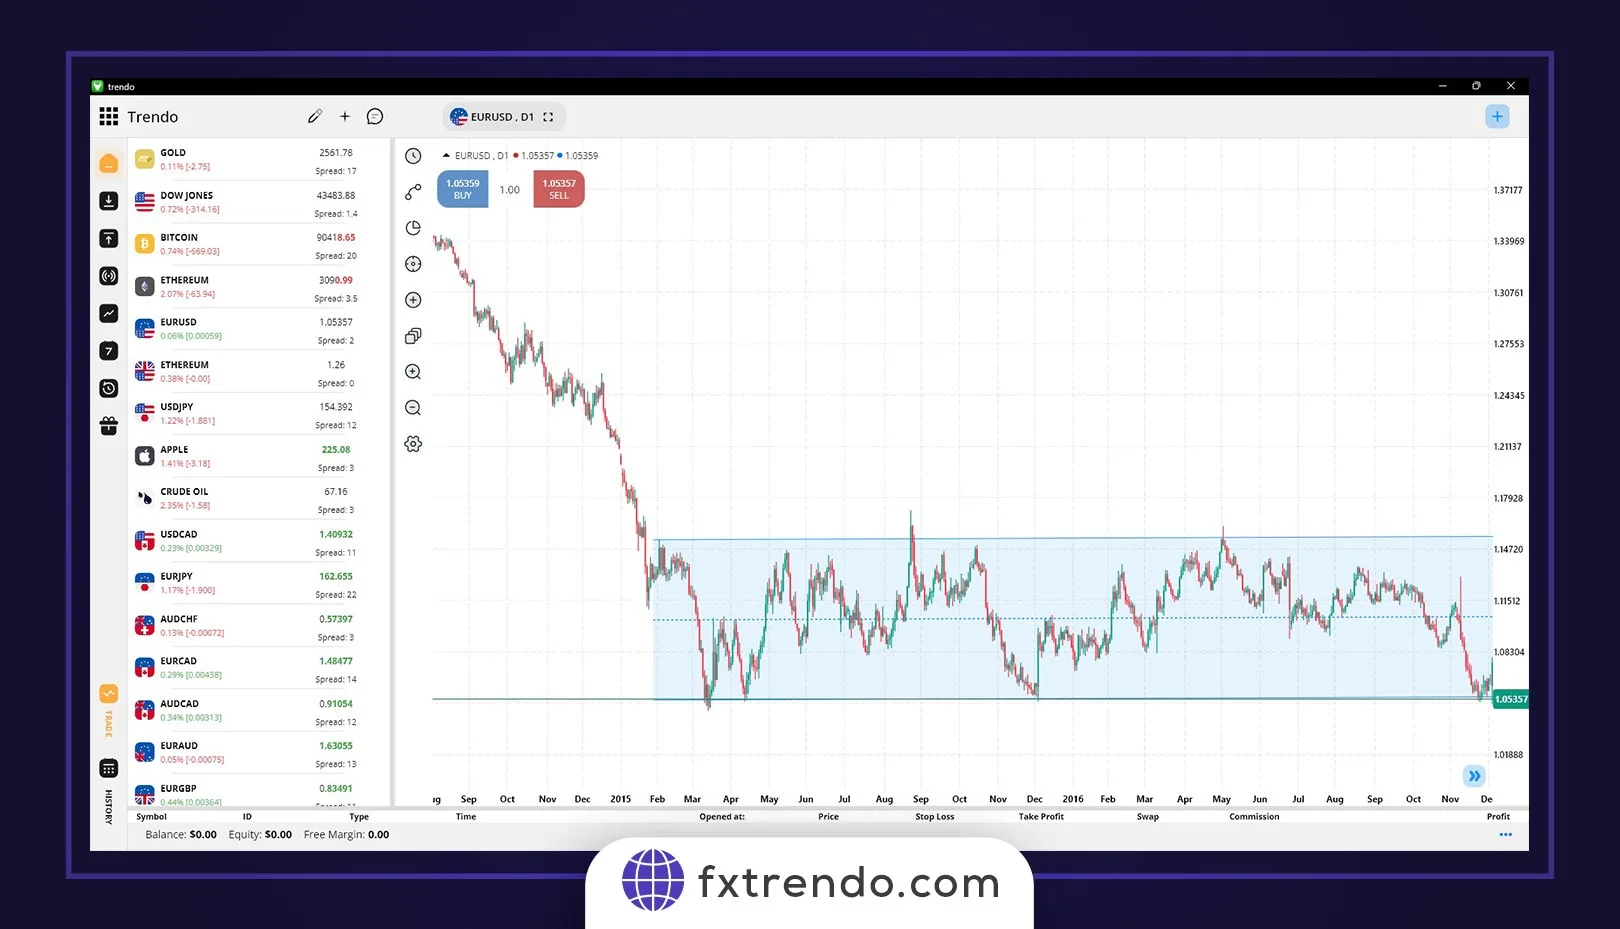
Horizontal (Range) Price Channel: Also known as a sideways channel, it occurs when the price moves within a constant range without a clear trend. The support and resistance lines run parallel horizontally. Traders buy near the support line and sell near the resistance line, capitalizing on the price oscillations within the range.
A horizontal price channel
Understanding the different types of price channels helps traders identify market conditions and develop strategies accordingly.
How to Draw a Price Channel on a Chart?
To draw a price channel, first, you need to determine whether the market is in an uptrend or a downtrend. For an ascending channel, the market should form higher highs and higher lows at a relatively consistent rate. Conversely, a descending channel requires the market to form lower highs and lower lows at a similar pace.
1. Identify the Trend: Start by identifying the current trend. This helps in drawing the relevant trendline accurately.
2. Draw the Trendline: Once the trend is determined, draw a trendline connecting the higher lows for an uptrend or the lower highs for a downtrend.
3. Create the Parallel Line: After drawing the initial trendline, duplicate it and move it to the opposite side of the price action. For an uptrend, this line should connect the higher highs, and for a downtrend, it should connect the lower lows.
The most crucial aspect of drawing a price channel is accuracy. If the parallel lines don’t align with market action, don’t force the channel. Channels are naturally maintained by traders who recognize and use them for entering and exiting trades.
By following these steps, you can effectively draw a price channel and use it to inform your trading decisions.
Read more: How to trade with a Trendline and set a great strategy
How to Identify a Price Channel in Forex?
Identifying a price channel in Forex involves spotting a range where the price consistently moves between two parallel lines. Here’s how:
1. Observe the Trend: Look at the price movement over a period. Determine if it's moving upwards, downwards, or sideways to identify if the channel is ascending, descending, or horizontal.
2. Draw the Support Line: For an uptrend, connect the higher lows with a straight line. In a downtrend, connect the lower highs. This line is the support line, showing the lower boundary of the price movement.
3. Draw the Resistance Line: For an uptrend, connect the higher highs with another line parallel to the support line. In a downtrend, connect the lower lows. This line marks the upper boundary.
4. Check Parallel Alignment: Make sure the support and resistance lines are parallel. If not, it might not be a valid price channel.
5. Analyze Price Interaction: See how the price interacts with these lines. The price should touch or approach these lines multiple times to confirm the boundaries.
By following these steps, you can identify a price channel in Forex and improve your trading strategy.
Benefits of Using Price Channel Patterns in Forex Trading
Price channel patterns offer numerous advantages for Forex traders, providing insights into market behavior and improving trading strategies.
1. Clear Trend Identification: Price channels help in identifying the market trend, whether it’s an uptrend, downtrend, or sideways movement. This clarity allows traders to align their strategies with the market direction.
2. Entry and Exit Signals: By observing price interactions with the support and resistance lines, traders can determine entry and exit points. Buying near the support line and selling near the resistance line often yields favorable trading outcomes.
3. Risk Management: Price channels assist in setting stop-loss levels effectively. Traders can place stop-loss orders just outside the channel lines, minimizing potential losses if the price breaks out in an unfavorable direction.
4. Predictive Power: Channels provide a visual representation of future price movements. When the price stays within the channel, traders can predict with greater accuracy where the price is likely to go next.
5. Breakout Opportunities: When the price breaks out of the channel, it signals a potential trend reversal or continuation, presenting lucrative trading opportunities. Traders can capitalize on these breakouts by adjusting their positions accordingly.
Using price channel patterns simplifies decision-making and enhances trading precision. They are indispensable tools for traders aiming to navigate the Forex market effectively and increase their chances of success.
Limitations of Price Channel Patterns
While price channel patterns can be a powerful tool in Forex trading, they have some limitations.
1. Fake Breakouts: Price channels can sometimes show fake breakouts where the price momentarily moves outside the channel boundaries, only to return within the range shortly after. This can lead to premature trading decisions.
2. Subjectivity: Drawing price channels can be subjective. Different traders might draw the lines slightly differently, leading to varied interpretations of the same price movement.
3. Market Conditions: Price channels work best in trending markets and can be less effective in choppy or highly volatile markets where price movements are erratic and unpredictable.
4. Lagging Indicator: Since price channels are based on historical data, they are inherently lagging indicators. They may not always accurately predict future price movements, especially in rapidly changing market conditions.
5. Limited Predictive Power: Price channels don’t provide information about the duration of trends or the strength of the breakout. They show the range within which the price has been moving but don't indicate how long this movement will last or how significant a breakout might be.
6. Requires Confirmation: Relying solely on price channels without additional confirmation from other technical indicators or analysis methods can increase the risk of incorrect trading decisions.
While price channel patterns are valuable, they should be used in conjunction with other tools and analysis methods to enhance trading decisions and strategies.
Conclusion
Price channels in Forex are powerful tools for identifying and determining market trends. By learning how to draw and trade with channels, you can enhance the profitability of your trades.
Use price channels across different time frames for trading. This helps in identifying both long-term and short-term market trends. However, remember that no tool in technical analysis is flawless. Price channels can also be wrong. Therefore, always use other technical analysis tools and trade cautiously.
FAQ
What is the price channel pattern in forex?
What is the trendline of the price channel?
What is Channel pricing strategy?
How do you draw a price channel?
How do you use a price channel indicator?
What is the golden rule of channel pricing?
Are price channels in Forex always profitable?
پست مرتبط
پربازدیدترین ها
0


