What is a Trading Node in Price Action?


In price action trading, a key concept is the trading node. A trading node is an area on a price chart where significant buying or selling activity has occurred. These nodes act as markers of market interest, helping traders identify potential areas of support and resistance.
In this blog post, we’ll explore trading nodes within the context of price action trading. We’ll cover what trading nodes are, how they can be identified, their significance in trading strategies, and practical tips for integrating this knowledge into your trading toolkit.
Let’s unlock the power of trading nodes and elevate your trading game.
Contents
What is Price Action?
Price action is a method of analyzing financial markets by observing and interpreting the movement of prices over time. Unlike other trading strategies that rely on technical indicators, price action focuses solely on the price movement itself.
By studying the open, high, low, and close prices on a chart, traders can gain insights into market psychology and make informed trading decisions. Price action trading involves understanding the story that the price movements are telling. It helps traders identify patterns, trends, and key levels of support and resistance.
One of the main advantages of price action trading is its simplicity and the ability to apply it across different markets and timeframes. Whether trading stocks, forex, commodities, or cryptocurrencies, price action can be a valuable tool in your trading toolkit.
What is a Trading Node?
A trading node is a specific point or area on a price chart where a significant amount of trading activity has occurred. These nodes highlight areas where buyers and sellers have shown considerable interest, leading to potential shifts in price direction.
Trading nodes often correspond to key levels of support and resistance. Support levels are points where the price tends to stop falling and may bounce back up, while resistance levels are points where the price tends to stop rising and may reverse downward. By identifying these nodes, traders can gain insights into the market's behavior and make more informed trading decisions.
Understanding trading nodes helps traders predict future price movements. When the price approaches a previously identified trading node, it’s likely to react in a similar way as before. This makes trading nodes valuable tools for developing effective trading strategies and improving market analysis.
Types of Trading Nodes in Price Action
Trading nodes in price action can be broadly classified into two categories:
- Continuation Nodes
- Reversal Nodes
Continuation Nodes
In continuation nodes, the price halts at these levels before resuming its previous trend. Continuation nodes can be classified into the following types:
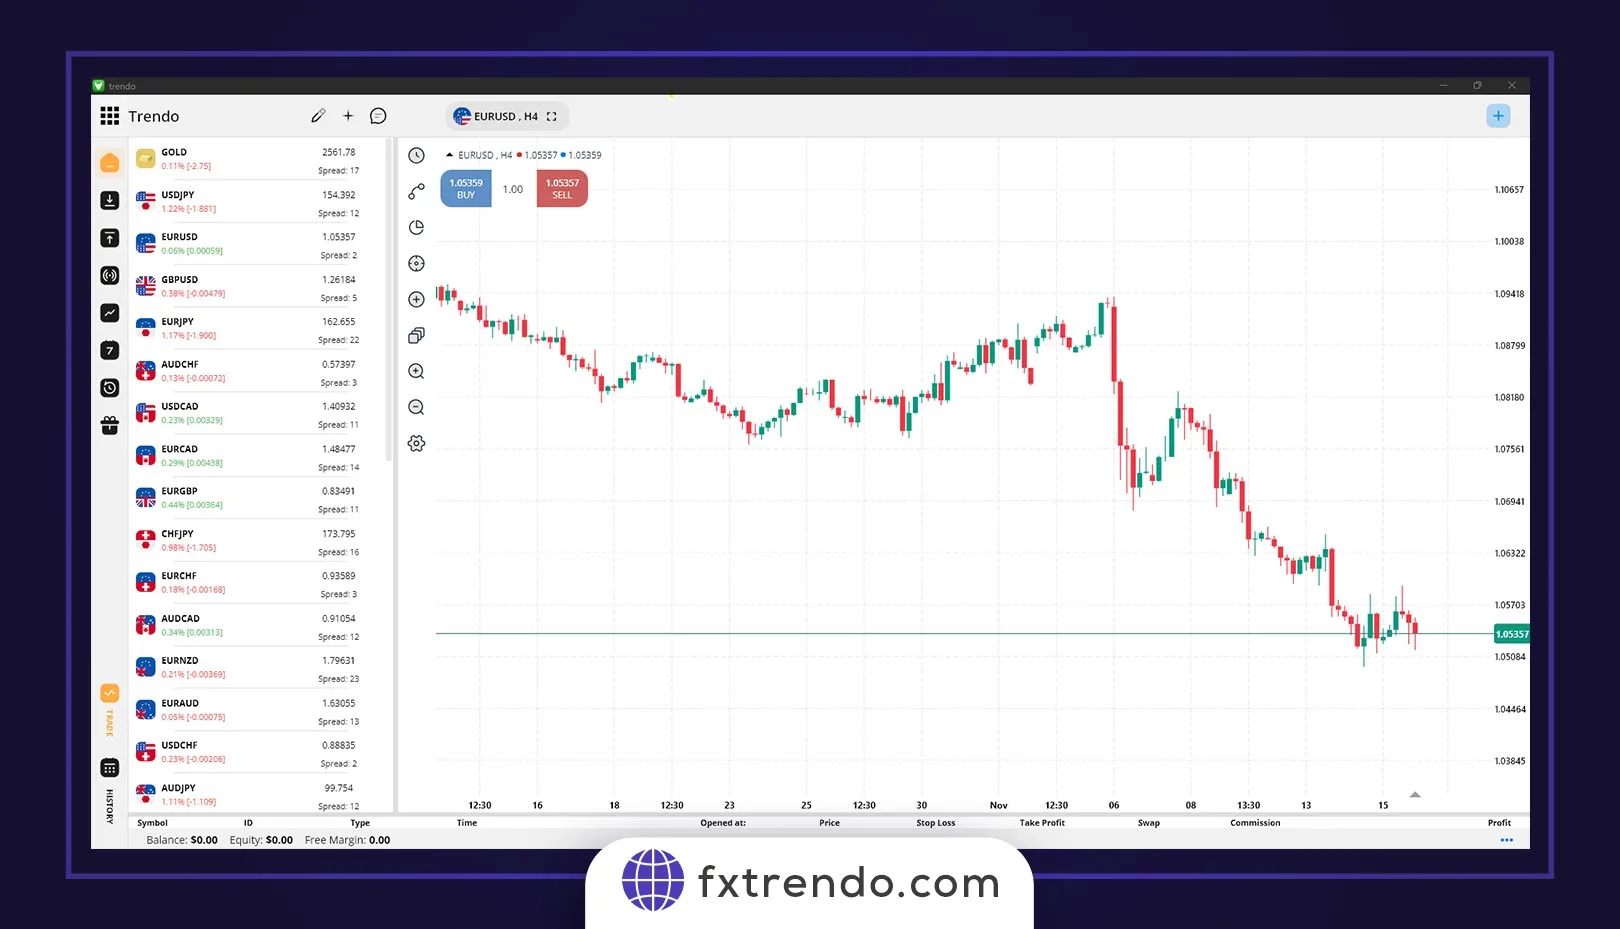
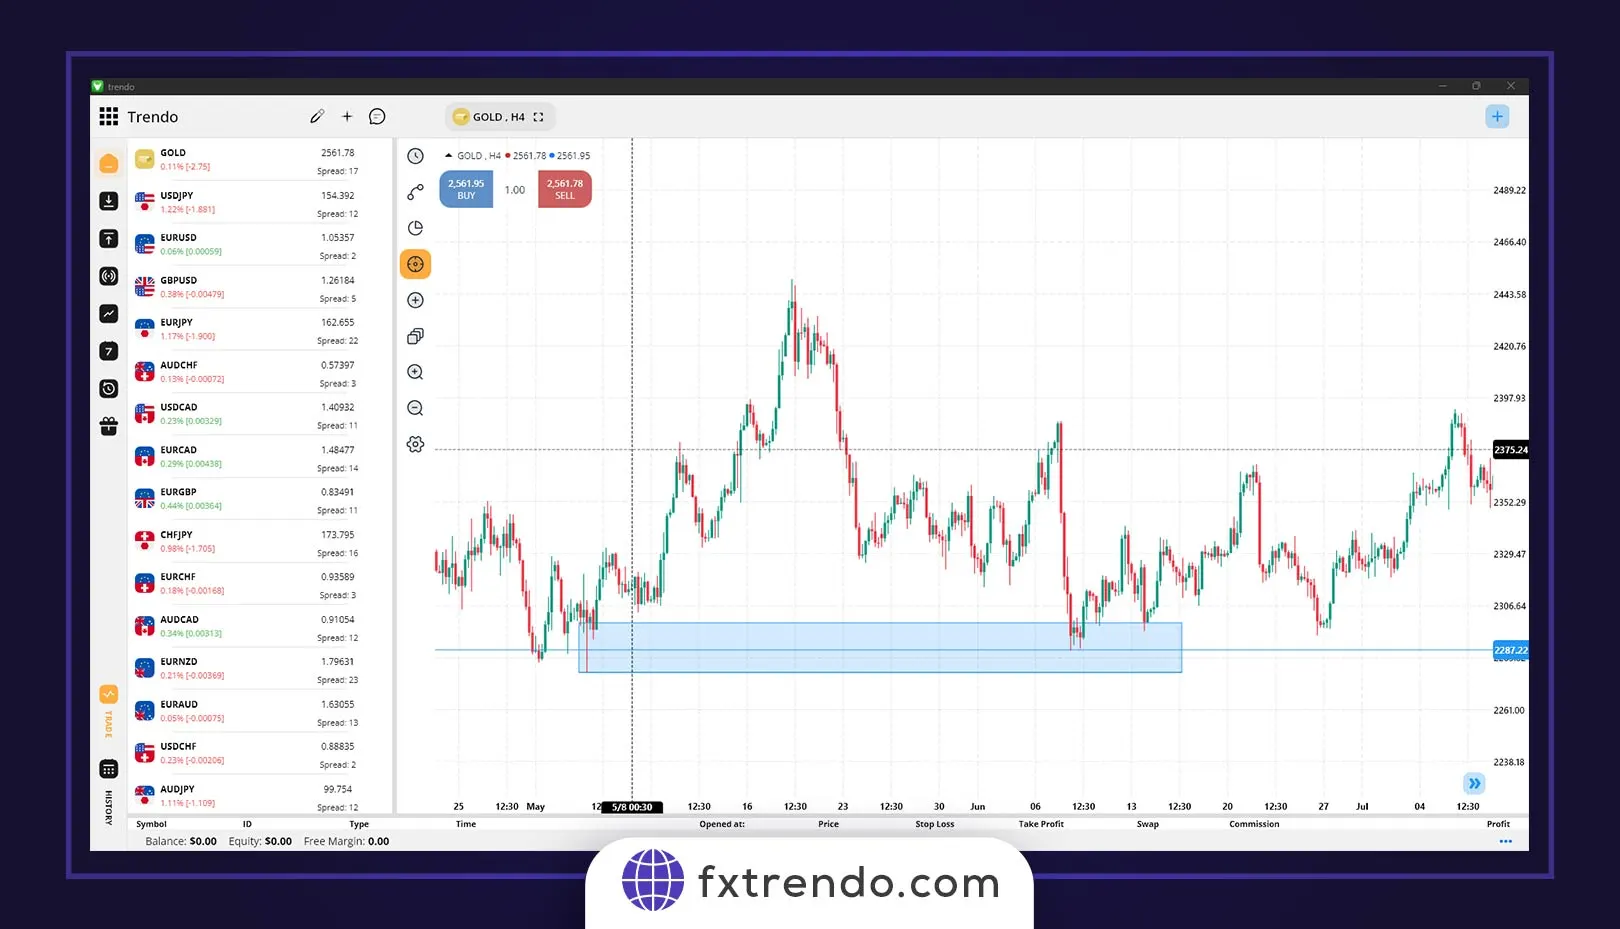
Rally Base Rally (RBR): In this type of continuation node, a strong upward movement (rally) occurs first, followed by a pause where a base is formed. This stage signifies a balance between buyers and sellers. After this, another rally takes place, leading to a price increase. In the image below, you can see an example of the Rally Base Rally node:


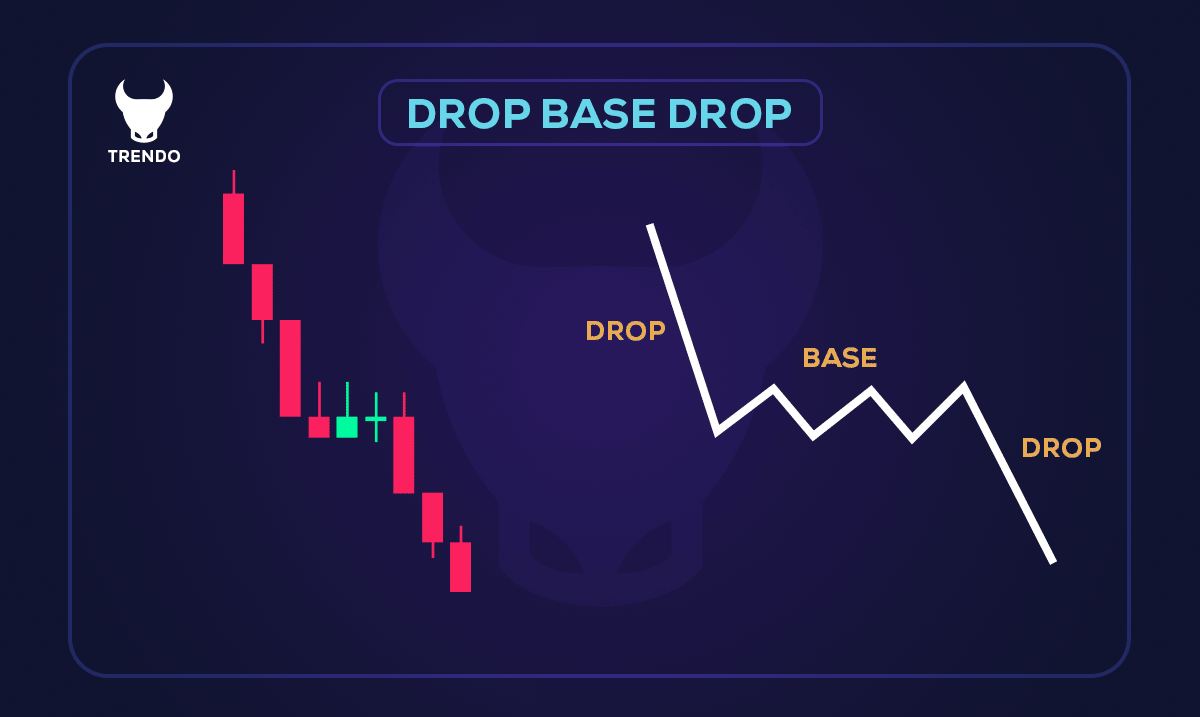
Drop Base Drop (DBD): In this type, a strong downward movement (drop) occurs first, followed by a pause where a base is formed. This stage also indicates a balance between buyers and sellers. After this, another drop happens, leading to a price decrease. In the image below, you can see an example of the Drop Base Drop node:

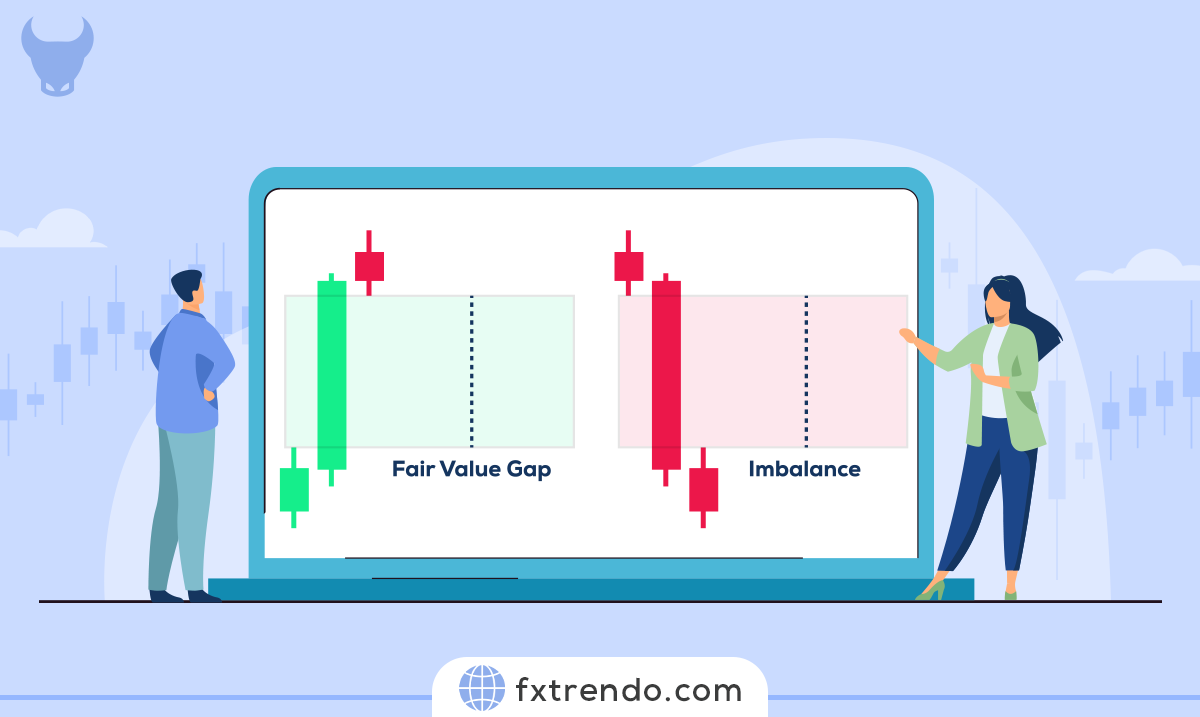
Hidden Gap: This node occurs after a temporary pause in price movement. This pause may be identified as temporary support or resistance on the chart. The hidden gap might not be visible at first glance and may require checking lower timeframes for identification.
Reversal Nodes
Reversal nodes are types of trading nodes where the price halts and then reverses direction, moving against the previous trend. Reversal nodes can be classified into the following types:
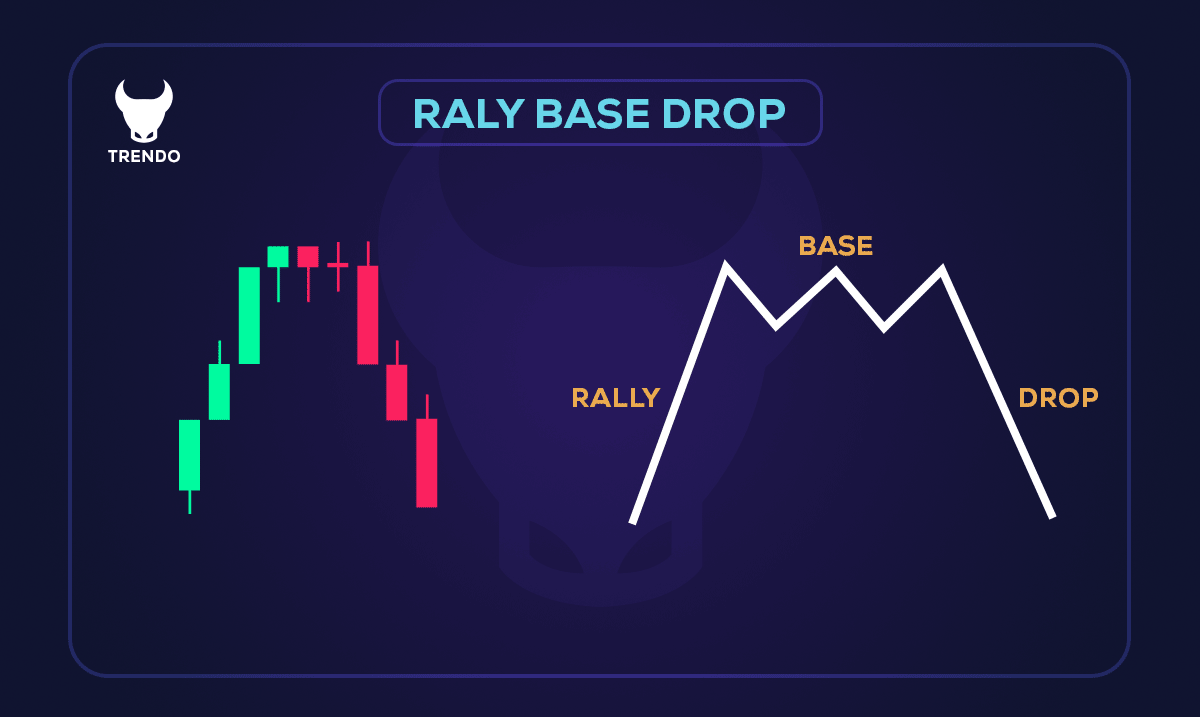
Drop Base Rally (DBR): In this type, a strong downward movement (drop) occurs first, followed by a pause where a base is formed. This stage signifies a balance between buyers and sellers. Then, a rally takes place, reversing the direction and turning the market bullish. In the image below, you can see an example of a drop base rally:

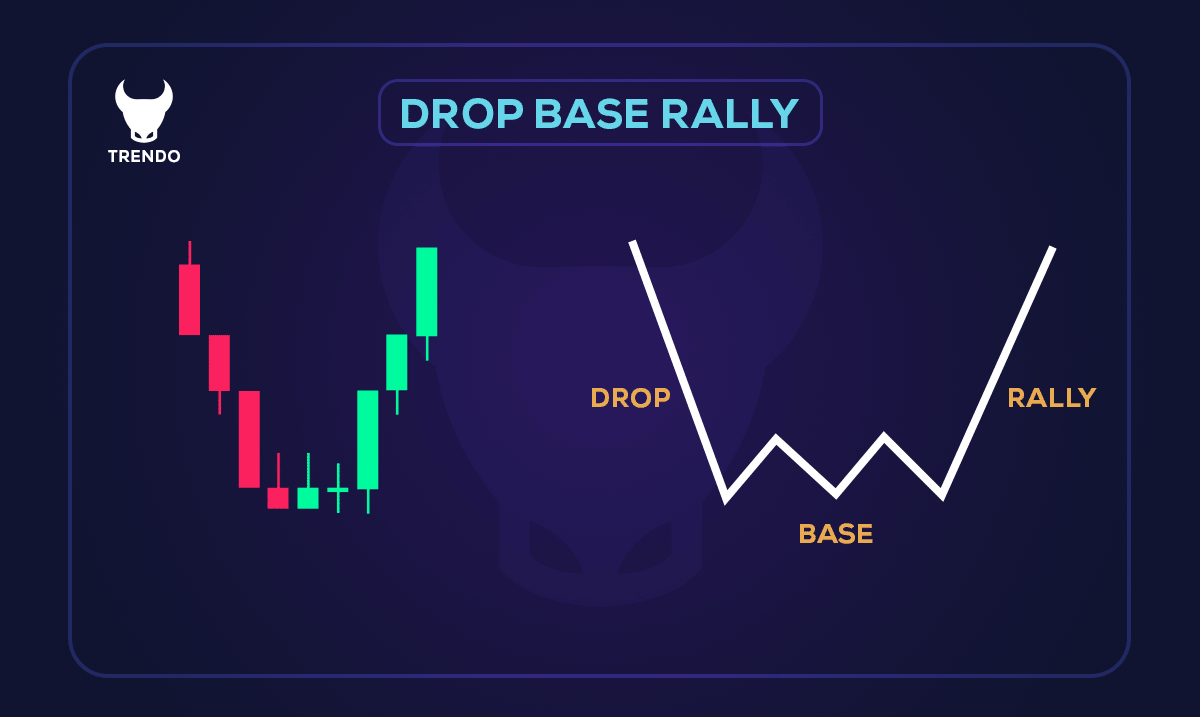
Rally Base Drop (RBD): In this type, a strong upward movement (rally) occurs first, followed by a pause where a base is formed. This stage indicates a balance between buyers and sellers. Then, a drop happens, reversing the direction and turning the market bearish. In the image below, you can see an example of a bearish Rally Base Drop node:

Long Shadow Reversal: This pattern appears at the end of a trend, indicating final buying or selling pressure. It consists of a candlestick with a long shadow, showing a significant price movement in the opposite direction. The body of the candlestick is relatively small compared to the shadow. After hitting this node, the price starts its reversal move. In the image below, you can see an example of a Long Shadow return node:
Identifying Trading Nodes on a Chart
Identifying trading nodes on a chart is crucial for traders using price action strategies. These nodes provide insight into significant market activity and help forecast future price movements. Here’s a step-by-step guide to spotting trading nodes:
1. Look for High Volume Areas: Trading nodes often occur at points of high trading volume. Check the volume bars at the bottom of your chart and correlate them with price movements. Peaks in volume can signal a trading node.
2. Identify Key Support and Resistance Levels: Trading nodes often align with significant support and resistance levels. Look for areas where the price has historically reversed or consolidated. These points indicate strong buying or selling interest.
3. Use Candlestick Patterns: Pay attention to candlestick patterns that form around high volume areas. Patterns like doji, engulfing, and hammer can indicate potential trading nodes. These patterns reflect market sentiment and provide clues about future price action.
4. Check for Price Gaps: Gaps in price can signify trading nodes. A gap occurs when there is a significant difference between the closing price of one period and the opening price of the next. These gaps can act as areas of support or resistance.
5. Monitor Moving Averages: Moving averages can help smooth out price data and highlight trading nodes. When the price interacts with a moving average, it can indicate a potential trading node. Pay attention to how the price reacts at these points.
By applying these techniques, you can identify trading nodes and incorporate them into your trading strategy.
How to Use Trading Nodes in Price Action?
Trading nodes are powerful tools for making informed trading decisions. Here’s how to effectively use them in your price action strategy:
1. Identify Key Nodes: Start by pinpointing significant trading nodes on your chart. These nodes represent high activity areas where the price has shown strong support or resistance. Use techniques like volume analysis, candlestick patterns, and moving averages to locate these nodes.
2. Set Entry and Exit Points: Trading nodes can help determine where to enter and exit trades. For instance, if the price approaches a support node, it might be a good entry point for a long position. Conversely, if the price nears a resistance node, it might signal an exit point or a short position.
3. Manage Risk: Trading nodes can also aid in risk management. Placing stop-loss orders just below support nodes or above resistance nodes helps limit potential losses. This approach ensures that if the price moves against your position, the loss is minimized.
4. Monitor Price Reactions: Pay attention to how the price reacts when it reaches a trading node. A strong reaction, such as a reversal or consolidation, can validate the node’s significance and influence your trading decisions.
5. Combine with Other Tools: Enhance your analysis by combining trading nodes with other technical tools like trend lines, Fibonacci retracements, and oscillators. This multi-faceted approach provides a more comprehensive view of the market and increases the reliability of your trading signals.
By integrating trading nodes into your price action strategy, you can make more precise and confident trading decisions.
Benefits and Limitations of Trading Nodes
Benefits:
1. Improved Decision Making: Trading nodes help traders make informed decisions by highlighting areas of significant market activity. This can lead to more accurate predictions of price movements.
2. Enhanced Risk Management: By identifying key support and resistance levels, traders can place stop-loss orders strategically, minimizing potential losses.
3. Versatility: Trading nodes can be applied across various markets, including stocks, forex, commodities, and cryptocurrencies. This makes them a flexible tool for different trading strategies.
4. Real-Time Analysis: Trading nodes allow for real-time analysis of market conditions, enabling traders to react quickly to changes and capitalize on opportunities as they arise.
5. Simplicity: Focusing on price action and trading nodes simplifies the analysis process by reducing reliance on complex indicators and algorithms.
Limitations:
1. Subjectivity: Identifying trading nodes can be subjective, as different traders may interpret price action differently. This can lead to inconsistent results.
2. False Signals: Not all trading nodes will result in significant price movements. Some nodes may produce false signals, leading to potential losses.
3. Market Conditions: Trading nodes may be less effective in certain market conditions, such as during periods of low volatility or in highly manipulated markets.
4. Requires Practice: Effectively identifying and using trading nodes requires practice and experience. Novice traders may find it challenging to accurately pinpoint these nodes without adequate training.
5. Limited Historical Data: Relying on past price action to predict future movements may not always account for unforeseen market events or changes in market sentiment.
Understanding both the benefits and limitations of trading nodes can help traders use them more effectively, maximizing their advantages while being aware of potential pitfalls.
Advanced Tips for Mastering Trading Nodes
Mastering trading nodes can elevate your trading strategy to new heights. Here are some advanced tips to help you make the most out of this concept:
1. Integrate Multiple Timeframes: Analyze trading nodes across different timeframes to gain a broader perspective. A node on a higher timeframe, like daily or weekly, holds more significance than one on a lower timeframe, such as hourly or minute charts.
2. Combine with Technical Indicators: While trading nodes rely heavily on price action, combining them with technical indicators like Moving Averages, Relative Strength Index (RSI), or Bollinger Bands can enhance your analysis. These indicators can provide additional confirmation for the significance of a trading node.
3. Monitor Market Sentiment: Pay attention to market sentiment and news events that could influence price movements. Trading nodes are more effective when aligned with the broader market context. Stay informed about economic announcements, earnings reports, and geopolitical developments that might impact the markets.
4. Backtesting: Before applying trading nodes in live trading, backtest your strategies on historical data. This practice helps you understand how trading nodes have behaved in past market conditions and refine your approach based on what works best.
5. Dynamic Adjustment: Trading nodes are not static. Adjust your nodes dynamically based on recent price action. Regularly update your charts to reflect the latest trading activity, ensuring your analysis remains relevant and accurate.
6. Volume Analysis: Combine node identification with volume analysis. High volume at a node indicates strong interest and can validate the node’s significance. Low volume might suggest a weaker node, potentially leading to less reliable trading signals.
7. Develop a Trading Plan: Incorporate trading nodes into a well-defined trading plan. Define your entry, exit, and risk management rules clearly. Having a structured approach helps maintain discipline and consistency in your trading activities.
By mastering these advanced tips, you can enhance your understanding of trading nodes and apply them more effectively in your trading strategy.
Read more: Learning about Market Structure, the basis of all trading strategies
Conclusion
Trading nodes are an effective tool in technical analysis, helping investors understand price trends and make better trading decisions. To use trading nodes effectively, it’s essential to recognize the different types and understand how each one forms.
Keep in mind that trading nodes are not infallible and can sometimes lead to losses. Therefore, always practice and adhere to proper risk management to safeguard your investments. By doing so, you can utilize trading nodes to their fullest potential and enhance your overall trading strategy.
FAQs
What makes trading nodes different from support and resistance levels?
Can trading nodes be used in all market types?
Are trading nodes effective in high-frequency trading?
What is the trading node pattern in price action?
How many types of trading nodes are there in technical analysis?
Are trading nodes always profitable?
پست مرتبط
پربازدیدترین ها
0


