What is the Dow Jones Industrial Average (DJIA)? Everything about Dow Jones and its symbols in Forex
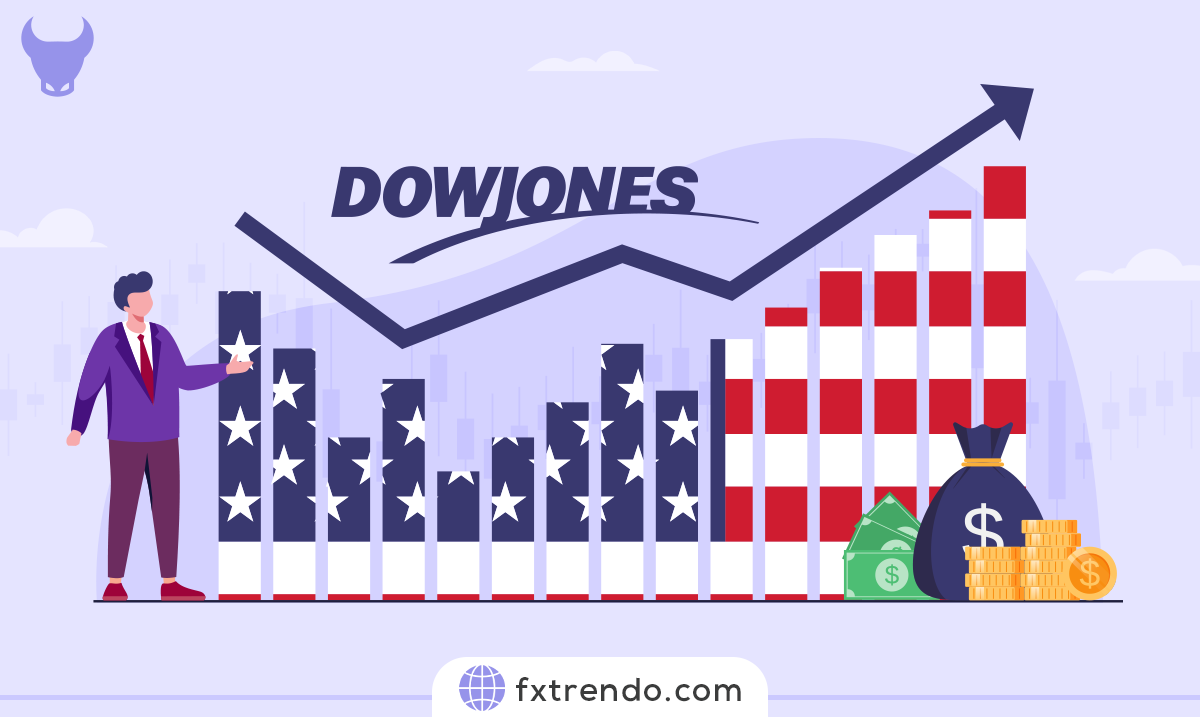

In the world of finance, the Dow Jones Industrial Average (DJIA) stands as a towering beacon, guiding investors through the ebbs and flows of the market. But what exactly is the DJIA? Simply put, it’s a price-weighted average of 30 significant stocks traded on the New York Stock Exchange (NYSE) and the NASDAQ. The “Dow,” as it’s often called, is one of the oldest, most well-known, and most frequently used indices in the world.
But the DJIA is more than just a number—it’s a reflection of the U.S. economy. Each “symbol” or company in the DJIA serves as a representative snapshot of the overall economic health. When you’re trading DJIA symbols in Forex, you’re not just trading individual companies—you’re trading pieces of economic history and future predictions.
Understanding the DJIA in its entirety can seem daunting, but it doesn’t have to be. In this post, we’ll demystify the Dow, breaking down its components, its calculation, and its impact on the Forex market. So whether you’re a seasoned trader or just starting out, you’ll find everything you need to navigate the fascinating world of the Dow Jones Industrial Average.
Contents
What is the Dow Jones Industrial Average (DJIA) or the Dow Jones Index?
The Dow Jones Industrial Average, known as the DJIA or “the Dow,” is a storied index that serves as a mirror to the U.S. economy’s might and momentum. It’s a select club of 30 blue-chip companies, representing a cross-section of American industry, from aerospace to technology. These aren’t just any companies; they are titans of their trades, influencing not just the stock market but the economy at large.
The DJIA is a price-weighted index, which means that the companies with higher stock prices carry more weight in its calculation. This is different from other indices that might use market capitalization as a yardstick for influence. The Dow’s methodology has stood the test of time, offering a simple yet effective way to gauge market trends.
But why does the DJIA matter to the average person? Because it’s a quick snapshot of economic confidence. When the Dow climbs, it often reflects optimism about the future, a belief in the robustness of industry and innovation. When it falls, it can signal caution, a collective pause as investors and the public alike take stock of challenges on the horizon.
Read More: Financial markets and their trading hours.
The History of the DJIA
The Dow Jones Industrial Average (DJIA) is not just a financial index; it’s a chronicle of American industrial progress and a testament to the vision of its founders. The story begins on May 26, 1896, when Charles Dow, a journalist, and Edward Jones, a statistician, introduced the DJIA to the world. Initially, it consisted of just 12 companies, most of which were in the industrial sector, reflecting the economic landscape of the time.
As America grew, so did the DJIA, expanding to include 30 companies by 1928. This growth mirrored the nation’s burgeoning industries, from railroads and cotton to gas, sugar, tobacco, and oil. Over the years, the composition of the DJIA has evolved, keeping pace with the changing face of the U.S. economy. It has seen the rise and fall of giants, the ebb and flow of sectors, and has withstood the tests of time and turmoil.
The DJIA’s method of calculation has also been a point of distinction. It is a price-weighted index, meaning that stocks with higher prices have a greater impact on the index’s overall movement. This method has been subject to debate but remains a core characteristic of the DJIA, distinguishing it from other market-cap weighted indices.
Through depressions, wars, and technological revolutions, the DJIA has stood as a steadfast indicator of economic health. It has become a barometer for investor sentiment and a beacon for those looking to gauge the vibrancy of American enterprise.
Components of the DJIA
1. 3M
2. American Express
3. Amgen
4. Apple
5. Boeing
6. Caterpillar
7. Chevron
8. Cisco
9. Coca-Cola
10. Dow
11. Goldman Sachs
12. Home Depot
13. Honeywell
14. IBM
15. Intel
16. Johnson & Johnson
17. JPMorgan Chase
18. McDonald’s
19. Merck
20. Microsoft
21. Nike
22. Procter & Gamble
23. Travelers Companies
24. UnitedHealth Group
25. Visa
26. Walmart
27. Walgreens Boots Alliance
28. Walt Disney
29. Verizon
30. Salesforce
Among these, Apple stands as a titan of technology, its products and services defining an era. Microsoft, another tech giant, shapes the digital landscape with its software, cloud services, and more. Goldman Sachs, a powerhouse in financial services, influences economies with its investment acumen. These companies, along with their peers in the DJIA, are more than just stock symbols; they are the engines of innovation and progress that drive the market forward.
How the DJIA Works
The Dow Jones Industrial Average (DJIA) is a fascinating financial instrument, a price-weighted index that serves as a thermometer for the U.S. economy’s health. But how exactly does it work? At its core, the DJIA is calculated by adding up the share prices of its 30 component companies and then dividing by a unique number known as the “Dow Divisor.” This divisor is adjusted in case of stock splits, spinoffs, or other structural changes to ensure the index’s continuity and reliability.
Unlike other indices that might be weighted by market capitalization, the DJIA’s price-weighting system gives greater influence to companies with higher stock prices. This means that a company with a higher share price will have a more significant impact on the index’s movement than a company with a lower share price, regardless of their total market value.
The DJIA’s methodology might seem straightforward, but it’s the subtleties that make it an essential tool for investors. It reflects not just the economic performance of its components but also the investor sentiment towards these titans of industry. When the Dow moves, it tells a story of confidence or concern, of bullish or bearish trends, making it an indispensable gauge for both the seasoned investor and the curious observer alike.
How to Calculate the Dow Jones Industrial Average?
The Dow Jones Industrial Average (DJIA) is a price-weighted index, which means its calculation is based on the price per share of its constituent companies. Unlike market-cap weighted indices, where a company’s size affects its influence on the index, the DJIA gives precedence to stock price. This method assigns more weight to companies with higher stock prices, making them more influential in the index’s overall movement.
To calculate the DJIA, one would add up the current share prices of the 30 companies and then divide this total by the Dow Divisor. The Dow Divisor is a critical element of this equation; it’s a figure used to normalize the index value given the prices of its component stocks. This divisor is regularly updated to account for corporate actions like stock splits, dividends, or changes in the index’s composition, ensuring the DJIA remains a consistent and reliable benchmark of the market.
Here’s a simplified formula for the DJIA:
The Dow Divisor ensures that events such as stock splits, which increase the number of a company’s outstanding shares without changing its overall value, do not distort the index.
By adjusting the divisor, the continuity and integrity of the DJIA are maintained, allowing it to serve as a historical measure of market performance. This price-weighted approach provides a clear view of the market’s direction, as influenced by the price movements of some of the largest and most established companies in the U.S. economy.
DJIA Symbols in Forex
In forex, the Dow Jones Industrial Average (DJIA) stands as a symbol of economic might, but it is not a currency that can be directly traded. Instead, the DJIA is a stock market index, a collective measure of 30 of the United States’ most significant and influential companies.
For those looking to engage with the DJIA within the forex space, there are financial instruments that allow for indirect exposure. Index futures and exchange-traded funds (ETFs) are the most common tools that investors use to reflect the DJIA’s performance in their portfolios.
Index futures tied to the DJIA enable traders to speculate on the future direction of the index. These futures contracts are agreements to buy or sell the value of the DJIA at a predetermined price on a set future date, allowing for both hedging and speculative opportunities.
Exchange-traded funds (ETFs), such as those designed to track the DJIA, offer a more straightforward investment approach. These funds hold a diversified portfolio of stocks that correspond to the DJIA’s constituents, thus mirroring the index’s performance. They provide a practical way for investors to invest in the collective output of the DJIA’s companies without having to purchase each stock individually.
While the DJIA itself is not tradable in the forex market, these related instruments provide a bridge for investors and traders looking to harness the economic indicators the DJIA represents. Through futures and ETFs, the DJIA’s influence extends beyond the stock market, offering a glimpse into the broader economic landscape and allowing for strategic investment decisions.
Advantages of Using the Dow Jones Industrial Average (DJIA)
The Dow Jones Industrial Average (DJIA) stands as a cornerstone of the financial world, offering a wealth of benefits to those who use it as a market barometer. Here are some of the key advantages:
Snapshot of Market Health: The DJIA provides a quick and clear snapshot of the market’s health, encapsulating the performance of 30 major U.S. companies into a single, digestible figure.
Historical Benchmark: With its origins dating back to 1896, the DJIA offers a historical benchmark against which current market performance can be measured, providing context for market trends over time.
Blue-Chip Representation: The index represents blue-chip companies, which are typically industry leaders with a reputation for stability, making the DJIA a reflection of solid and reliable market performance.
Economic Indicator: The DJIA acts as a leading economic indicator, offering insights into the broader economic landscape and investor sentiment.
Diversification: The diversity of industries represented in the DJIA means it can offer a more balanced view of the economy than indexes focusing on a single sector.
Investor Accessibility: The DJIA’s composition of well-known companies makes it accessible and understandable for both seasoned investors and the general public.
Leverage for Investment Products: The DJIA is used as a basis for various investment products, including ETFs and mutual funds, allowing investors to easily gain exposure to the index’s performance.
The DJIA’s role as a trusted and widely recognized index makes it an invaluable tool for anyone looking to gauge the pulse of the U.S. economy and the stock market. Its ability to distill complex market dynamics into a single figure makes it an essential component of the financial landscape.
Disadvantages of the DJIA


The Dow Jones Industrial Average (DJIA) is a prominent financial index, but it’s not without its limitations. Here are some disadvantages to consider:
Narrow Representation: The DJIA consists of only 30 companies, which may not provide a full picture of the market. Other indices that include a larger number of stocks might offer a more comprehensive overview.
Price-Weighted Bias: The unique price-weighted methodology of the DJIA means that companies with higher stock prices have a greater impact on the index. This can lead to a skewed representation of the market, as it doesn’t reflect the actual size or economic impact of the companies.
Infrequent Updates: The composition of the DJIA is updated less frequently than other indices. This can result in a lag in reflecting current market changes and emerging industry trends.
Economic Indicator Limitations: While often used as a barometer for the U.S. economy, the DJIA is not a direct measure of economic performance and may not align with other economic indicators.
These points underscore the importance of considering multiple indices and economic indicators for a well-rounded view of the financial landscape.
Comparing the Dow Jones Index and Other Financial Indices
When we place the Dow Jones Industrial Average (DJIA) alongside other financial indices, we see a rich tapestry of market indicators, each with its own story to tell.
S&P 500: The S&P 500 offers a broader canvas than the DJIA, capturing the performance of 500 large-cap U.S. stocks across various sectors. It’s a market-cap weighted index, which means the size of the company plays a pivotal role in its influence on the index. This contrasts with the DJIA’s price-weighted system, where the stock price is the determining factor.
NASDAQ Composite Index: The NASDAQ Composite Index is a tech-heavy beacon, including over 3,000 companies from the NASDAQ stock exchange. It’s also market-cap weighted, giving more weight to larger companies, unlike the DJIA’s price-weighted approach, which can amplify the influence of high-priced stocks.
Global Indices: Venturing beyond U.S. shores, the DJIA is paralleled by global indices like the FTSE 100 and Nikkei 225. The FTSE 100 reflects the performance of the 100 largest companies listed on the London Stock Exchange and offers a more sector-diverse perspective. The Nikkei 225, similar to the DJIA in its price-weighted methodology, tracks 225 prominent Japanese companies, providing insight into Asia’s economic landscape.
Each index, with its unique methodology and composition, provides a different lens through which to view the market’s performance, and together, they offer a comprehensive picture of global economic health.
Conclusion
The Dow Jones Industrial Average (DJIA) is a key indicator of U.S. economic health, reflecting the performance of 30 blue-chip companies.
However, its focus on a limited number of companies and price-weighted methodology may not fully represent the broader market. Despite these limitations, the DJIA remains a vital tool for investors, providing a snapshot of American industrial strength and economic trends. As you navigate the financial landscape, let the DJIA be your guide, but also seek to understand the wider market.
Remember, financial literacy is a lifelong journey filled with continuous learning. Stay curious, informed, and committed to your financial education.
Frequently Asked Questions (FAQs)
What is the Dow Jones Industrial Average (DJIA)?
What does the DJIA represent?
How is the DJIA calculated?
What are the symbols in the DJIA?
Is the DJIA a good indicator for forex trading?
How often is the DJIA updated?
Can I trade the Dow Jones directly?
Where can I learn more about forex trading?
پست مرتبط
پربازدیدترین ها
0


