Multi-time frame (MTF) or Time analysis for trading in the forex market


Contents
Intro
The forex market is a global market for buying and selling currency. The forex market and other financial markets are displayed in different periods, each of which is called a time frame. If your chart is on the candlestick mode and you choose a one-day time frame, the formation of each candle requires one day, and it is called a daily time frame, when you set it on the 5-minute time frame, a candle will be formed based on the information exchanged in the 5 minutes. Traders can have a broader market viewpoint by analyzing it in different time frames.
What is Multi-time frame (MTF) analysis?
Multi-Time Frame Analysis (MTF) is a technical analysis approach that involves analyzing a currency pair in different time frames. You can check a currency pair in multiple time frames simultaneously without any special restrictions, but we recommend doing this in three different time frames for optimal trading. This approach gives traders a broader view of the market, helps traders determine the overall trend, identify potential trend corrections, and identify optimal entry and exit points. MTF is based on the concept that what happens in a larger time frame is more important, and one should look for movements in the smaller time frame in the direction of the larger time frame.
For example: if the daily chart's trend is upward, we look for upward trends in the lower time frame, and whenever there is a sign of an upward trend formation in the lower time frame, it is time to enter the trade. A trader can gain insight into overall market trends and make more informed decisions by examining multiple timeframes.
How do you set different time frames for MTF trades?
The trader usually chooses three time frames with a ratio of 1/4 or 1/7 to make MTF trades:
- Long-term time frame
- Mid-term time frame
- Short-term time frame (trading time frame)
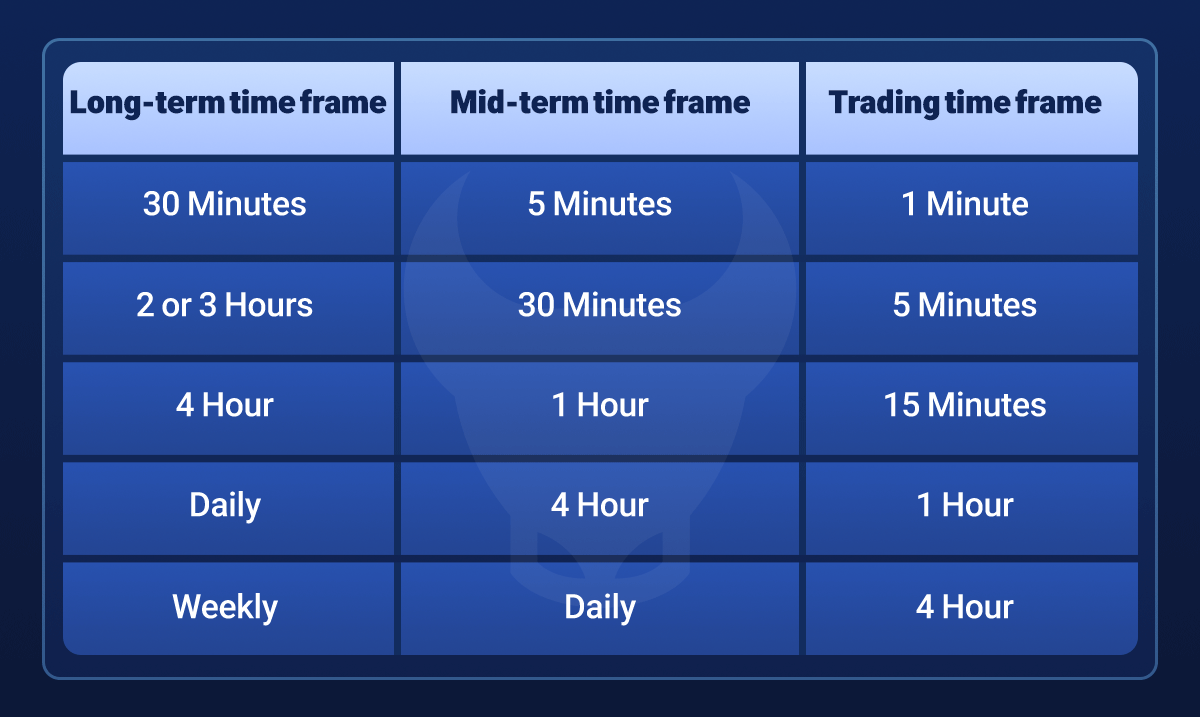
Long-term time frame: Used to identify the general trend. At first, you refer to your long-term time frame and recognize the market's general trend. If your trading time is 15 minutes, your long-term time frame is 4 hours, and if your trading time is one hour, your long-term time is daily.
Mid-term time frame: It is usually a time frame that is one-fourth to one-seventh the length of the long-term time frame. Traders use it to get long-term trend confirmation and a more accurate view of the overall trend. If your trading time is 15 minutes, your mid-term time is one hour, and if your trading time is one hour, your mid-term time is 4 hours.
Short-term time frame: Used to fine-tune entry and exit points. This timeframe is your trading time frame in which you identify corrections against the higher time trend and enter the trade in the direction of the higher time trend. (You can change the time frames' ratio according to your trading strategy, style, and analysis tools. For example, when the trading time frame is 15 minutes, you can also use a daily time frame for a long-term time, but the ratios and cases explained are the optimized mode of multi-timeframe trading.)
The below image shows how to divide trading time frames for three periods. In this table, the mid-term time frame is calculated as 4 to 7 times the trading time frame, and the long-term time frame is calculated as 4 to 7 times the mid-term time frame. You can optimize these times according to your strategy and suit your trading style.
How do you analyze the three trading time frames together?
When all three time frames are combined to evaluate a currency pair, the trader can effortlessly improve the chances of a successful trade regardless of the other rules applied to the strategy. Performing analysis from the top to the bottom of the time frame forces the trader to trade in a higher time direction, and this seemingly simple point alone leads to an increase in the trade's success chance and reduces its risk because the probability of market movement in the higher time frame direction is greater.
For example : If the larger time frame's trend is bullish, but the mid-term and short-term trends are bearish, then, we must use smaller TPs with caution in trading. On the other hand, a trader may wait until the two long-term and mid-term time frames are in the same direction, and the trading time frame starts to move in their path after the correction. This trading style can give the trader excellent risk to rewards.
Read More: What is a currency pair?
A practical example of how to do multi-timeframe trading


You are a trader in the 15-minute time frame who uses ceilings and floors to identify market trends. To make the trade, you first check the 4-hour timeframe and use the market's ceiling and floor to identify the trend in this period. Then refer to the mid-term time frame and define the trend in the one-hour time frame.
If the trend is going in the same direction on the long-term and medium-term timeframes, go to trading time and determine the trend. When the trend is going in the same direction on all three time frames, look for weak corrections against the trend direction to enter the trade on the trading time frame, and look for confirmation to form a trend in the higher time direction when you see a correction, and enter the transaction in the trend direction when seeing the confirmation.
Read More: The best time to trade currency pairs in Forex
MTF trading Advantages
- Identifies the trend better
- Improved risk management
- More accurate entry and exit
- Identifies the change in market structure
- Identifies significant support and resistance levels
Identifies the trend better: By looking at multiple time frames, traders can understand the overall trend better. For example, what may look like a downtrend on the 15-minute chart, could only be a correction in an uptrend for the 4-hour time frame. In identifying the market trend, the trend in higher time is a priority, and the preference is to trade in the direction of the higher time trend.
Improved risk management: It can help traders recognize potential trend corrections early and avoid entering trades going against the larger trend. The trend's strength is more in higher time frames, and when you enter the transaction in the direction of the higher time frame, if the market moves against your trade's direction, this corrective movement will not last long in most cases, and the market will start moving in the higher time frame's direction again.
More accurate entry and exit: Traders can likely increase their profits and reduce losses by fine-tuning entries and exits in the short term. When you know which direction the market's main trend is, you can enter trades in the market corrections and exit at the trend's end, which is very helpful to do your transactions with a low stop loss and higher risk to reward.
Identifies the change in the market structure: The change in the market structure usually starts from a lower time frame and then reaches higher time frames. When you check the market in a multi-timeframe, with a change in the market trend in a lower time frame, you can expect this change to transfer to higher time frames as well, and this can help you in what states to enter the transaction and in what conditions to be an observer.
Identifies significant support and resistance levels: Support and resistance levels used in higher and lower time frames are usually high strength levels, and often the price reacts appropriately to these levels.
MTF Disadvantages
- Complexity
- Inconsistent signals
- Over-analysis risk
Complexity: MTF requires experienced traders to monitor and analyze multiple charts simultaneously, which can be complex and time-consuming. Using this trading method can be confusing for new traders at the beginning.
Inconsistent signals: Sometimes, different timeframes can give conflicting signals. For example, the daily chart may show an uptrend while the hourly chart shows a downtrend. Traders should have rules for these conditions.
Over-analysis risk: Given a large amount of information, there is a risk of over-analysis, which can lead to indecision or confusion. Expecting a currency pair's behavior to be as expected in several different time frames may lead to hesitation and not making the right decision by the trader.
Summary
Multi Time Frame (MTF) analysis can be a valuable tool to help forex traders. It can potentially increase trading profitability by providing a broader view of the market and helping to identify trends, correct trends, and optimize entries and exits. However, like all trading tools, traders must use it with other technical and fundamental analysis tools to be most effective.


