As one of the primary trading tools for price prediction and trading decisions, technical analysis has many details. With a deep understanding of price patterns and charts, professional traders strive to have optimal entry and exit points and increase their trading efficiency. In technical analysis, candlestick patterns have particular importance. With the Japanese candlesticks’ help, you can predict the price trend. Candlesticks are very easy to use, which is why many technicians use them to draw better conclusions in their analysis. Further, we will discuss the hammer pattern and its types as one of the most important candlestick patterns. Stay tuned.
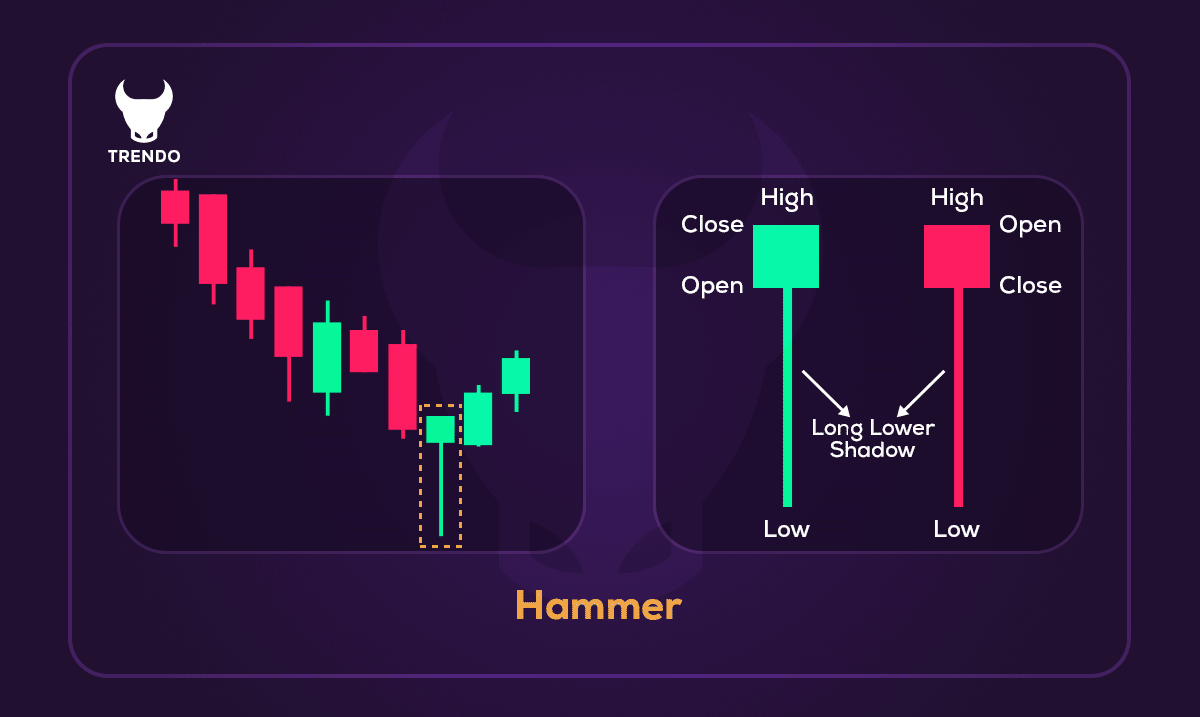
In technical analysis, the hammer candlestick pattern is one of the most significant candlestick chart patterns. As the name suggests, this pattern in a standing hammer form represents a change in the price movement’s direction. This pattern’s main feature is a small candlestick body with a long shadow. Hammer patterns indicate a change in the current market trend. For example, this pattern implies a decrease in the sellers’ power in a downtrend. The long shadow of this candle indicates that the sellers’ efforts to reduce the price further have met the buyers’ resistance, and in the end, we see the price increase. You must consider the following points in identifying this pattern:
- The candle has a small body.
- In the downtrend, the lower shadow should be at least twice the size of the body, and in the uptrend, the upper shadow should be at least twice the size of the candle’s body.
- In the downtrend, the upper shadow is very short or does not exist, and in the uptrend, the lower shadow is very short or does not exist.
Hammer Pattern Types
This pattern splits into two descending and ascending categories, which we will discuss further.
Bearish Hammer
This candle forms when buyers intend to raise the price, but the sellers or bears enter the market and do not allow the price to increase, and in the end, the candle’s closing price records as lower than the opening price. As a result, we will have a bearish hammer.
Bullish Hammer
This candle forms when the sellers intend to reduce the price, but the buyers or bulls enter the market and do not allow the price to decrease, and in the end, the candle’s closing price records higher than the opening price. As a result, we will have a bullish hammer.
The hammer pattern psychology
The hammer candlestick pattern is a reversal pattern traders use to detect the end of a corrective move or a trend’s end. The bullish hammer pattern’s psychology is that at some point, the sellers took control of the price and pushed the price down, but the buyers came in and reversed the upward movement of the price, and the price reached near the candle’s high. Likewise, the bearish hammer pattern’s psychology is that at some point, the buyers took control of the price and increased it, but the sellers entered and reversed the downward movement, and the price reached the candle’s low.
The hammer pattern confirmation
Traders combine this pattern with other technical analysis methods, such as moving averages, trend lines, etc., to increase trading efficiency. Developing and testing a trading strategy depends on your personality and trading style, and you must create your suitable strategy by trial and error and backtesting from the price chart. This process may take a long time, and you should never start trading on a real account until you reach a stable and profitable strategy. These tips and advice are simple but very effective and will ensure your survival in the market.
How to trade with the hammer pattern
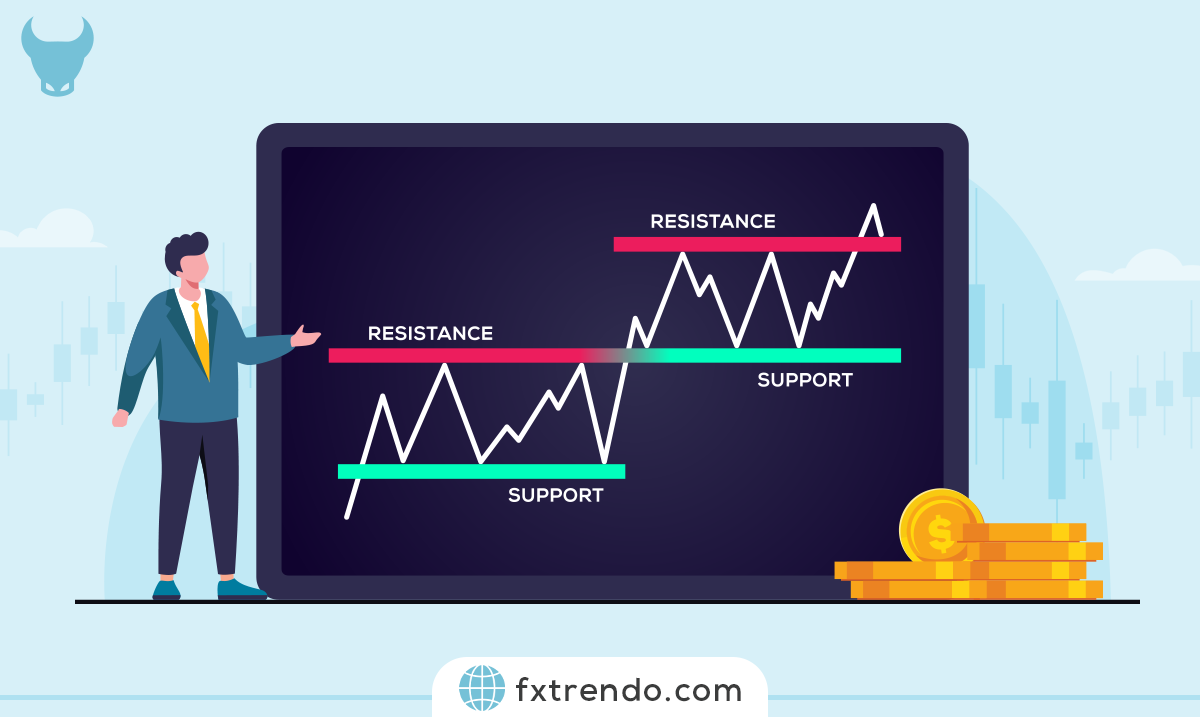
Determining the trend:
The most significant principle in technical analysis is determining the market trend. All trading tools and strategies make sense only in line with the market trend. So, first, determine the market trend.
Candle type:
After determining the market trend, you must wait for this pattern to be created. At this stage, you must wait until the candle closes.
Pattern Confirmation:
You should not enter a trade against the trend immediately after the hammer pattern’s formation. Wait for the price confirmation from the market and enter the trade only after the confirmation candle closes (a candle in line with the new trend) to reduce the trading risk.
Placing take-profit and stop-loss:
Always use automatic take-profit and stop-loss to reduce risk in case of sudden price movements.
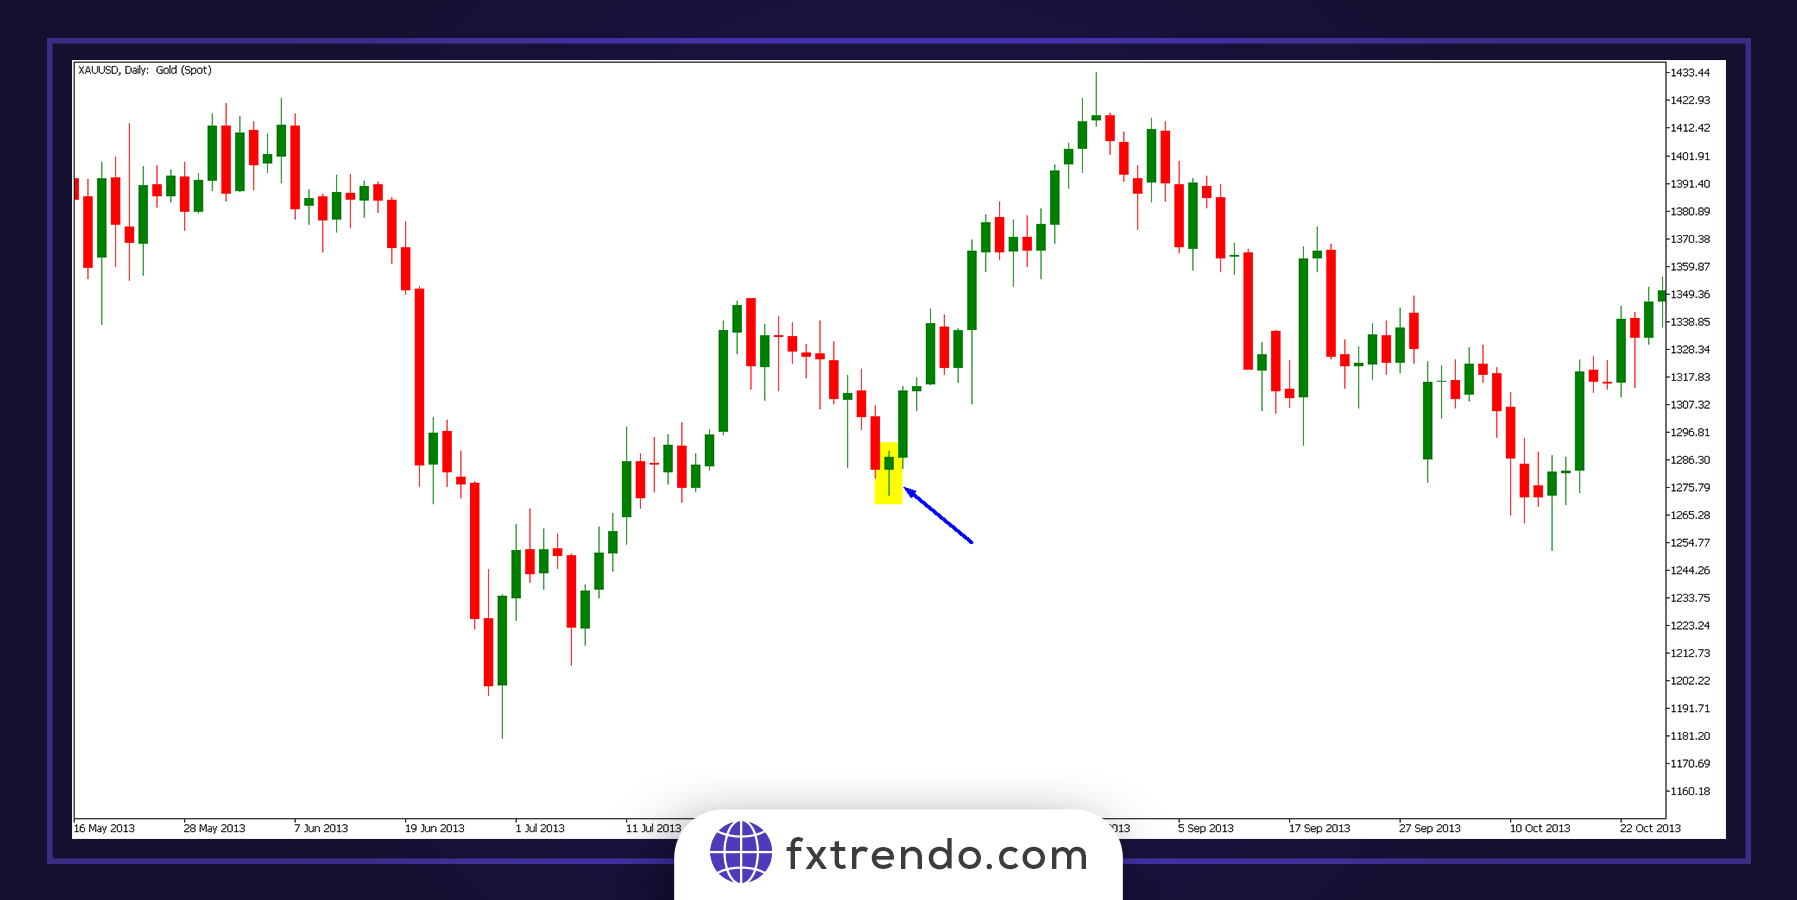
The hammer pattern examples
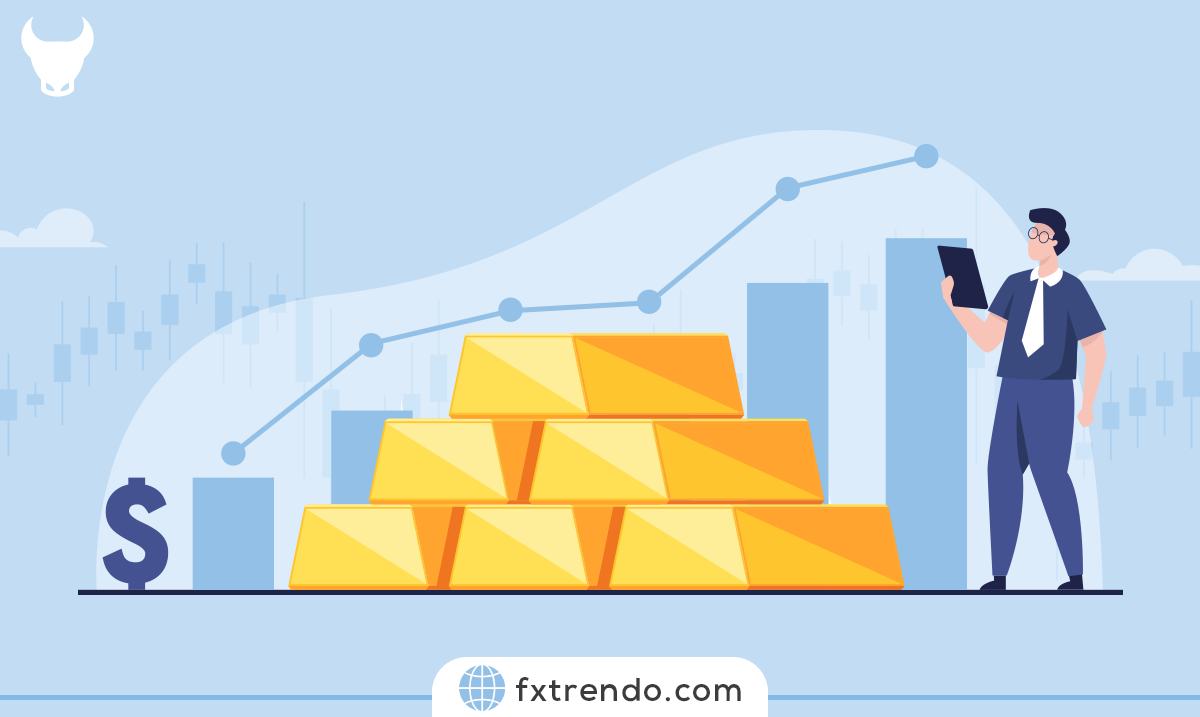
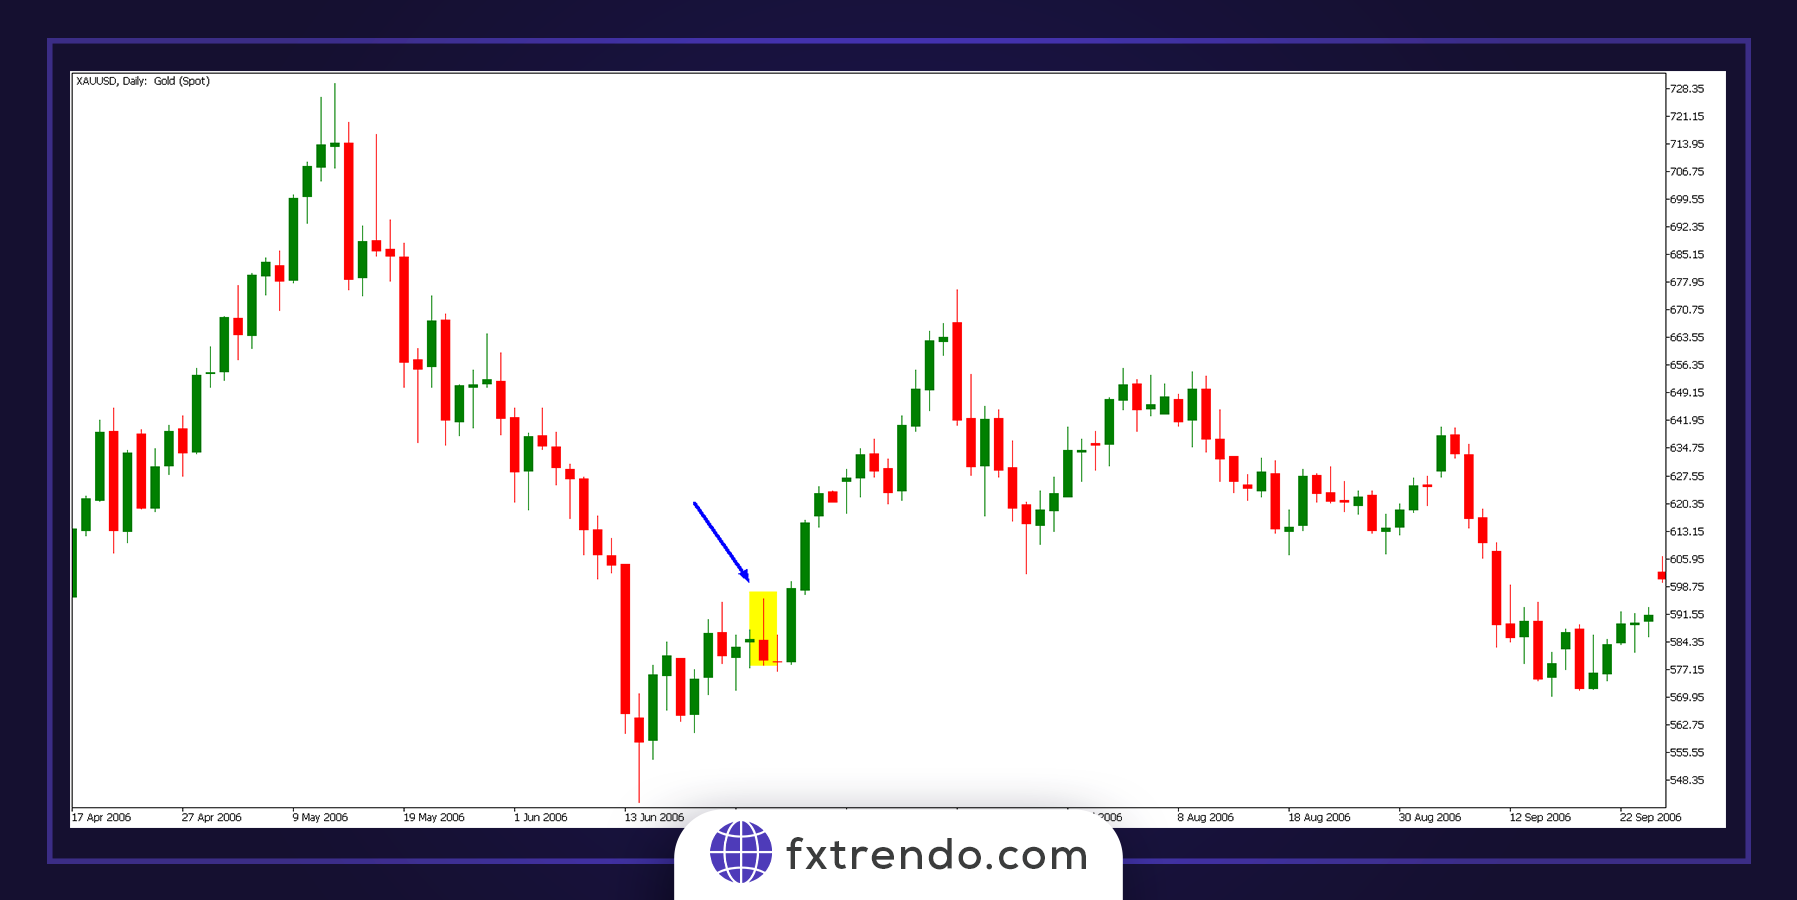
We see an uptrend in the first example of the global ounce (XAUUSD) on the daily chart (D1), the corrective wave of this trend ends with a hammer candle, and the price continues the uptrend. You could enter a buy trade after the confirmation candle closes.
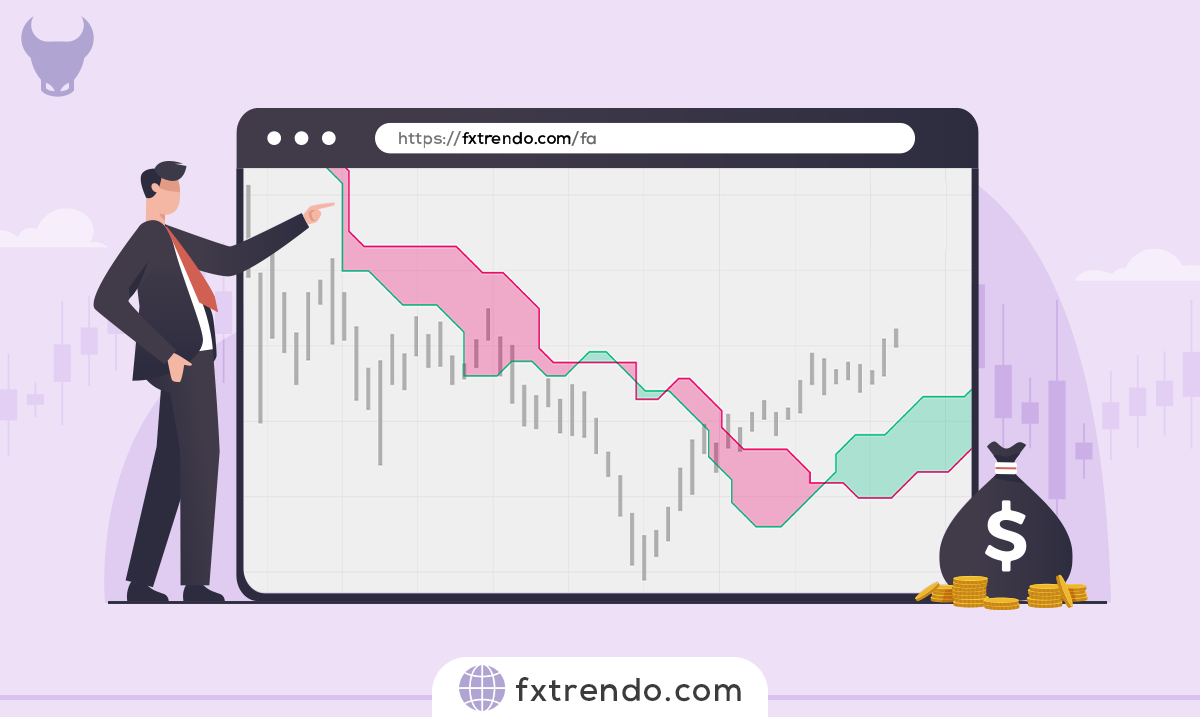
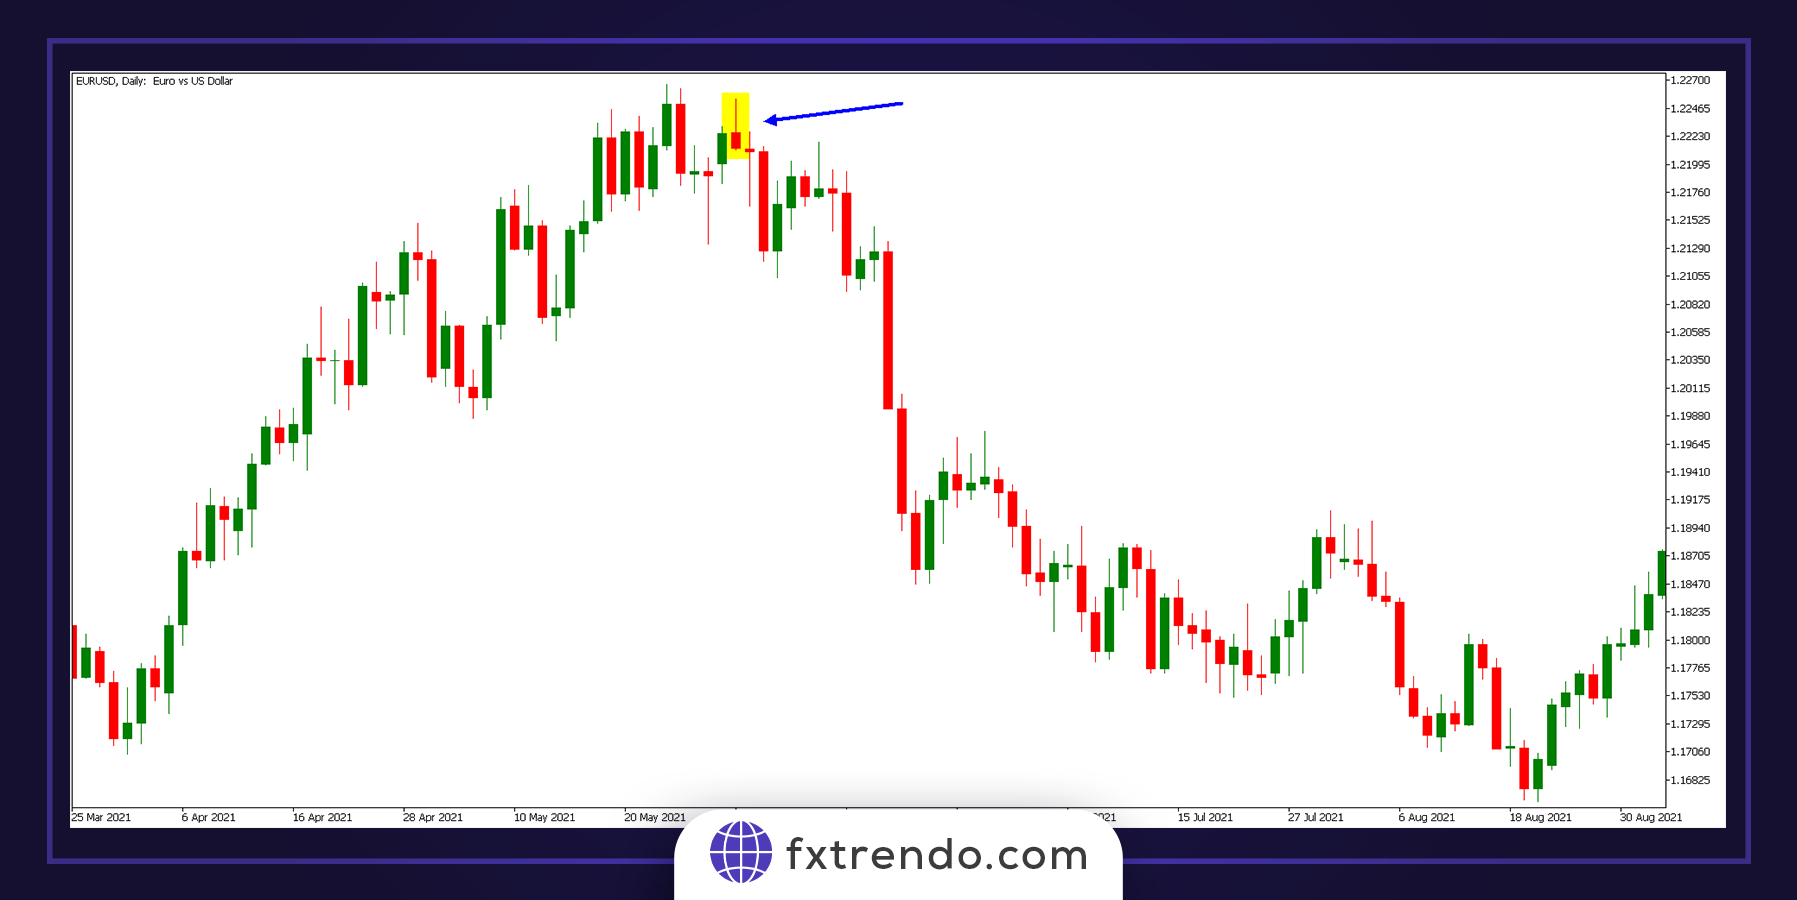
The market uptrend ends with a hammer candle, and a new downtrend begins in the second example of EURUSD on the daily chart (D1). In this case, when the hammer candle indicates the end of a trend, the trade has a higher risk than the previous case (the hammer pattern at the corrective movement’s end), but if the pattern is successful, you can take a good risk-to-reward (R/R) from the market. To enter a trade, you could have entered a sell trade after the confirmation candle closed.
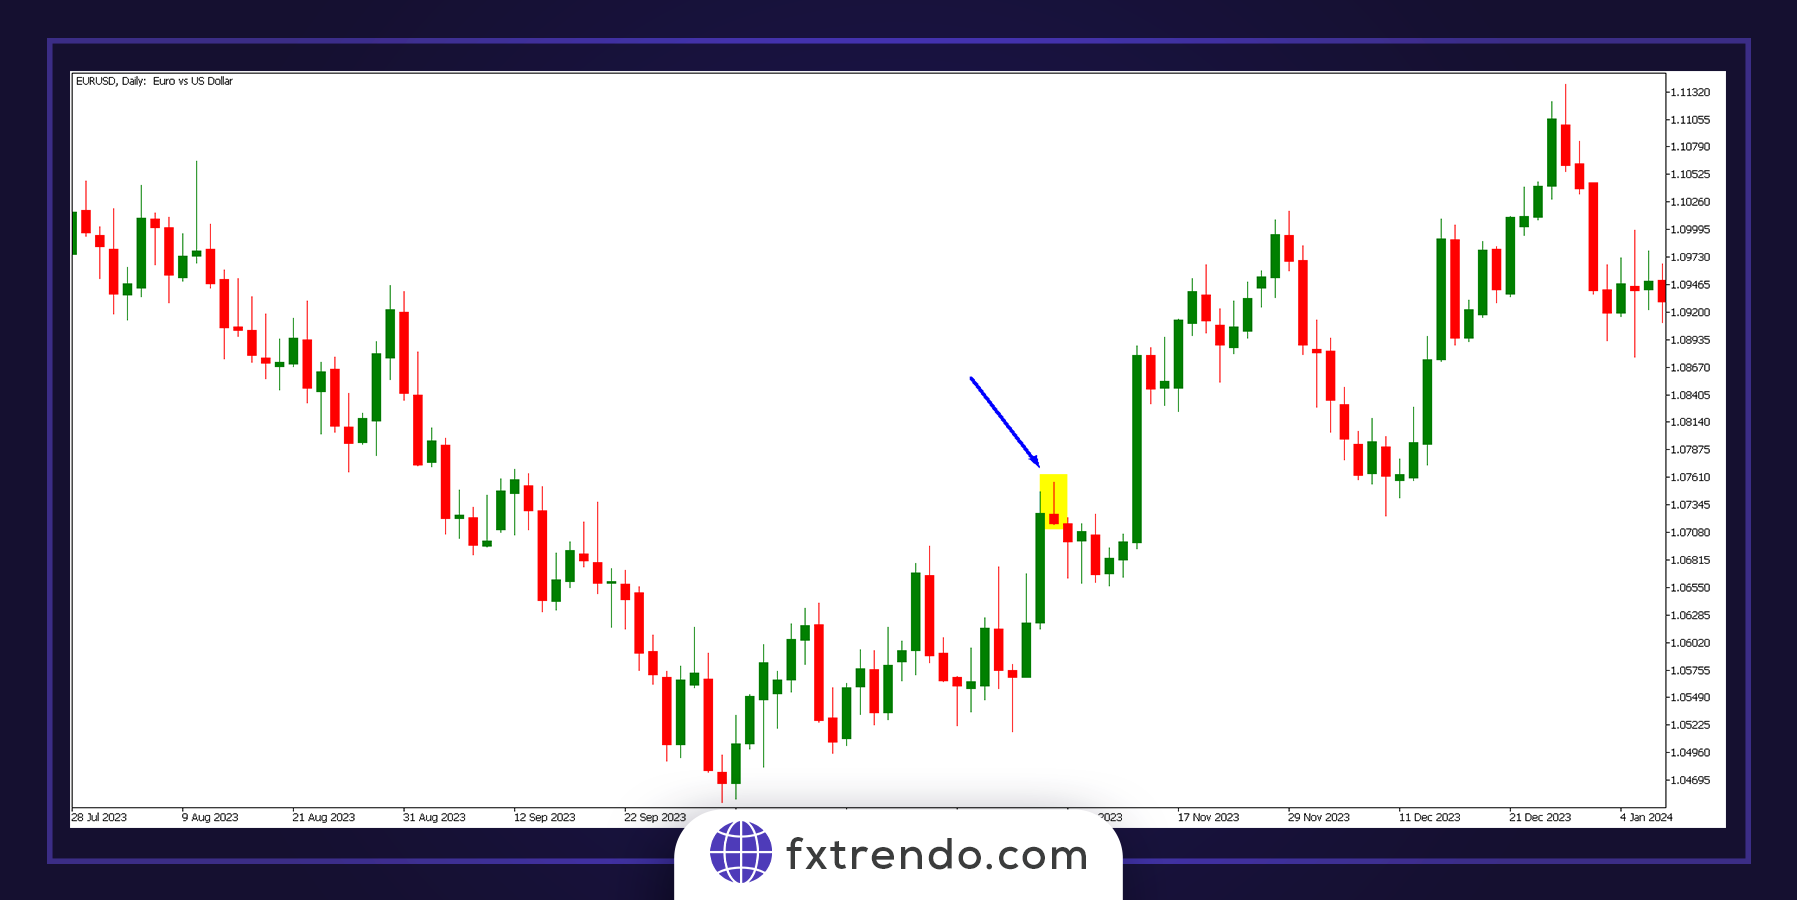
The hammer pattern violation example
The hammer pattern will sometimes cause you losses like all technical analysis methods. That is why capital management is always emphasized. Trading is more of an art than a scientific process, an art that requires a lot of experience and practice. Stay tuned with two examples of Hammer pattern violation from the EURUSD currency pairs and Global ounce.
Summary
We discussed the hammer pattern types and how to trade with them in this article. The pattern’s name does not matter in the candlestick field, and you must be very familiar with the psychology behind each candlestick. To use candlestick patterns better, try to use higher time frames such as daily and 4-hour, and we do not recommend searching for candlestick patterns in lower time frames. Lastly, remember to never enter the financial markets with money that its loss would affect your usual routine.