

Quasimodo Reversal Patterns (QM), commonly referred to as qm in trading, is an advanced reversal pattern, the formation of which signals the end of a trend, and most traders use its variants to improve trading results in the forex market.
Welcome to the world of Quasimodo Reversal Patterns (QM). This guide will reveal the secrets of mastering QM patterns, showing you how to identify and use them effectively in your trades.
What is the Quasimodo Pattern and Why is it Important?
The qm trading pattern in forex is a powerful reversal pattern in price action. In simple terms, it forms when the price, after creating a lower low (in a downtrend) or higher high (in an uptrend), fails to continue the previous structure and shows signs of trend weakening and a potential reversal. This qm pattern works similarly to the inverse Head and Shoulders but focuses directly on the Break of Structure (BOS) in the market.
In technical analysis and price action, QM is used to identify precise reversal points at the end of trends, helping traders find low-risk entries with high profit potential, as part of qm in trading.
The main difference between the qm trading pattern and classic patterns like Head and Shoulders or Double Top/Bottom is that QM does not require perfect symmetry. It relies more on supply/demand levels and the QML (Quasimodo Level), and it often appears in ranging markets or after strong impulses. These features make it a unique and effective tool for modern traders.
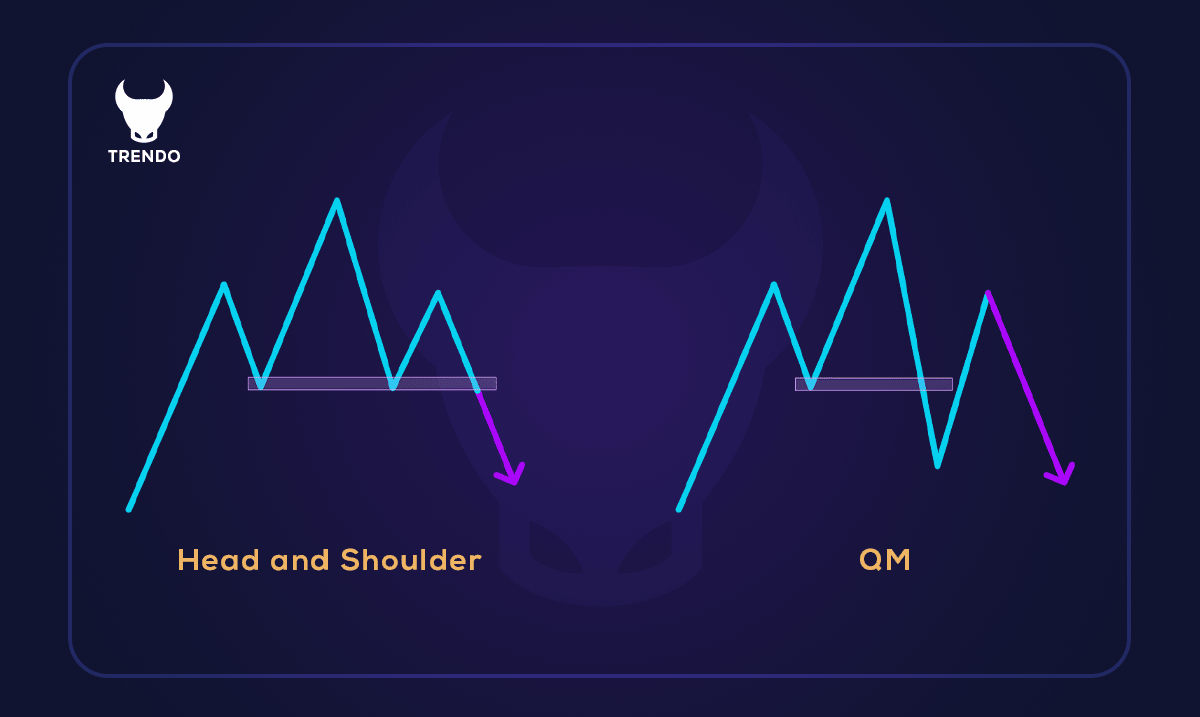
Difference Between qm Setup and Head and Shoulders Pattern
During the formation of the Head and Shoulders pattern, if the second wave is fully engulfed (Engulf), we get the qm pattern. The second difference is in the entry point: entry in the Head and Shoulders setup occurs slightly later than in the quasimodo pattern.
Complete Structure of the Quasimodo (QM) Pattern
The QM setup is a reversal pattern that occurs at the end of trends. In its simplest form, it looks like this:
Generally, there are two types of QM setups:
- Bullish qm (qm buy pattern)
- Bearish qm (qm sell pattern)
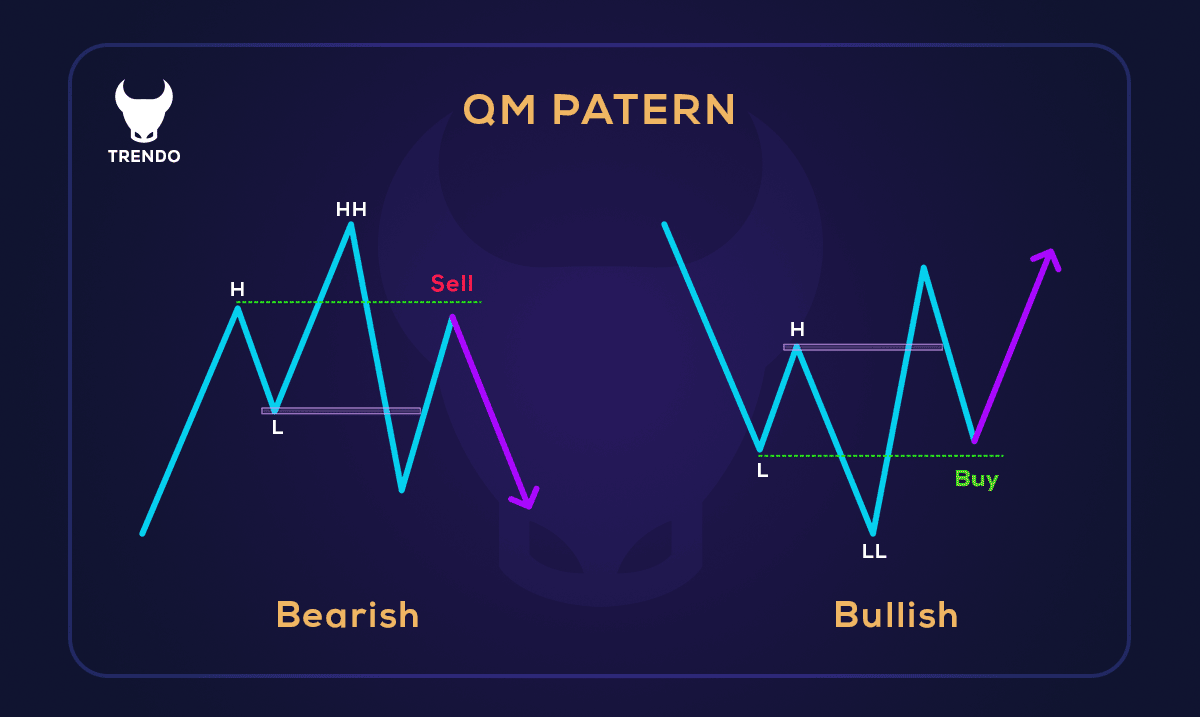
Suppose we are in an uptrend where price is making higher highs and higher lows, until it reaches a strong resistance that causes a reversal and breaks the last low with a candle close—in other words, a CHOCH (Change of Character) occurs. Now, as a final effort, price retraces and usually reaches the green line marked in the image, forming the Quasimodo pattern. From this zone, we expect a price drop. For a downtrend, the reverse applies, and after reaching the designated zone, we expect a price rise. Note that in this pattern, the left shoulder does not need to equal the right shoulder; they can be unequal.
The qm trading pattern consists of five key points that challenge the market structure:
- Left Shoulder: The first low (in bullish QM) or high (in bearish QM) that is part of the previous trend.
- Head: The lower low (in bearish) or higher high (in bullish) that forms the extreme point of the pattern and indicates continued trend momentum.
- Right Shoulder: The higher low (in bearish) or lower high (in bullish) that forms after the head and shows trend weakening.
- Break of Structure (BOS): Price confirms the reversal by breaking the left shoulder (going above it in bullish or below in bearish).
- Entry Point and QML: QML is the level equal to the left shoulder; the best entry is after a pullback to this level and BOS confirmation.
This simple yet powerful structure predicts sharp reversals.
Supporting Tools for Confirming the Quasimodo (QM) Pattern
To access a successful qm trading strategy in forex, always combine it with supporting tools to reduce false signals and achieve more precise entries. The practical approach is as follows:
- Supply and Demand Zones with QM: The best QMs are valid when the QML exactly overlaps with a demand zone (for buys) or supply zone (for sells). First, mark fresh zones, then wait for QM to form on the same zone. This combination multiplies the chance of a strong price reaction.
- Support and Resistance Levels: The QML should align with a key historical level (previous broken support/resistance). If the right shoulder reverses exactly from a Fibonacci level (like 61.8% or 78.6%), the pattern’s validity increases significantly.
- Confirmation with Indicators like RSI and MACD: In RSI, divergence at the head (e.g., RSI makes higher high but price makes lower low) is a strong reversal signal. In MACD, a zero-line cross or histogram divergence after the right shoulder confirms entry. Only enter after seeing these signals.
- Recommended Timeframes for Greater Validity: Identify the pattern on higher timeframes (like H4 or Daily) to see the overall trend, then switch to lower timeframes (like H1 or M15) for precise entry. This multi-timeframe method increases QM validity and avoids minor noise.
With these combinations, only trade QMs with at least two confirmations; this practical approach significantly boosts win rate and allows confident trading.
Trading Strategy with the QM Pattern | Step-by-Step Guide
To practical using of qm trading strategy in forex trading, follow these steps precisely:
- Pattern Identification: At the end of a downtrend (for bullish QM) or uptrend (for bearish QM: qm sell pattern), look for the head formation (lower low/higher high) followed by the right shoulder. Mark QML equal to the left shoulder.
- Pattern Confirmation: Wait for Break of Structure (breaking the left shoulder). At least two supporting tools (e.g., demand zone + RSI divergence) should confirm the break.
- Practical Entry Point: The best entry is a Limit Order on QML after pullback. If price reverses directly, enter after retesting QML and forming a confirmatory candle (like Pin Bar or Engulfing).
- Precise Risk Management: Always place Stop Loss below the head (for buys) or above the head (for sells)—typically risk 1-2% of the account. Calculate the distance from entry to SL and adjust position size accordingly (e.g., if 50 pips distance and 1% risk = $100, choose lot size so 50 pips = $100). Never risk more than 1-2% per trade. If near major news, halve risk or wait.
- Exit and Targets: Set initial target at the opposite previous structure (e.g., prior high/low). Risk-reward ratio at least 1:2. Take partial profit (50%) at first target and manage the rest with trailing stop (to new highs/lows).
By practicing these steps on demo, you can turn QM into your main strategy while keeping risk controlled.
Final Words
The Quasimodo pattern (qm pattern) is one of the most powerful reversal patterns in price action, helping traders identify trend reversal points with high accuracy. Focusing on market structure breaks and key supply/demand levels (QML) is a key point of using QM in trading. It provides low-risk entries with excellent risk-reward ratios. Unlike classic patterns like Head and Shoulders, QM requires no symmetry and often appears at the end of strong trends or in ranging areas, making it an ideal tool for modern traders.
For success with this pattern, always combine it with confirmatory tools like supply/demand zones, Fibonacci levels, indicator divergences (such as RSI or MACD), and multi-timeframe analysis. Precise risk management—placing stop loss below/above the head and targeting at least 1:2 RR—is key to long-term profitability.
Ultimately, no single qm pattern is enough in trading. View the qm trading pattern in forex as part of a comprehensive strategy, practice it on demo accounts, and apply it with patience and discipline. By mastering this pattern, you can hunt sharp market reversals and elevate your trading performance. Success in forex requires continuous practice and emotional control—the qm pattern can be one of your best choices on this journey!