


How to Trade Using Heikin Ashi? Ultimate Guide to Trade Using Heikin Ashi Candlestick

In this article, we will examine the Heikin Ashi candle and discuss its features.
Unlike traditional candlestick charts, Heikin Ashi smooth out price data to create a more visually appealing and easier-to-read chart. This can be especially helpful for traders who want to reduce market noise and focus on the bigger picture.
Whether you’re a seasoned trader or just starting out, understanding how to trade using Heikin Ashi can give you a significant edge in the market.
So, grab a cup of coffee, get comfortable, and let’s explore the benefits and strategies of trading with Heikin Ashi candlesticks!
Contents
What is Heikin Ashi?
Heikin Ashi, meaning “average bar” in Japanese, is a charting technique used in trading to identify market trends more clearly. Unlike traditional candlestick charts, Heikin Ashi charts smooth out price data to make trends easier to spot.
Heikin Ashi uses a different formula to calculate each candlestick, averaging the open, high, low, and close prices. This averaging process filters out minor fluctuations and highlights the overall trend direction.
In a typical candlestick chart, you might see many ups and downs even if the market is generally moving in one direction. This can make it hard to decide when to enter or exit a trade. Heikin Ashi charts show a smoother progression.
When the market is in an uptrend, the candles will generally be green or white, and during a downtrend, they will be red or black. This visual clarity is helpful for traders.
However, Heikin Ashi charts do have some limitations. Because they average the price data, they can obscure some details, such as gaps in the market. This means they might not be the best tool for every trading strategy, but they are valuable for trend analysis.
Read more: Comparing the Forex market & Cryptocurrency; Which one is better?
Differences between Heikin Ashi and Traditional Candlestick Charts
Heikin Ashi and traditional candlestick charts are both popular tools in trading, but they have some key differences that impact how traders interpret market data.
1. Calculation Method: Traditional candlestick charts use the actual open, high, low, and close prices of each period to form their candles. Heikin Ashi charts use an averaging method, resulting in a smoother appearance.
2. Trend Identification: Heikin Ashi charts highlight trends more clearly by smoothing out price data, showing fewer fluctuations. Traditional candlestick charts can be more volatile and show more frequent changes in color, making trends harder to identify.
3. Visual Clarity: Heikin Ashi charts often display more consecutive candles of the same color, helping traders quickly identify market direction. Traditional candlestick charts can switch colors frequently, reflecting actual price movements but making the chart more cluttered.
4. Reaction to Market Noise: Heikin Ashi charts filter out market noise, reducing the impact of minor price movements and false signals. Traditional candlestick charts, while more detailed, can sometimes be overwhelming with the amount of information they present.
5. Use in Trading Strategies: Heikin Ashi charts are useful for trend-following strategies, helping traders stay in trades longer by providing a clearer view of the trend. Traditional candlestick charts, with their detailed price information, are often preferred for strategies requiring precise entry and exit points, such as day trading or scalping.
6. Limitations: Heikin Ashi charts can obscure details like price gaps and exact opening and closing prices, which can be a drawback for some strategies. Traditional candlestick charts provide a more detailed view of the market, crucial for certain trading decisions.
Briefly, both Heikin Ashi and traditional candlestick charts have their strengths and weaknesses. Heikin Ashi charts offer a smoother view of market trends, ideal for trend analysis. Traditional candlestick charts provide detailed price information, essential for precise trading strategies
Advantages of Using Heikin Ashi for Trading
Heikin Ashi charts offer several advantages that can make trading more effective and less stressful:
1. Clear Trend Identification: Heikin Ashi charts smooth out price data, making it easier to identify market direction. This clarity helps traders spot trends quickly and accurately, reducing decisions based on short-term fluctuations.
2. Reduced Market Noise: By averaging price data, Heikin Ashi charts filter out minor price movements and false signals. This reduction in noise allows traders to focus on the overall trend rather than small, insignificant changes.
3. Better Decision-Making: With clearer trends and less noise, traders can make more informed decisions. Heikin Ashi charts help traders stay in profitable trades longer and avoid premature exits, potentially leading to higher profits.
4. Visual Simplicity: Heikin Ashi charts are visually simpler and less cluttered than traditional candlestick charts. This simplicity makes it easier for traders to read and interpret the charts, especially during fast-moving markets.
5. Enhanced Trend Reversals: Heikin Ashi charts can provide early signals of trend reversals. By showing a series of candles with consistent color changes, traders can anticipate potential shifts in market direction and adjust their strategies accordingly.
6. Versatility across Time Frames: Heikin Ashi charts are effective across various time frames, from short-term intraday trading to long-term investing. This versatility makes them a valuable tool for traders with different strategies and time horizons.
7. Improved Emotional Control: Trading can be emotionally challenging, especially during volatile markets. Heikin Ashi charts help traders maintain emotional control by providing a clearer, more stable view of the market, reducing the stress and anxiety associated with trading decisions.
Disadvantages of Using Heikin Ashi for Trading
While Heikin Ashi charts offer many benefits, they also have some drawbacks:
1. Delayed Signals: Heikin Ashi charts average price data, which can introduce a time lag. This delay means that signals for entering or exiting trades might come later than on traditional candlestick charts. For traders who need to make quick decisions, this lag can be a disadvantage.
2. Lack of Precision: Heikin Ashi charts do not show the exact opening and closing prices for each period. This lack of precision can be problematic for traders who rely on specific price points for their strategies. It can also obscure important details like price gaps.
3. Not Ideal for Short-Term Trading: Due to the smoothing effect, Heikin Ashi charts are less effective for short-term trading strategies like scalping. The averaged data can make it harder to spot short-term price movements and quick reversals, which are crucial for these strategies.
4. Learning Curve: Traders accustomed to traditional candlestick charts might find Heikin Ashi charts challenging to interpret at first. Understanding how the averaging process affects the chart and learning to read the signals correctly can take some time.
5. Potential for Misinterpretation: The smoothing effect can sometimes lead to misinterpretation of the market’s true condition. Traders might overlook important market signals because the chart appears more stable than it actually is. This can result in missed opportunities or incorrect trading decisions.
6. Limited Use as a Standalone Tool: Heikin Ashi charts are best used in conjunction with other indicators. Relying solely on Heikin Ashi can lead to incomplete analysis, as it does not provide all the necessary information for making well-rounded trading decisions.

How Is Heikin Ashi Calculated?
The formula for calculating Heikin Ashi candles is as follows:
Heikin Ashi Opening Price: 1/2 (previous candle's opening price + previous candle's closing price)
Heikin Ashi Highest Price: The highest of the three values: highest price, opening price, or closing price.
Heikin Ashi Lowest Price: The lowest of the three values: lowest price, opening price, or closing price.
Heikin Ashi Closing Price: 1/4 (opening price + closing price + highest price + lowest price).
How to Read Heikin Ashi Charts?
Reading Heikin Ashi charts can be a game-changer for traders looking to identify trends more clearly. Here’s a simple guide to help you understand how to read these charts:
1. Color of the Candles: The color of Heikin Ashi candles is crucial. Green candles indicate an uptrend, while red candles signify a downtrend. A series of green candles suggests a strong upward movement, whereas a series of red candles points to a downward trend.
2. Body of the Candles: The body of the candle represents the difference between the open and close prices. A long body indicates strong buying or selling pressure. For instance, a long green body shows strong buying pressure, while a long red body indicates strong selling pressure.
3. Shadows (Wicks): The shadows or wicks of the candles provide additional information about the trend’s strength. A green candle with no lower shadow suggests a strong uptrend, while a red candle with no upper shadow indicates a strong downtrend. If the candles have long shadows, it might signal a potential reversal or indecision in the market.
4. Trend Continuation and Reversal: Heikin Ashi charts help in identifying trend continuation and potential reversals. A series of green candles with no lower shadows indicates a strong and continuous uptrend. Conversely, a series of red candles with no upper shadows signals a strong and continuous downtrend. If you notice small bodies with both upper and lower shadows, it might indicate a trend reversal or consolidation phase.
By understanding these key elements, you can effectively read Heikin Ashi charts and make more informed trading decisions.
Heikin Ashi Trading Strategies
Heikin Ashi charts are a valuable tool for traders, offering several strategies to capitalize on market trends. Here are some effective Heikin Ashi trading strategies:
1. Trend Following: This strategy involves identifying and following the direction of the market trend. With Heikin Ashi charts, traders can easily spot trends due to the smoothed price data. When the chart shows consecutive green or white candles, it indicates an uptrend, and traders can consider buying. Conversely, consecutive red or black candles indicate a downtrend, suggesting selling or shorting opportunities.
2. Breakout Strategy: The breakout strategy focuses on identifying points where the price breaks through a significant level of support or resistance. Heikin Ashi charts help filter out noise, making it easier to spot genuine breakouts. Traders look for a series of candles moving in one direction, breaking through previous highs or lows, to confirm a breakout.
3. Pullback Strategy: In a pullback strategy, traders wait for a temporary reversal within a larger trend. For example, in an uptrend, a few red or black candles might appear before the trend resumes. Traders can use these pullbacks as buying opportunities, entering the market at a lower price before the uptrend continues.
4. Crossover Strategy: This strategy involves using moving averages in conjunction with Heikin Ashi charts. Traders look for crossovers between short-term and long-term moving averages to identify potential entry and exit points. For instance, when a short-term moving average crosses above a long-term moving average, it signals a buying opportunity.
5. Reversal Strategy: The reversal strategy aims to identify points where the current trend is likely to change direction. Heikin Ashi charts can provide early signals of trend reversals. Traders look for a change in candle color, from green/white to red/black or vice versa, along with small candle bodies and shadows on both sides, indicating indecision and a potential reversal.
6. Support and Resistance Levels: Heikin Ashi charts can also be used to identify key support and resistance levels. Traders look for areas where the price has repeatedly bounced off a certain level, using these points to make informed trading decisions. When the price approaches these levels, traders can anticipate potential reversals or breakouts.
Combining Heikin Ashi with Other Indicators
Combining Heikin Ashi with other technical indicators can enhance your trading strategy by providing more comprehensive market insights. Here are some effective ways to integrate Heikin Ashi with other indicators:
1. Moving Averages: Using moving averages with Heikin Ashi charts can help confirm trends and identify potential entry and exit points. For example, a common strategy is to use a short-term moving average (like the 20-day) and a long-term moving average (like the 50-day). When the short-term moving average crosses above the long-term moving average, it signals a buying opportunity. Conversely, when it crosses below, it signals a selling opportunity.
2. Relative Strength Index (RSI): The RSI is a momentum oscillator that measures the speed and change of price movements. Combining RSI with Heikin Ashi can help identify overbought or oversold conditions. When the RSI is above 70, the market is considered overbought, and when it is below 30, it is considered oversold. These signals can be used alongside Heikin Ashi trends to make more informed trading decisions.
Read more: Relative Strength Index (RSI) Indicator
3. Bollinger Bands: Bollinger Bands consist of a middle band (a moving average) and two outer bands that represent standard deviations from the middle band. When combined with Heikin Ashi, Bollinger Bands can help identify periods of high or low volatility. For instance, if Heikin Ashi candles are consistently touching the upper band, it may indicate an overbought condition, while touching the lower band may indicate an oversold condition.
4. MACD (Moving Average Convergence Divergence): The MACD is a trend-following momentum indicator that shows the relationship between two moving averages of a security’s price. When combined with Heikin Ashi, the MACD can help confirm trend strength and potential reversals. A bullish signal occurs when the MACD line crosses above the signal line, and a bearish signal occurs when it crosses below.
5. Support and Resistance Levels: Identifying support and resistance levels can be crucial when using Heikin Ashi charts. These levels indicate where the price tends to find support as it falls or resistance as it rises. Combining these levels with Heikin Ashi trends can help traders make better decisions about when to enter or exit trades.
6. Volume Indicators: Volume indicators, such as the On-Balance Volume (OBV) or Volume Weighted Average Price (VWAP), can provide additional context to Heikin Ashi charts. High trading volume during a trend can confirm its strength, while low volume may indicate a potential reversal.
In summary, combining Heikin Ashi with other indicators like moving averages, RSI, Bollinger Bands, MACD, support and resistance levels, and volume indicators can provide a more robust trading strategy. This integrated approach helps traders validate signals, reduce false readings, and make more informed decisions.
Common Mistakes to Avoid When Trading with Heikin Ashi
Trading with Heikin Ashi charts can be highly effective, but there are common mistakes that traders should avoid to maximize their success:
1. Ignoring Time Frames: Heikin Ashi charts work best on longer time frames, such as 4-hour or daily charts. Using shorter time frames, like 1-hour charts, can result in false signals and less reliable results. Stick to longer time frames to get a clearer picture of the market trends.
2. Overlooking Stop Losses: Not adjusting stop losses is a common mistake. Heikin Ashi charts can smooth out price data, but this can also delay signals. Ensure your stop losses are set appropriately to protect against unexpected market movements.
3. Misinterpreting Doji Candles: Doji candles, which have small bodies and long shadows, indicate indecision in the market. When these appear frequently, it can signal a sideways market. Avoid trading during these periods as the market direction is unclear.
4. Relying Solely on Heikin Ashi: While Heikin Ashi charts are useful, relying on them alone can lead to incomplete analysis. Combine Heikin Ashi with other indicators like moving averages, RSI, or MACD to confirm trends and make more informed decisions.
5. Ignoring Market Conditions: Heikin Ashi charts are less effective in choppy or sideways markets. Be aware of the overall market conditions and avoid trading when the market lacks a clear trend.
6. Failing to Recognize Trend Reversals: Heikin Ashi charts can sometimes delay the recognition of trend reversals due to their smoothing effect. Pay attention to other indicators and signals that might suggest a change in trend direction to avoid staying in a trade too long.
7. Overtrading: Trading too frequently based on Heikin Ashi signals can lead to losses, especially in volatile markets. Be patient and wait for clear signals before making a trade.
Tips and Best Practices for Trading with Heikin Ashi
Technical analysis & trading using Heikin Ashi can be highly effective if you follow some key tips and best practices. Here are a few to keep in mind:
1. Combine with Other Indicators: While Heikin Ashi is great for identifying trends, combining it with other indicators like moving averages, RSI, or MACD can provide stronger confirmation signals. This helps you make more informed trading decisions.
2. Use Higher Time Frames: Heikin Ashi charts tend to be more reliable on higher time frames, such as daily or weekly charts. This reduces the noise and provides a clearer picture of the overall trend.
3. Be Patient: One of the main advantages of Heikin Ashi is its ability to smooth out price data. However, this also means that it might lag behind real-time price movements. Be patient and wait for clear signals before entering or exiting trades.
4. Identify Strong Trends: Look for a series of consecutive green or red candles with no shadows on the opposite side. This indicates a strong trend and can be a good time to enter a trade.
5. Watch for Reversals: Pay attention to changes in candle color and the appearance of shadows on both sides of the candles. These can be early signs of a potential trend reversal.
6. Set Stop-Loss Orders: Always use stop-loss orders to protect your capital. Heikin Ashi can help you identify trend direction, but it’s essential to have a risk management strategy in place.
7. Practice on a Demo Account: Before applying Heikin Ashi strategies in a live trading environment, practice on a demo account. This allows you to get comfortable with the technique and refine your strategy without risking real money.
Conclusion
In this article, we studied and analyzed Heikin Ashi candle patterns in financial markets. We outlined the Heikin Ashi calculation formula and explained how to read these candles. Traders can benefit from Heikin Ashi to enter trades aligned with the main trend.
However, Heikin Ashi is not suitable for short-term trading and scalping, as it displays price movements with a lag (delay).
FAQs
How do you trade with Heikin-Ashi?
What is the best Heikin Ashi trading strategy?
Which time frame is best for Heikin Ashi?
What is the best indicator to pair with Heikin Ashi?
What is the Heikin Ashi 5 rule?
The Heikin Ashi 5 rule includes:
1. Green candles with upper wicks and large bodies indicate a strong upward trend.
2. Red candles with lower wicks and large bodies indicate a strong downward trend.
3. Doji candles (small bodies with upper and lower wicks) signify indecision and potential trend change.
4. Long upper wicks suggest growing selling interest.
5. Long lower wicks suggest growing buying interest.
Do professional traders use Heikin Ashi?
Why not to use Heikin Ashi?
What are the disadvantages of Heikin Ashi?
Is Heikin Ashi profitable?
Related Post
What Days Is Forex Closed?
The answer to On what days is Forex closed? is given In this article.
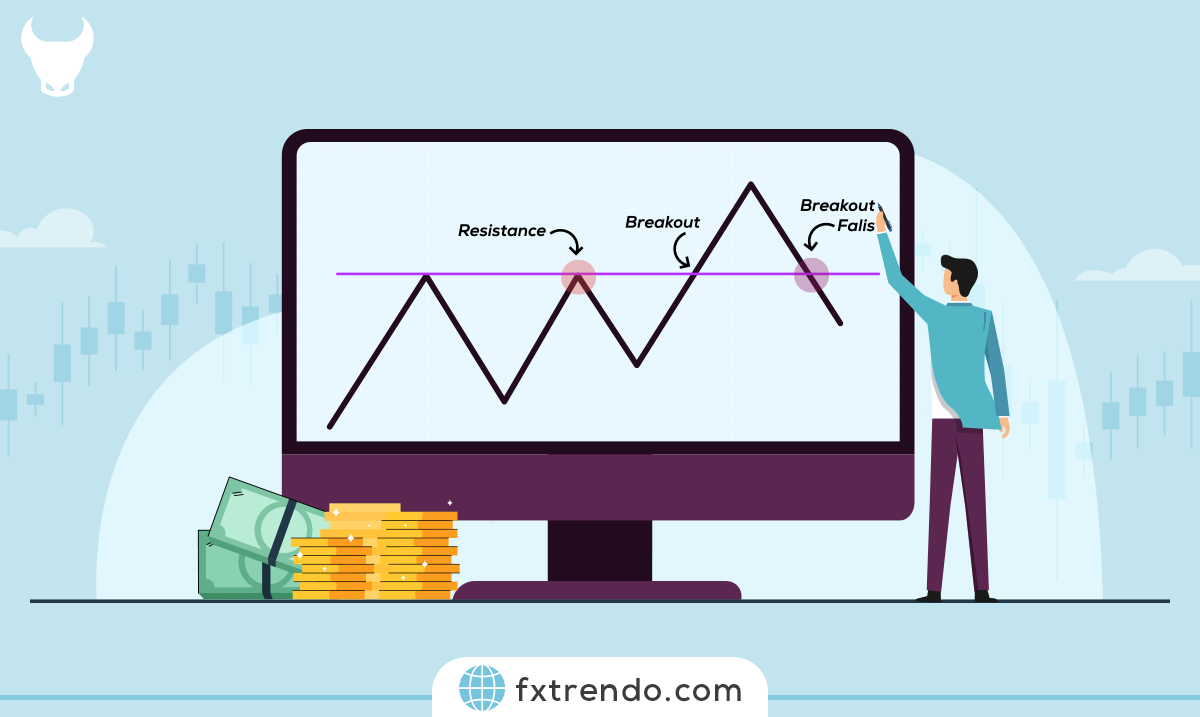
How to Recognize a Fake Breakout?
Fake breakouts in financial markets are referred to as breaking the support or resistance levels and returning to the previous trading range. In most cases, traders get fooled by this move and end up with losses.
What is Stop Loss? (Importance of Stop Loss in trading)
Introduction and review of Stop Loss and why it must be used.
most visited

")


 in Forex & How to Use it in Trading?")
