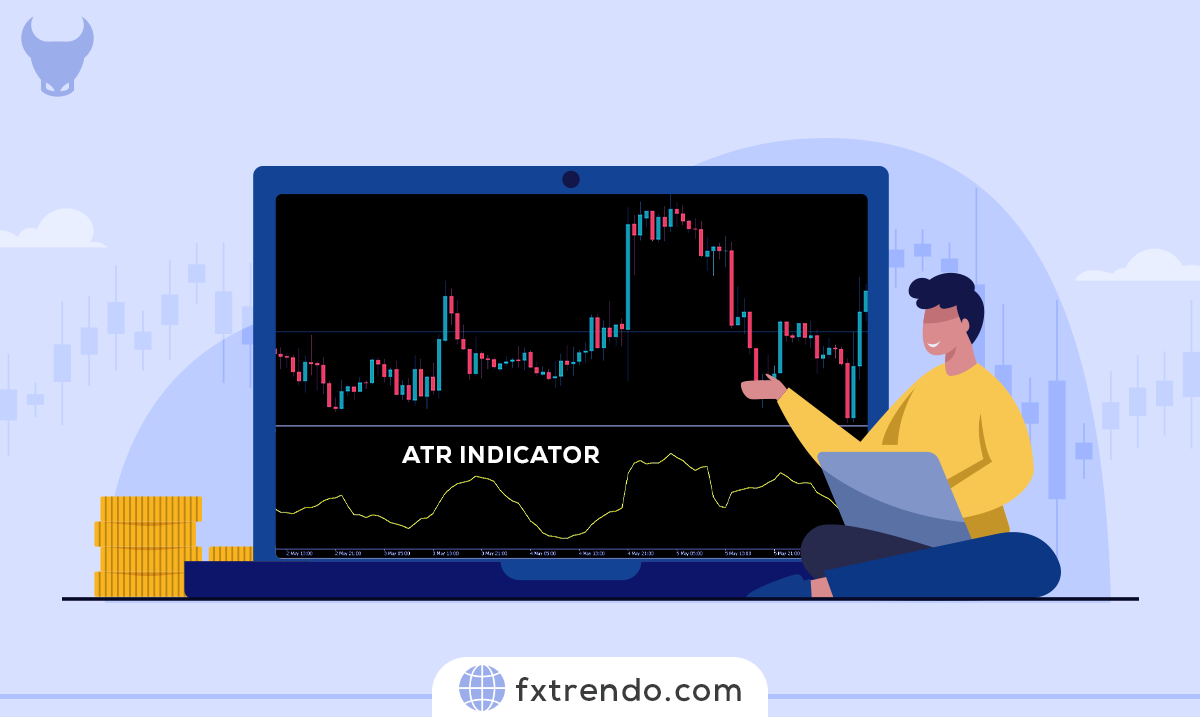
This momentum oscillator, developed by George Lane in the 1950s, helps traders identify potential trend reversals by comparing closing prices to their trading range over a specific period.
Think of it as a weather forecast for the market, predicting whether conditions are overbought or oversold. By understanding these signals, traders can make more informed decisions, potentially increasing their chances of success. Whether you’re a seasoned trader or just starting out, mastering the Stochastic Indicator can be a game-changer.
In this comprehensive guide, we’ll dive into everything you need to know about using the Stochastic Indicator for Forex trading, from its basic principles to advanced strategies. Ready to enhance your trading skills? Let’s get started!
What is the Stochastic Oscillator?
The Stochastic Oscillator is a momentum indicator used in technical analysis to gauge the speed and momentum of price movements. Developed by George C. Lane in the late 1950s, this tool helps traders identify potential market reversals by comparing a security’s closing price to its price range over a specific period.
The Stochastic Oscillator operates on a scale of 0 to 100, where readings above 80 indicate that the asset might be overbought, and readings below 20 suggest it could be oversold. This range-bound nature makes it a valuable tool for spotting overbought and oversold conditions in the market.
The indicator consists of two lines: %K and %D. The %K line represents the current closing price’s position relative to the high-low range over a set period, while the %D line is a simple moving average of %K. When these lines intersect, it can signal a potential reversal in the market trend.
Imagine you’re tracking a stock’s performance. The Stochastic Oscillator helps you see if the stock is overbought (priced too high) or oversold (priced too low) by generating values between 0 and 100. When the indicator is above 80, it suggests the stock might be overbought. Conversely, a reading below 20 indicates it might be oversold.
How Does Stochastic Indicator Work in Forex Trading?
The Stochastic Indicator is a valuable tool for Forex traders, helping them gauge market momentum and potential reversal points. It works by comparing a currency pair’s closing price to its price range over a specific period, typically 14 periods. This comparison helps traders understand whether the market is overbought or oversold.
Here’s how it works: The Stochastic Indicator generates values between 0 and 100. When the indicator is above 80, it suggests that the currency pair might be overbought, meaning it’s trading at a higher price than its recent average. Conversely, a reading below 20 indicates that the currency pair might be oversold, trading at a lower price than its recent average.
Traders use these signals to make informed decisions. For example, if the Stochastic Indicator shows an overbought condition, a trader might anticipate a price drop and consider selling. On the other hand, an oversold condition might signal a potential price increase, prompting a trader to buy.
Additionally, the Stochastic Indicator can highlight potential trend reversals. If a currency pair has been in an uptrend but the Stochastic Indicator starts to decline, it might indicate that the upward momentum is weakening, suggesting a possible trend reversal. By using this indicator, traders can better time their entries and exits, aiming to maximize profits and minimize risks.
How to Calculate Stochastic Indicator in Forex?
The Stochastic Indicator consists of two main parameters: “%K” and “%D,” which are calculated as follows:
Calculating the %K Parameter
%K is one of the two main variables of the Stochastic Indicator and shows traders how the current price of an asset compares to its price range over a specific period. The %K parameter is calculated as follows:
%K = (C – LN) / (HN – LN) * 100
Where C is the closing price of the candle, LN is the lowest closing price among the previous N candles, and HN is the highest closing price among the previous N candles. Typically, a period of 14 is used in stochastic calculations.
Calculating the %D Parameter
The other main variable in the Stochastic Indicator is %D, which is a moving average of the %K parameter. Traders usually choose a period of 3 for this simple moving average.
Now that you’re familiar with the basic calculations of this indicator, there’s no need to worry about doing these calculations manually. Simply sign up with a broker like Trendo, go to the indicators section on the trading platform, and select the Stochastic Indicator. The calculations will be done automatically and online, allowing you to use this tool to identify key overbought or oversold points.
Advantages of Using the Stochastic Oscillator
The Stochastic Oscillator offers several key advantages for traders, making it a valuable tool in technical analysis.
Early Identification of Trend Reversals
The Stochastic Oscillator can identify potential trend reversals early by signaling when a currency pair is overbought or oversold. This helps traders anticipate market direction changes and make timely decisions.
Clear Entry and Exit Signals
It provides clear visual signals for entering and exiting trades. When the %K line crosses above the %D line in the oversold region, it signals a buy. Conversely, when the %K line crosses below the %D line in the overbought region, it signals a sell. These straightforward signals help traders make confident decisions.
Versatility Across Markets
The Stochastic Oscillator can be applied to various markets, including Forex, stocks, and commodities. This flexibility makes it useful for traders operating in multiple markets, providing consistent signals across different environments.
Complementary to Other Indicators
It works well with other technical indicators. Combining it with moving averages or trend lines can enhance its effectiveness, helping traders confirm signals and reduce false positives.
Easy to Understand and Use
The Stochastic Oscillator is easy to understand and use, even for beginners. Its simple design and clear signals make it accessible to traders with varying experience levels, allowing them to quickly incorporate it into their strategies.
By leveraging these advantages, traders can better analyze market conditions, make informed decisions, and improve their overall trading performance.
Disadvantages of Using the Stochastic Oscillator
While the Stochastic Oscillator is a valuable tool for traders, it has some limitations.
False Signals
The Stochastic Oscillator can generate false signals, suggesting a buy or sell action that doesn’t result in the expected price movement. These false signals can lead to incorrect trading decisions.
Sensitivity to Market Conditions
In volatile or choppy markets, the Stochastic Oscillator can produce too many signals, making it hard to distinguish between genuine and false ones. This can result in frequent trades and potential losses.
Limited Effectiveness in Strong Trends
During strong trends, the Stochastic Oscillator can stay in overbought or oversold territory for long periods. This can be misleading, suggesting a reversal when the trend is continuing. Traders might miss out on profitable opportunities or enter trades too early.
Need for Confirmation
To reduce the risk of false signals, the Stochastic Oscillator should not be used alone. It often needs confirmation from other technical indicators or analysis methods. This adds complexity to the trading strategy and requires a good understanding of multiple tools.
Understanding these disadvantages can help traders use the Stochastic Oscillator more effectively and avoid common pitfalls.
How to Trade with the Stochastic Indicator like a Professional?
Since the Stochastic Indicator always oscillates between 0 and 100, the simplest approach is to identify overbought and oversold conditions.
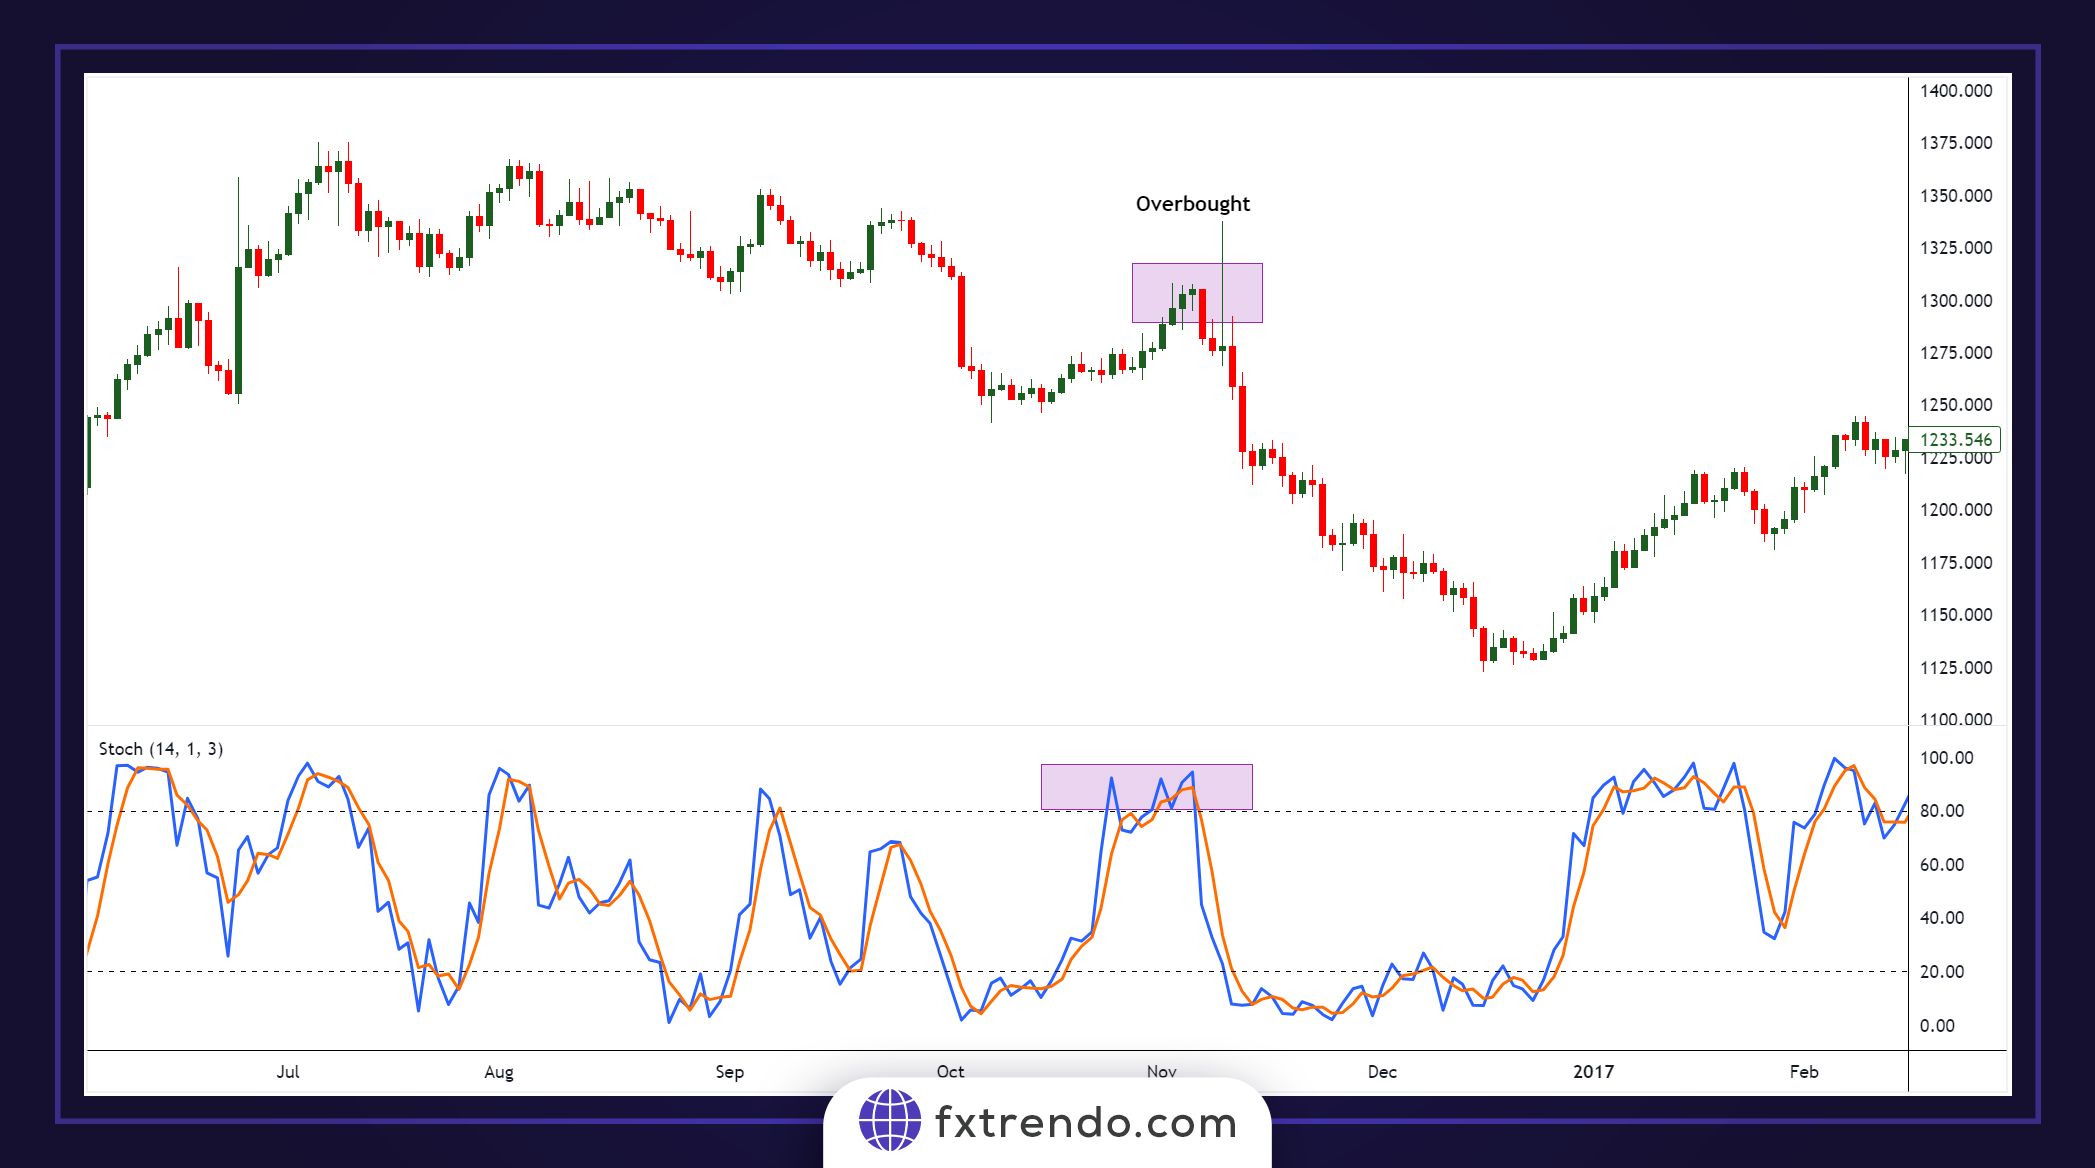
Overbought Conditions in the Stochastic Indicator
When the %K and %D parameters rise above the 80 level, it indicates an overbought condition. At this point, you can consider entering a sell trade after getting additional confirmations. As shown in the example below, the market is in a downtrend, and after reaching the overbought zone (end of the corrective move), it continues to decline.
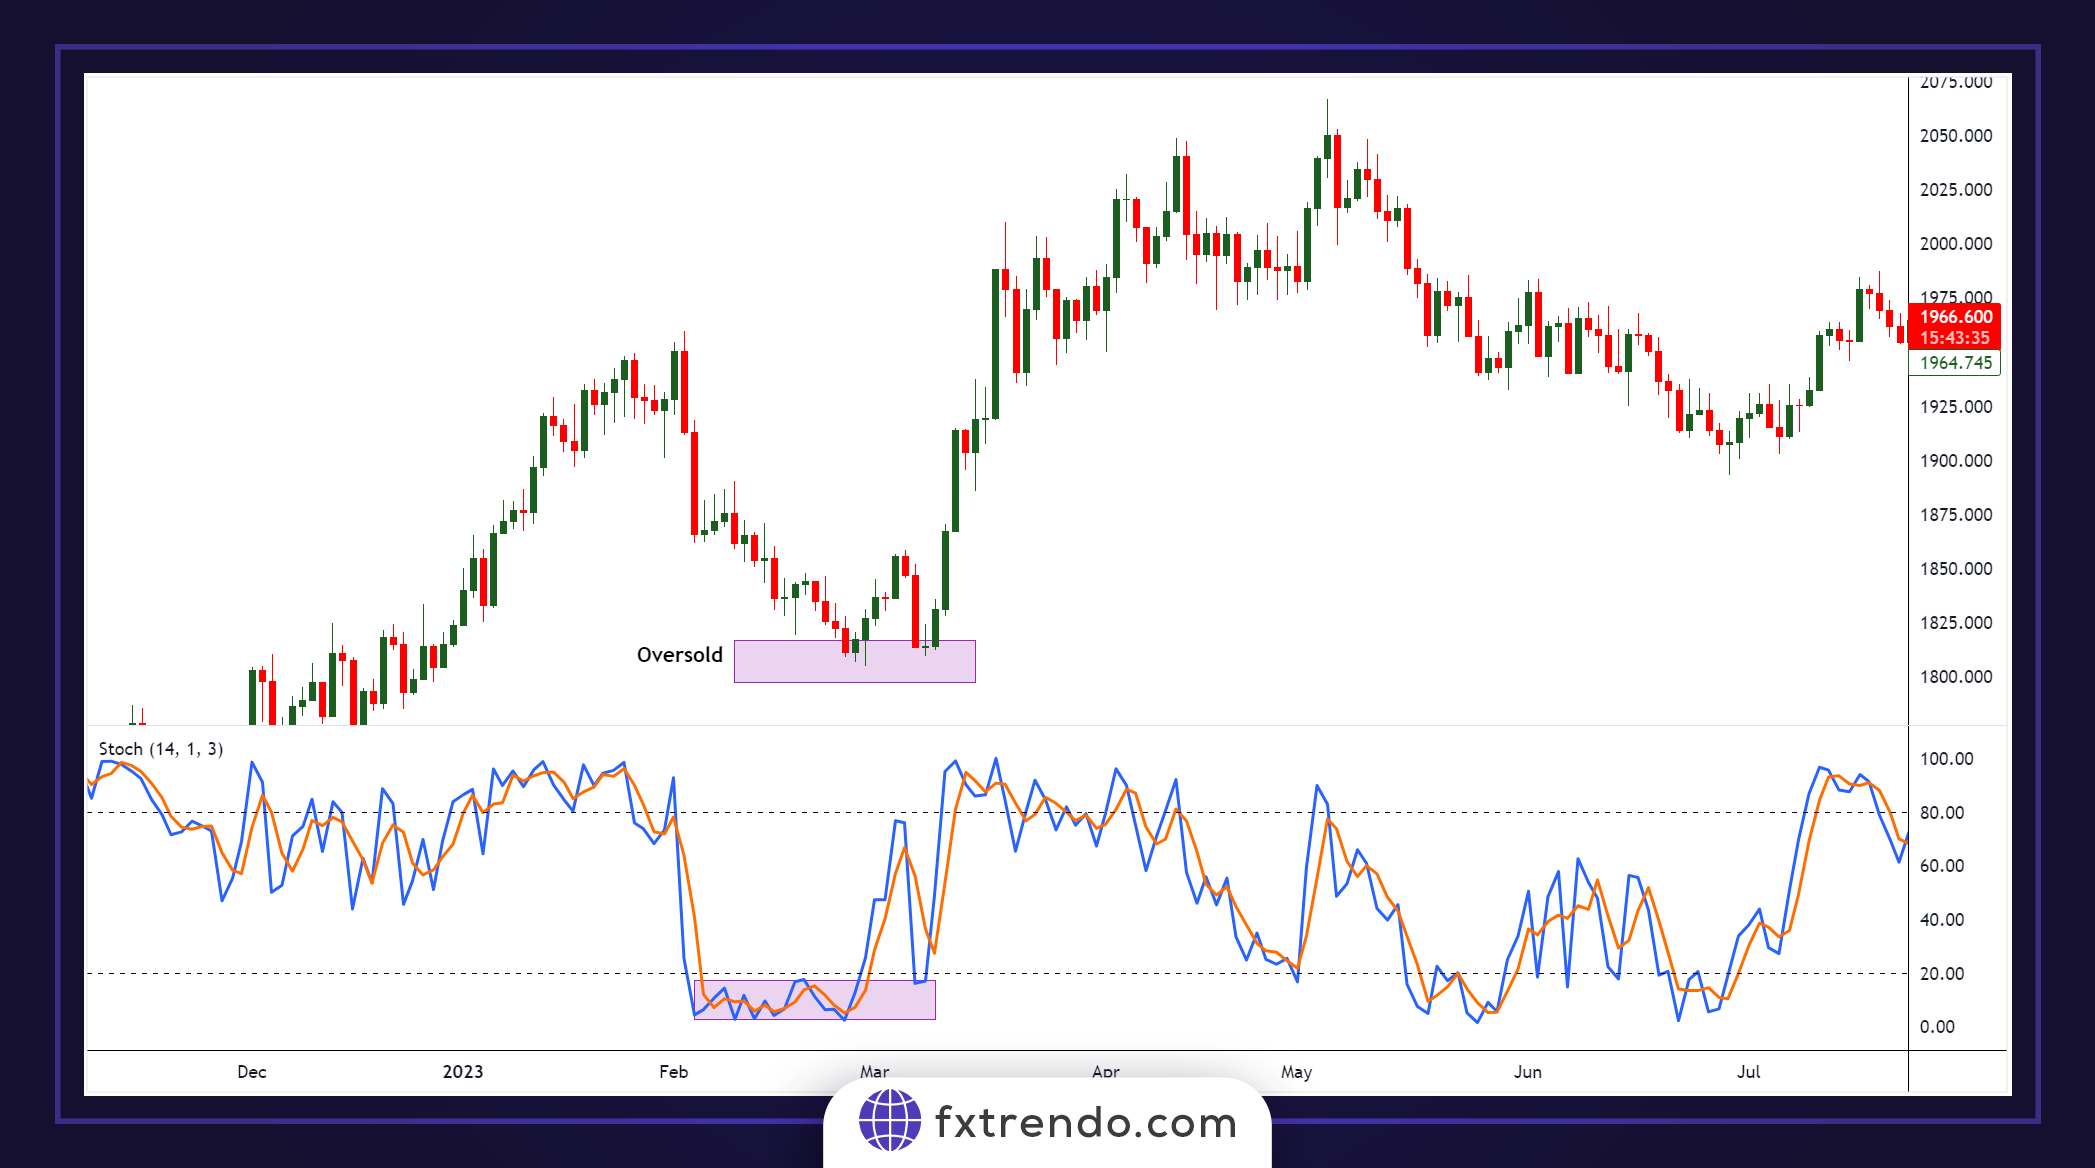
Oversold Conditions in the Stochastic Indicator
When the %K and %D parameters fall below the 20 level, it indicates an oversold condition. At this point, you can consider entering a buy trade after getting additional confirmations. As shown in the example below, the market is in an uptrend, and after reaching the oversold zone (end of the corrective move), it continues to rise.
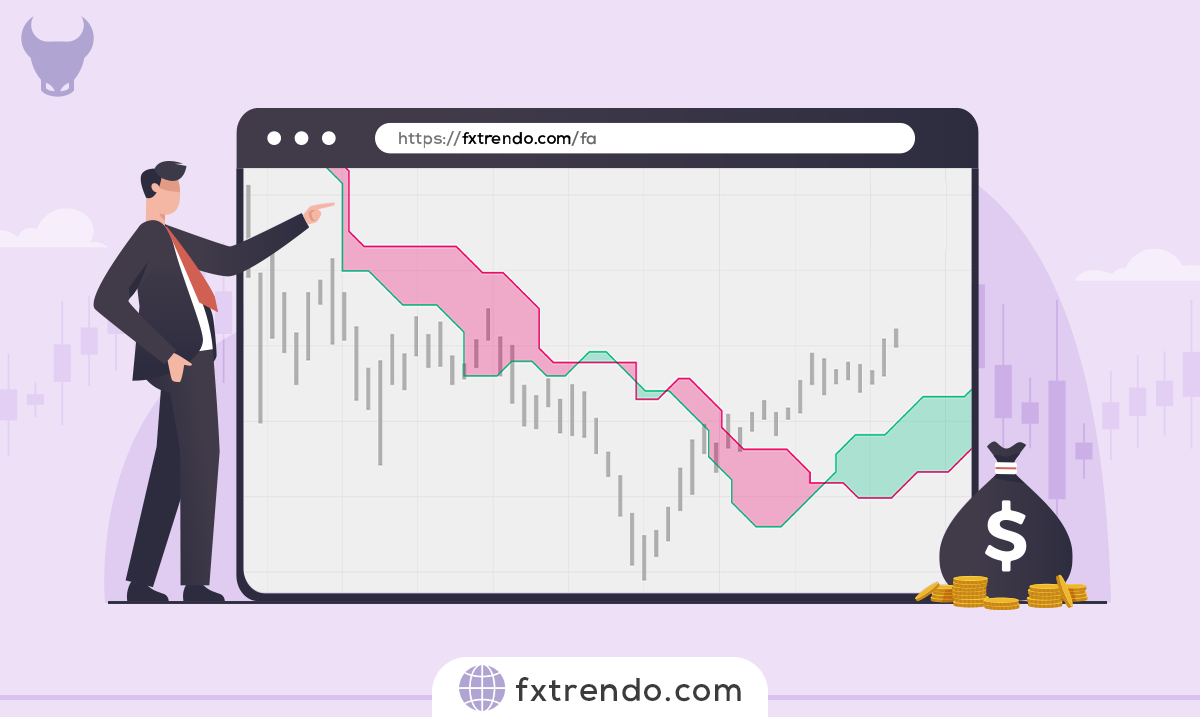
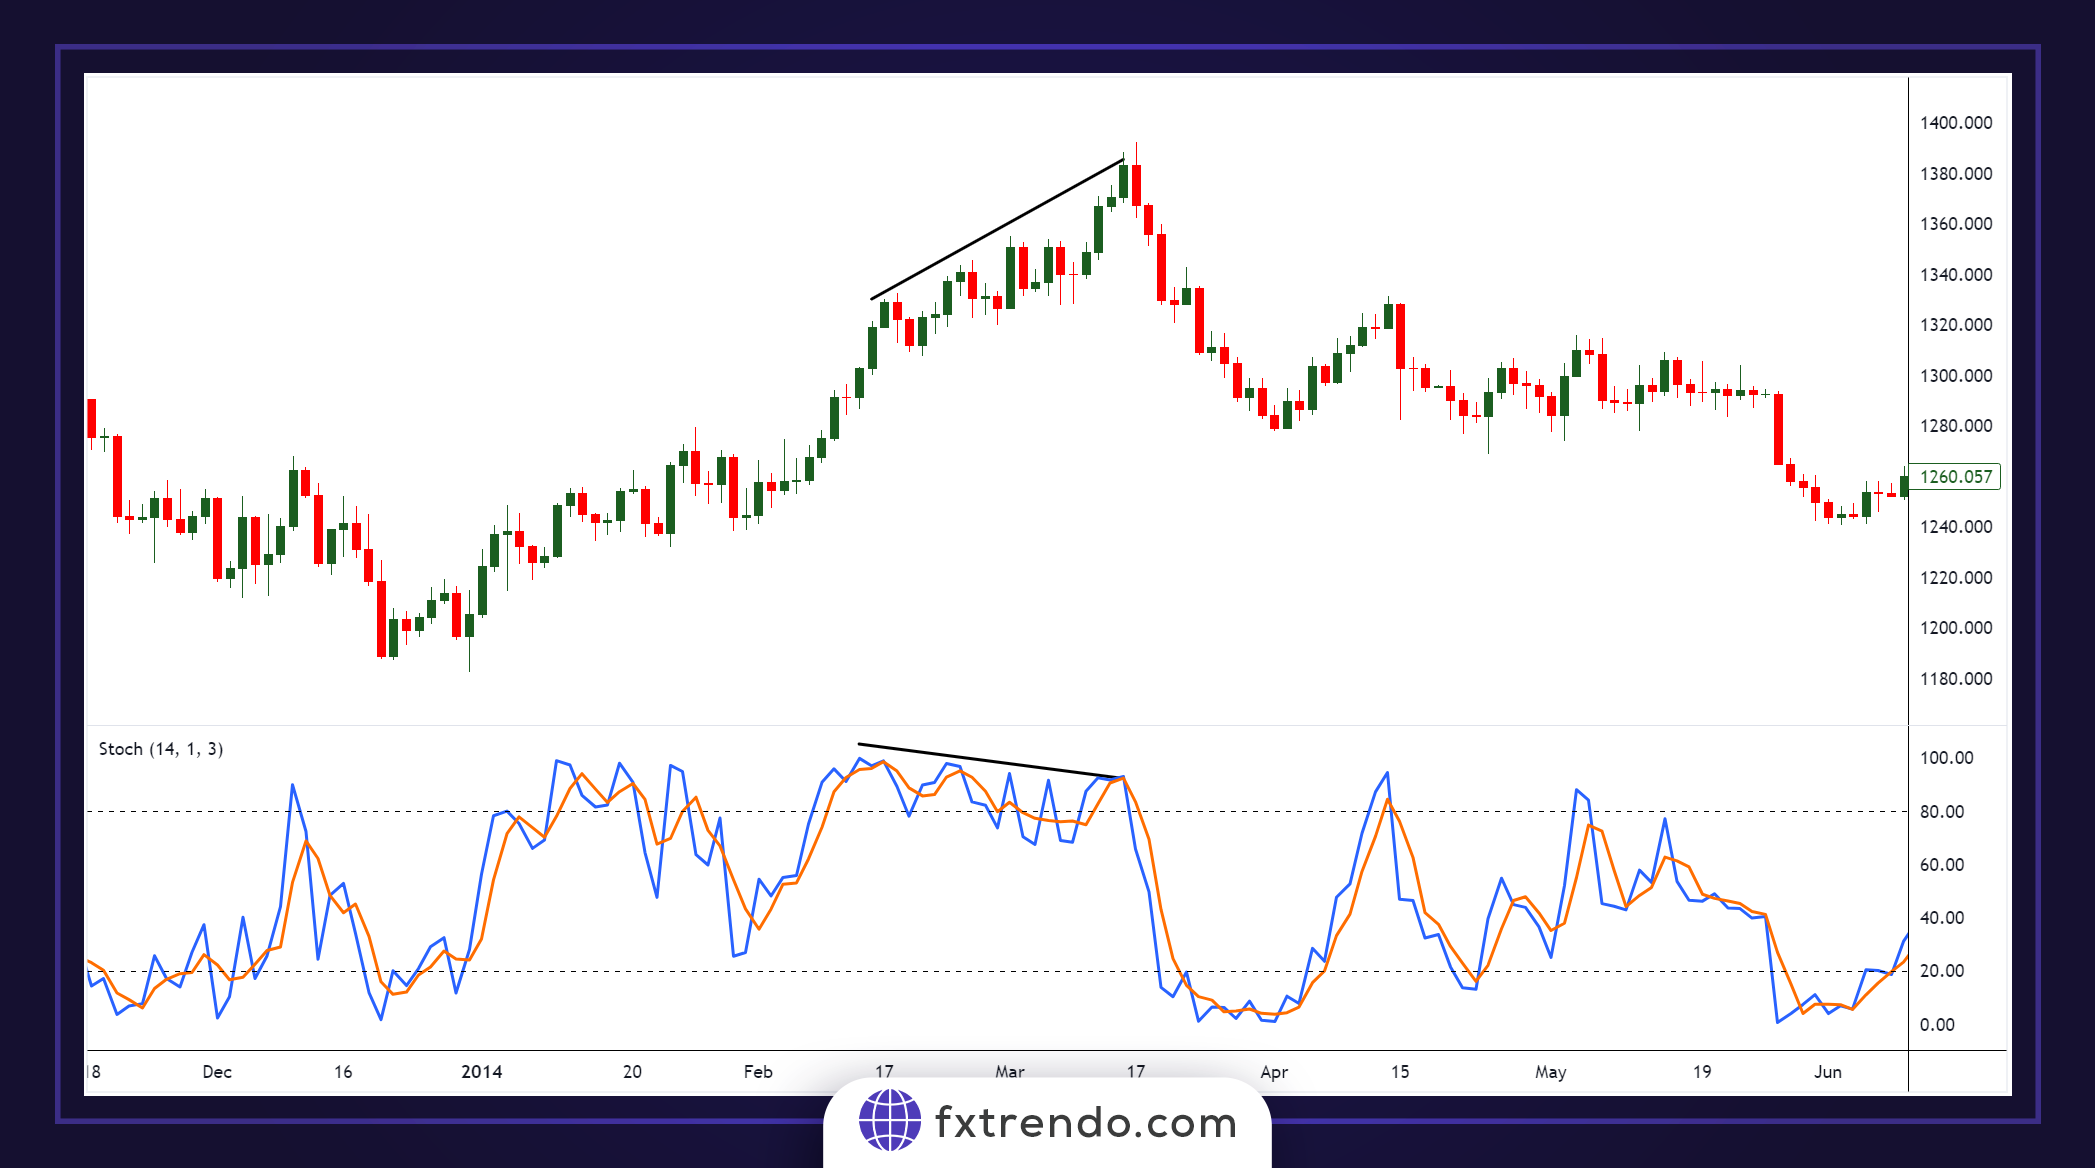
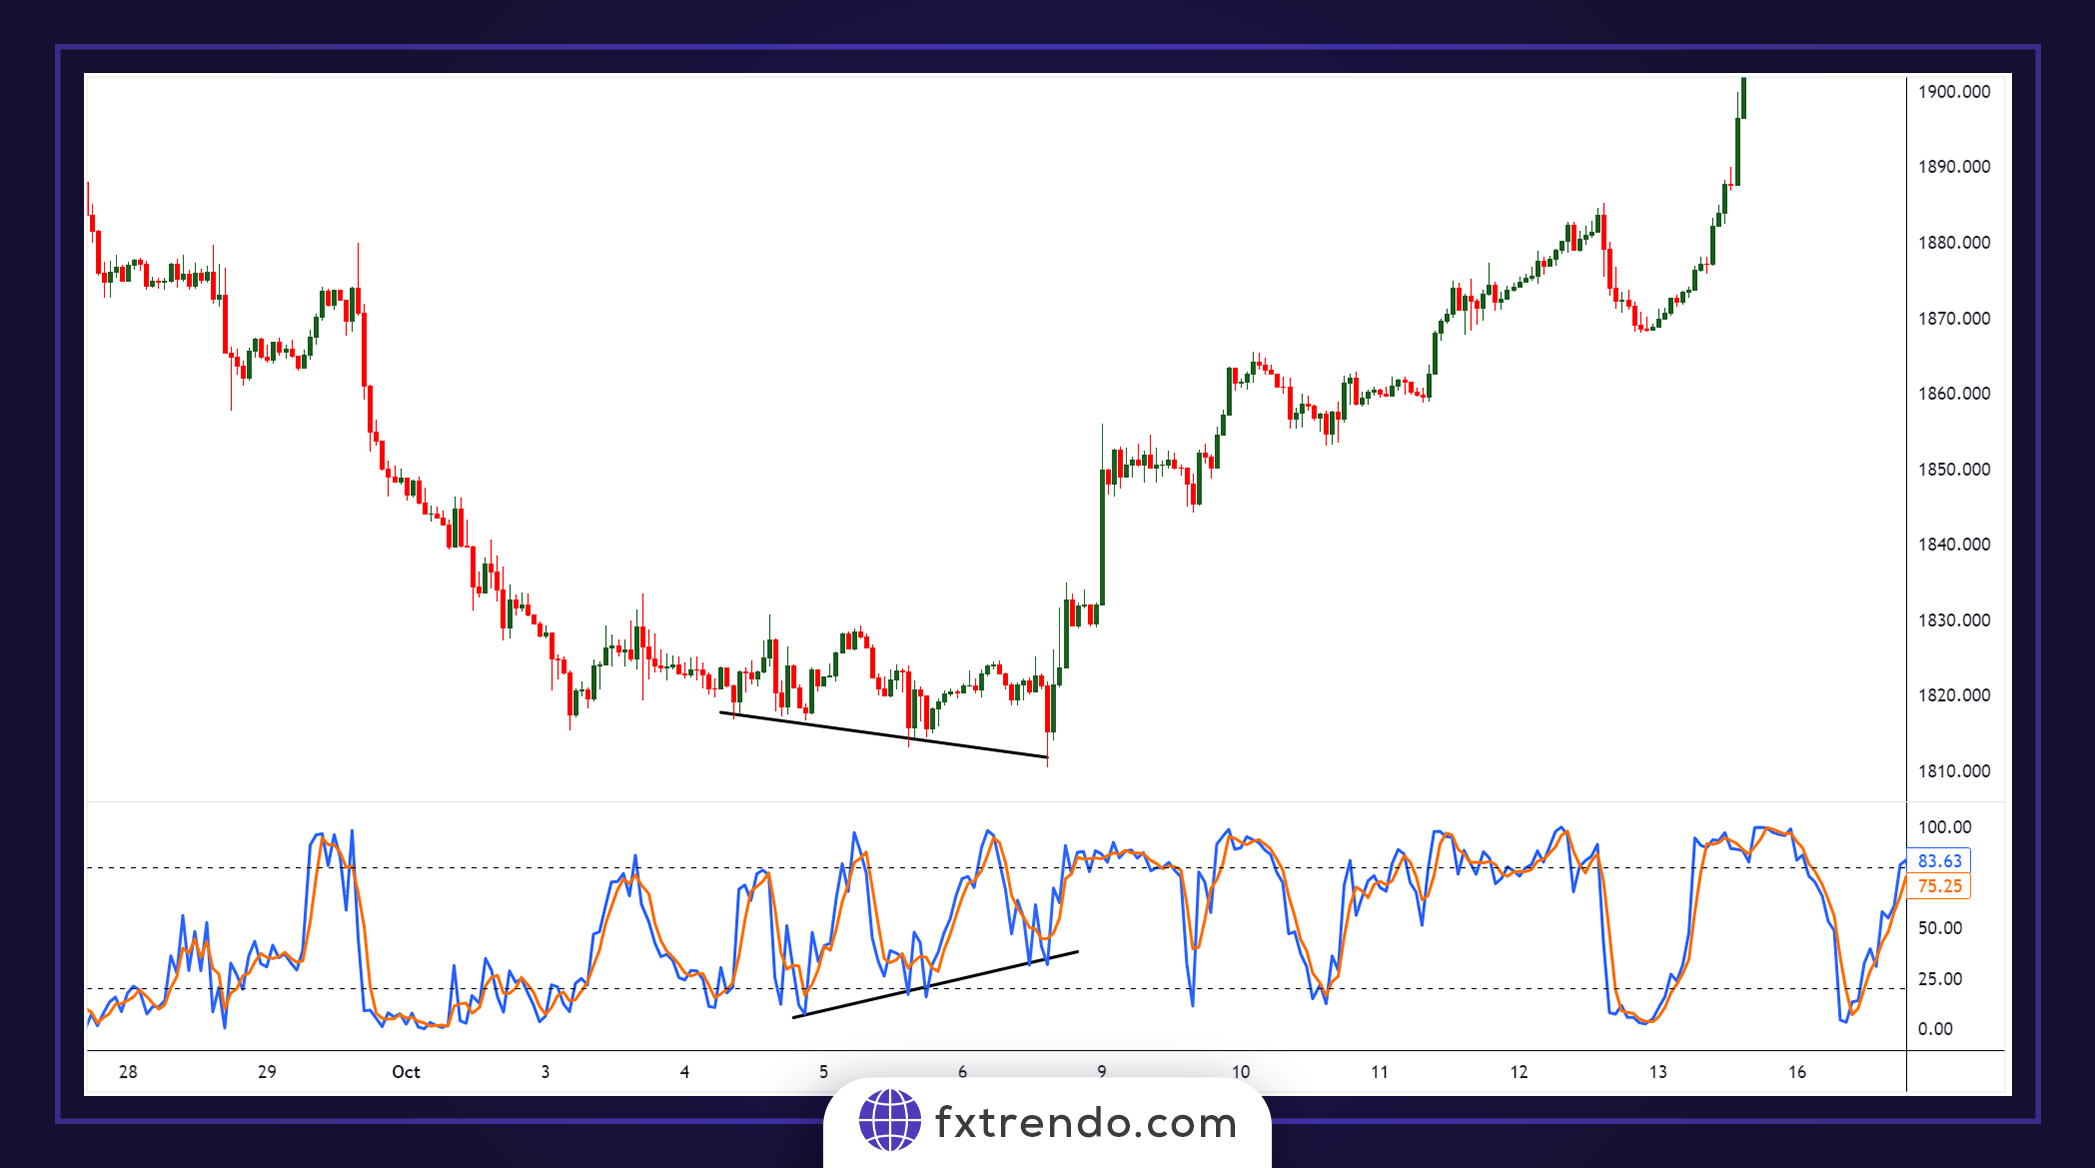
Trading with Stochastic Convergence and Divergence
Another method of trading with the Stochastic Indicator is using convergence and divergence. Simply put, when the price makes new highs, but the Stochastic fails to make new highs, we see a divergence between the price and the Stochastic. In such cases, a price decline is expected.
Conversely, when the price makes new lows, but the Stochastic does not make lower lows, convergence occurs between the price and the Stochastic. In such cases, a price rise is expected in the upcoming trading sessions.
Follow along with two examples of divergence and convergence between the price and the Stochastic.
Tips for Effective Use of the Stochastic Oscillator
The Stochastic Oscillator is a popular momentum indicator used in technical analysis to identify overbought and oversold conditions in the market. Here are some practical tips to help you use this tool effectively:
1. Combine with Other Indicators
Combine the Stochastic Oscillator with other technical indicators like moving averages or the Relative Strength Index (RSI) to confirm signals and reduce false signals.
2. Adjust Settings Based on Market Conditions
Adjust the default 14-period settings based on market conditions and your trading strategy. Shorter periods provide more frequent but noisier signals, while longer periods offer more reliable but slower signals.
3. Use in Trending Markets
The Stochastic Oscillator is most effective in trending markets. In strong trends, it can stay in overbought or oversold territory for extended periods. Use it to identify entry and exit points within the trend.
4. Look for Divergences
Divergences between the Stochastic Oscillator and price can signal potential trend reversals. A bullish divergence occurs when the price makes a lower low, but the Stochastic Oscillator makes a higher low. A bearish divergence happens when the price makes a higher high, but the Stochastic Oscillator makes a lower high.
5. Practice Robust Risk Management
Use risk management techniques when trading with the Stochastic Oscillator. Set stop-loss orders to limit losses and take-profit levels to secure gains. Proper position sizing and a favorable risk-reward ratio are essential.
6. Practice Patience and Discipline
Trading with the Stochastic Oscillator requires patience and discipline. Wait for clear signals and confirmations before entering a trade. Avoid impulsive decisions based on incomplete information.
By following these tips, you can use the Stochastic Oscillator more effectively and improve your trading performance.
Conclusion
The Stochastic Indicator has earned a special place as a technical analysis tool in financial markets. By analyzing price behavior and identifying overbought and oversold conditions, it helps traders make more successful decisions.
Key points to consider when using the Stochastic Indicator include accurately determining the trading timeframe, analyzing %K and %D values, and managing risk. It’s important to note that patience and discipline in executing your trading system are crucial for success in financial markets.