
This practical and powerful method helps traders identify price reversal points or potential market highs and lows. By recognizing these critical areas, traders can make more structured trading decisions when divergence is confirmed with price action, key levels, and risk management.
In this article, presented by the educational team at Trendo Broker, we’ll delve into the concept of divergences, explore their types, and uncover how to effectively use them in Forex trading. Let’s dive in!
What Is Divergence in Technical Analysis?
Divergence is one of the fundamental and widely-used concepts in technical analysis, focusing on the relationship between price movements and the behavior of indicators or oscillators.
In simple terms, divergence occurs when the direction of a financial asset’s price movement does not align with the direction of a technical indicator, such as RSI (Relative Strength Index), MACD (Moving Average Convergence Divergence), or Stochastic Oscillator. This lack of harmony can signal potential market trend changes or upcoming price reversal points.
Divergences are identified by comparing the price action on charts with the movement of an oscillator. They typically appear in trending markets, where assets form higher highs and higher lows in an uptrend, or lower highs and lower lows in a downtrend.
Divergences are most noticeable when the price forms these patterns, but the indicator fails to confirm them, suggesting an imbalance in market momentum.
For instance, consider a gold chart where the price creates lower highs and lower lows, signaling a bearish trend. Ideally, the RSI, as a momentum-following indicator, should mirror this downward trajectory. However, if the RSI begins to form equal or higher lows, this misalignment indicates divergence.
Types of Divergence
Divergences in technical analysis come in various forms, each offering unique insights to identify potential trend changes or continuations. Understanding these types and their practical applications can empower traders to make more informed decisions and develop profitable trading strategies.
The main types of divergence include:
- Regular Divergence
- Hidden Divergence
- Time Divergence
Let’s explore each in detail.
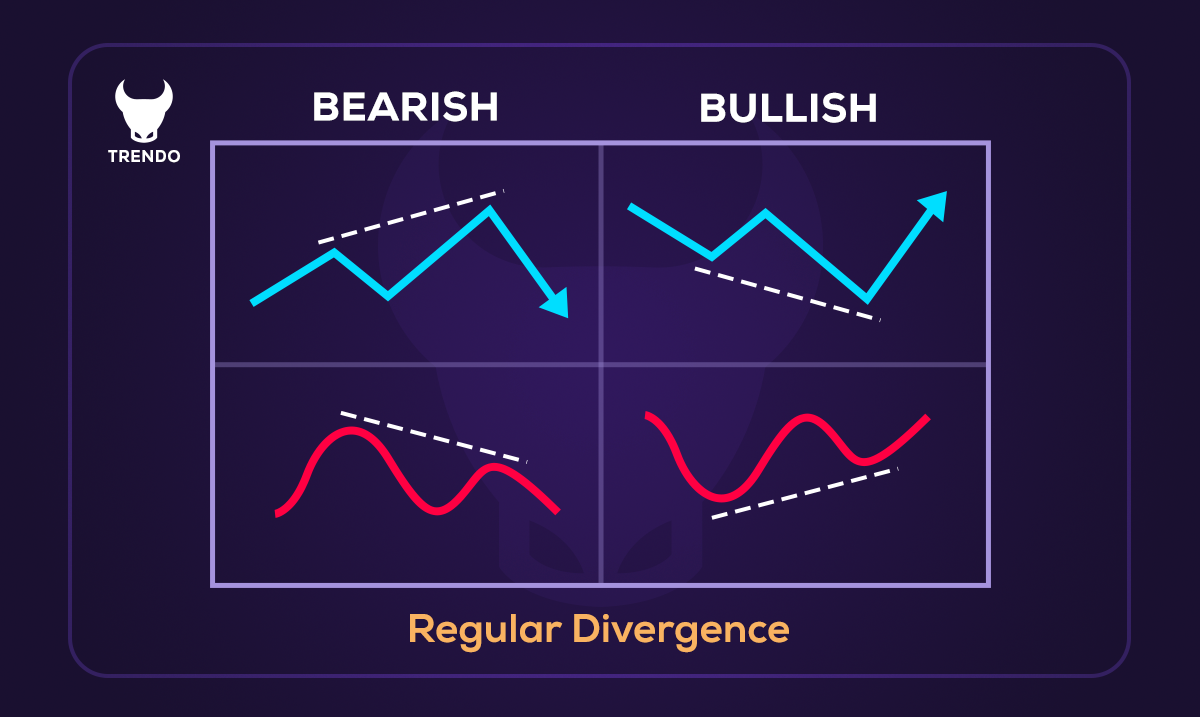
Regular Divergence
Regular divergence is the most common type of divergence and is typically observed at potential trend reversal points. Its primary use is to identify where a trend might be weakening, helping traders spot entry and exit opportunities. Regular divergence occurs when an asset’s price reaches a new high or low, but the corresponding indicator fails to confirm this movement by forming a lower high or higher low instead.
Regular Bullish Divergence: This happens when the price forms a lower low, but the indicator forms a higher low. It often signals weakening bearish momentum and the potential start of an upward trend.
Regular Bearish Divergence: Here, the price makes a higher high, but the indicator creates a lower high. This divergence usually warns of a weakening bullish trend and a possible downward reversal.
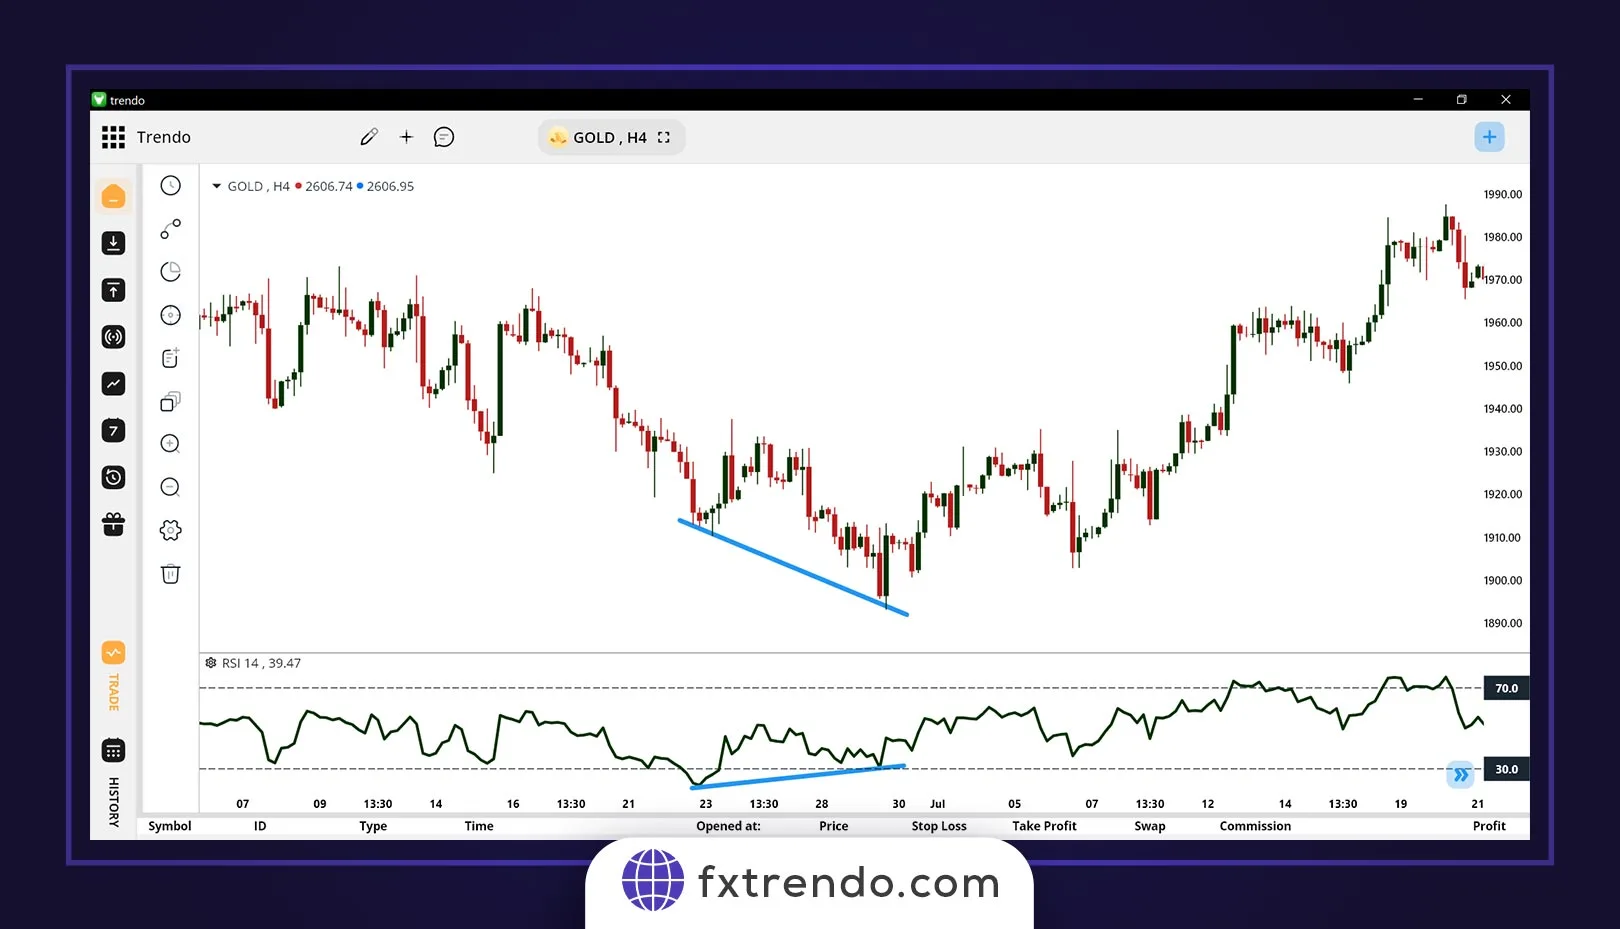
For example, as you can see in the image below of the gold symbol on the H4 timeframe, the price has created a positive divergence with the RSI indicator, and then the gold bullish trend has begun:
Hidden Divergence
Hidden divergence is one of the powerful tools in technical analysis that, unlike regular divergence, indicates the continuation of the current market trend. While regular divergence often signals a trend reversal, hidden divergence helps traders identify suitable entry points for continuing the existing trend. This type of divergence occurs when price behavior and the indicator (such as RSI, MACD, or Stochastic) do not match, but instead of reversing, they strengthen the ongoing trend. To detect it, you must pay attention to the highs and lows of both the price and the indicator. Hidden divergence is divided into two types: bullish and bearish.
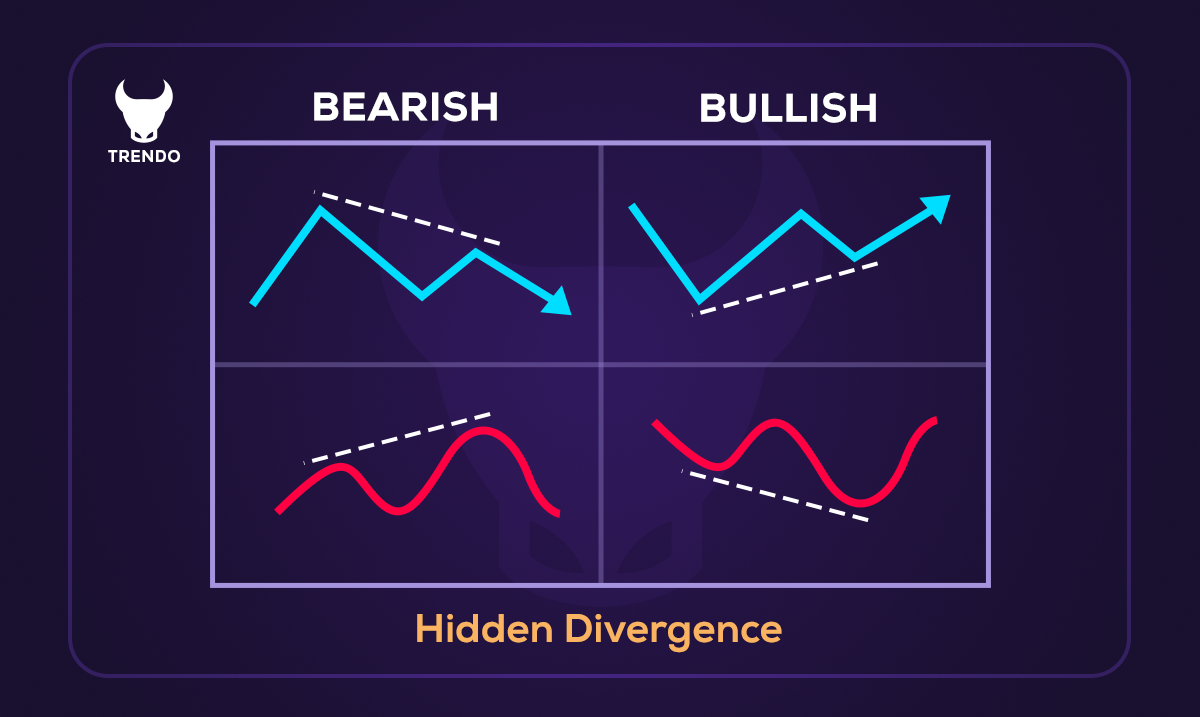
1. Hidden Bullish Divergence
This type of divergence occurs during an upward market trend and provides a strong buy signal. Here, price creates a lower low than the previous low, while the indicator makes a higher low. This shows that upward momentum remains strong, and the market will likely continue its bullish trend.
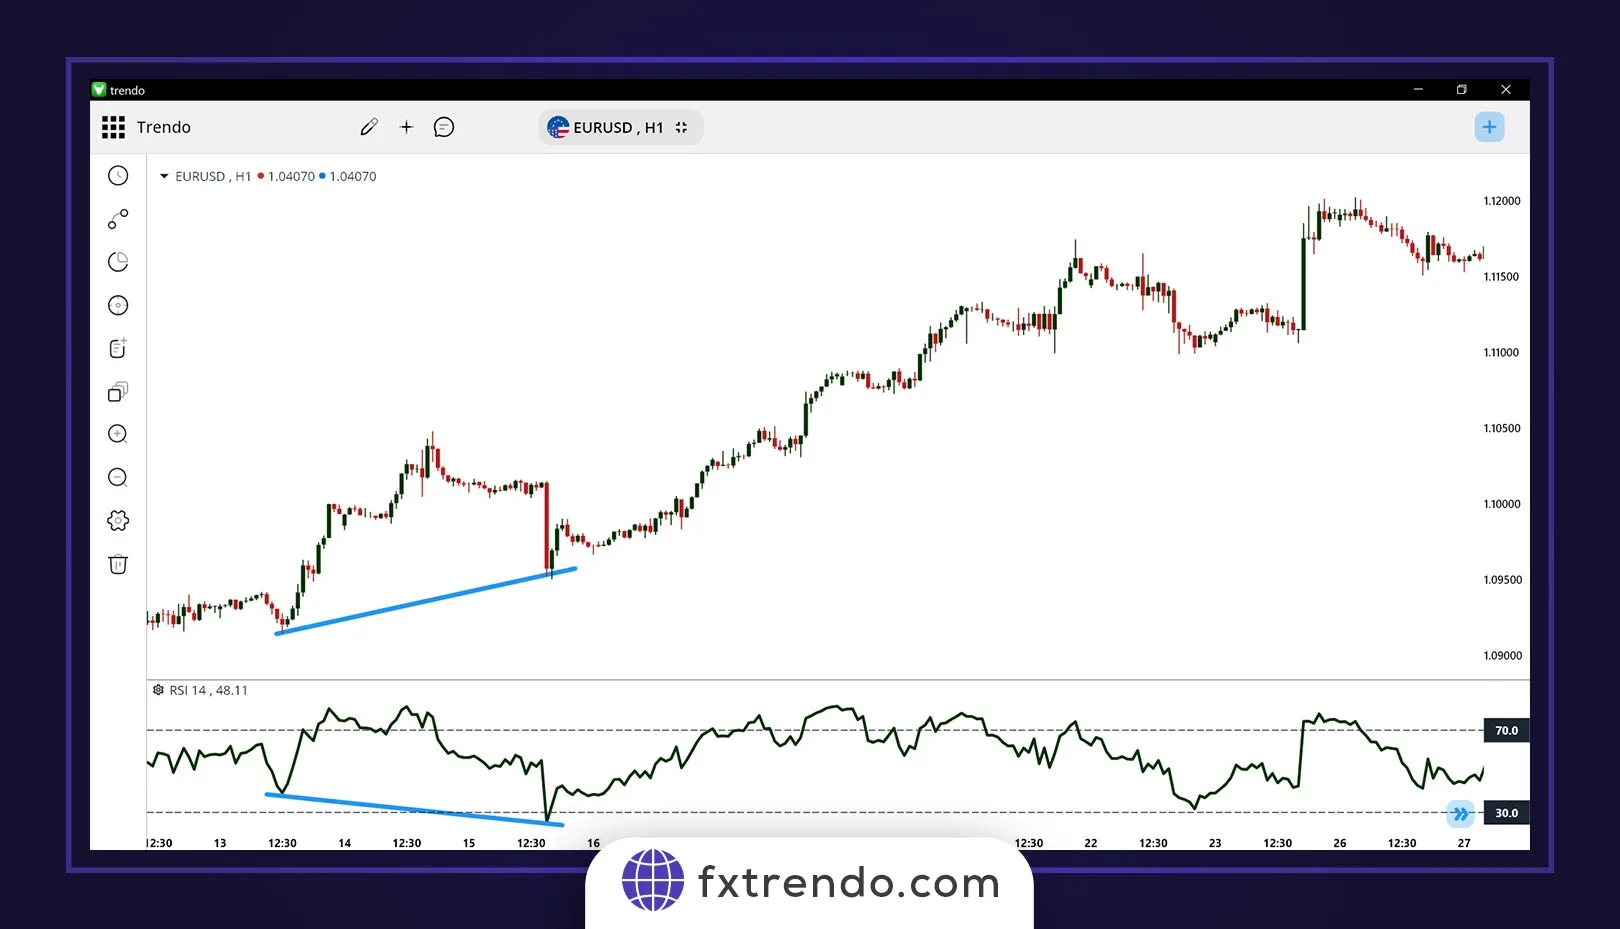
For example, as shown in the image below for the EURUSD pair in the H1 timeframe, the price and the RSI indicator formed a hidden bullish divergence, after which the corrective pullback ended, and the market resumed its upward movement.
For example, as you can see in the image below in the EURUSD currency pair on the H1 timeframe, the price has created a positive hidden divergence with the RSI indicator, and after that, the price correction has ended and the market has resumed its upward movement:
2. Hidden Bearish Divergence
This divergence appears in a downward market trend and provides a sell signal. In this case, the price creates a higher high than the previous high, while the indicator forms a lower high. This indicates weakness in bullish momentum and the continuation of the downward trend. It is recommended that traders combine hidden divergences with other factors such as trading volume, support/resistance levels, and more, to obtain stronger confirmations.
Time Divergence
Time divergence, though less commonly discussed, is a crucial concept for advanced technical analysts. It involves analyzing the relationship between price movements and time to identify trend weaknesses.
For instance, in an uptrend, the market consistently forms higher highs and higher lows. However, during corrective moves, if the duration of these corrections increases over time, or their depth grows within the same time frame, this signals potential trend weakness. Similarly, if the length of the main trend legs (extension moves) shortens over time, it suggests diminishing trend strength and a possible trend conclusion.
Positive Time Divergence: Typically occurs at the end of a downtrend, signaling potential upward reversals.
Negative Time Divergence: Seen at the end of an uptrend, indicating a possible downward reversal.
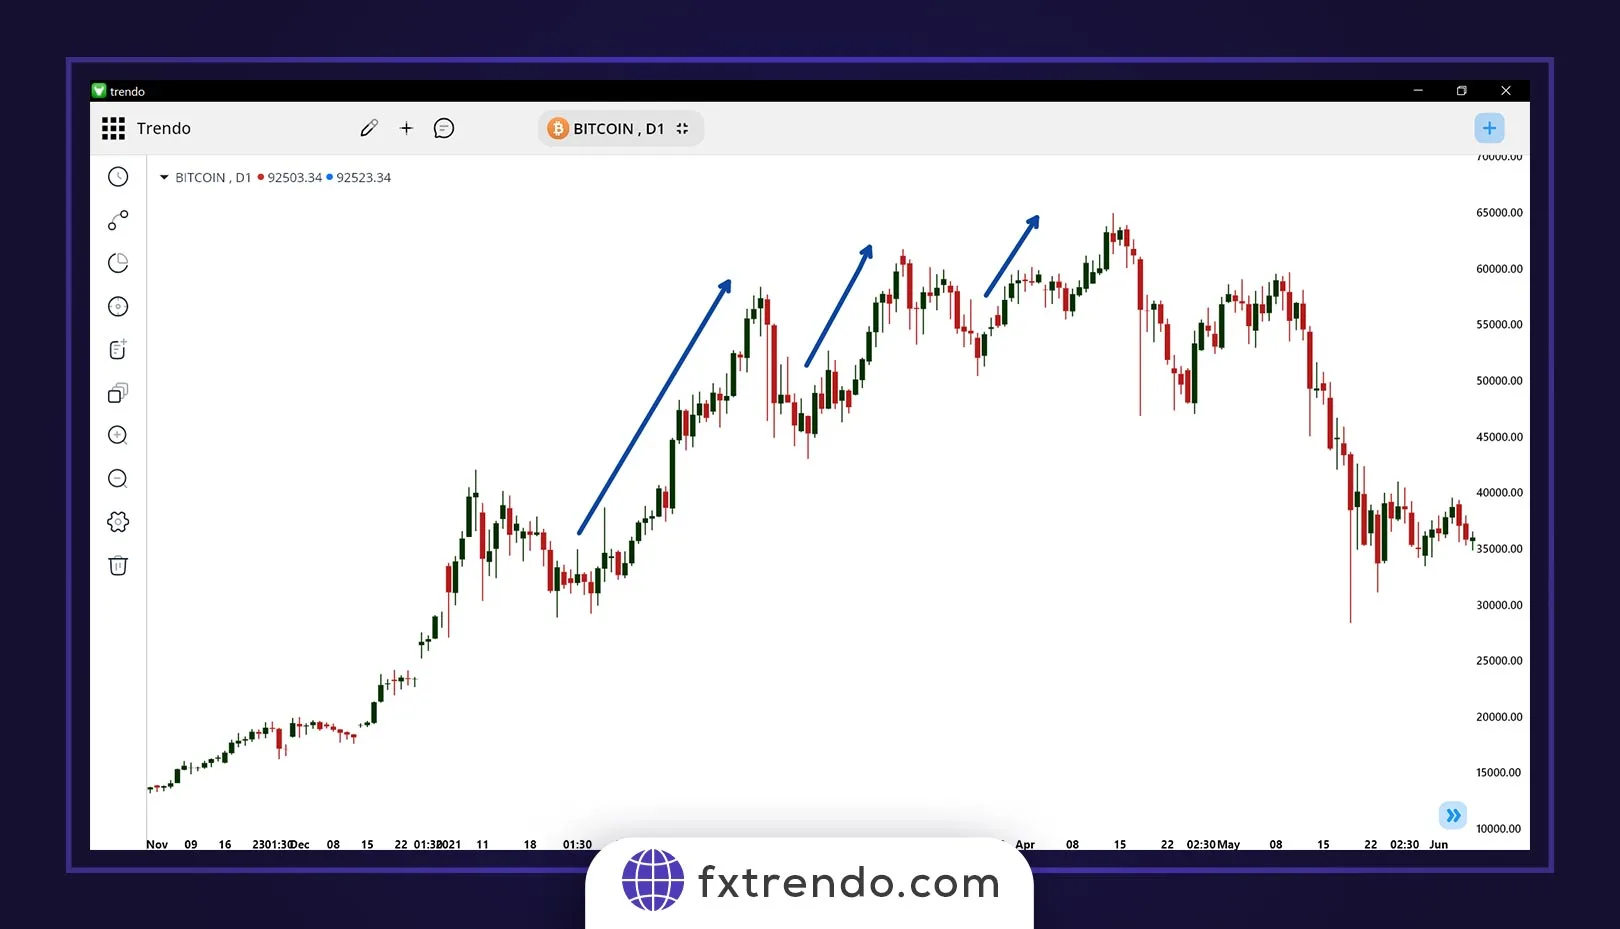
For example, as you can see in the Bitcoin (BTC) chart on the daily timeframe, the market is in an uptrend, but each time the length of the main trend moves (Extension Leg) decreases compared to the previous one, and instead, the depth of the corrective moves is increasing. Then, the uptrend ends and a strong downtrend in Bitcoin begins:
Each type of divergence offers unique perspectives on market behavior, making it a valuable tool for traders who wish to refine their strategies and anticipate market movements effectively.
Note: that you should not immediately enter a counter-trend trade based on a divergence alone, and divergences are only good signs of the end of a trend, not definitive signs of the end of a trend!
How to Identify Divergence in Trading?
Identifying divergence in trading requires a careful examination of price action and technical indicators. Divergence occurs when there is a mismatch between the direction of an asset’s price and the movement of an indicator, such as RSI, MACD, or Stochastic Oscillator.
Here’s a step-by-step guide to identifying divergence effectively:
1. Select the Right Indicator
To identify divergence, choose a momentum-based indicator that complements your trading strategy. Commonly used tools include:
Relative Strength Index (RSI): Measures the speed and change of price movements.
MACD (Moving Average Convergence Divergence): Tracks the relationship between two moving averages.
Stochastic Oscillator: Indicates whether an asset is overbought or oversold.
These indicators help reveal imbalances between price and momentum.
2. Analyze Price Movements
Start by observing the asset’s price chart to identify key highs and lows. Look for the following patterns:
- Higher highs and higher lows in an uptrend.
- Lower highs and lower lows in a downtrend.
Mark these points clearly, as they will serve as reference points when comparing with the indicator.
3. Compare Indicator Behavior
Check the selected indicator’s chart and match its peaks and troughs with the price highs and lows. Divergence occurs when:
- The price forms a higher high or lower low, but the indicator does not confirm this movement.
- The indicator shows a higher low or lower high, diverging from the price action.
This discrepancy highlights potential trend changes or continuations.
4. Distinguish Between Types of Divergence
Understanding the type of divergence is crucial for interpreting the market’s direction:
Regular Divergence: Indicates a possible trend reversal. For example, if the price forms a higher high, but the indicator shows a lower high, it suggests weakening momentum.
Hidden Divergence: Signals trend continuation. For instance, if the price forms a higher low, but the indicator forms a lower low, it confirms the strength of the current trend.
Identifying the correct type of divergence helps refine your trading decisions.
Divergences are more reliable when confirmed across multiple timeframes. For instance:
A divergence visible on both the daily and 4-hour charts carries more weight than one seen on a single timeframe. This approach helps reduce false signals and increases confidence in your analysis.
5. Confirm with Other Tools
While divergence is a strong signal, it’s essential to validate it using additional technical tools like support and resistance levels, trendlines, or candlestick patterns. Combining divergence with other methods improves accuracy and reduces the likelihood of errors.
By mastering the art of identifying divergence, traders can gain a significant edge in the market, enhancing their ability to anticipate price movements and make informed decisions.
Advantages and Limitations of Using Divergence
Divergence is a tool in technical analysis that helps identify potential market trends and reversals. While effective, it has both strengths and weaknesses.
Advantages of Using Divergence
1. Early Trend Reversal Signals: Divergence helps identify potential reversals before they are visible in price action, allowing for strategic entry and exit points.
2. Improved Risk Management: Divergence signals trend changes, helping traders plan positions and improve risk-to-reward ratios.
3. Versatility Across Markets: Divergence works in various markets like Forex, stocks, and cryptocurrencies, making it useful for multiple trading strategies.
4. Complementary to Other Tools: Divergence strengthens trading strategies when combined with tools like support levels, trendlines, or Fibonacci retracements.
5. Ease of Use: Identifying divergence is straightforward with standard indicators like RSI, MACD, and Stochastic Oscillator, making it accessible to traders at all levels.
Limitations of Using Divergence
1. False Signals: Divergence can produce false signals, especially during strong trends or high volatility.
2. Lagging Nature: Most momentum indicators rely on past data, which may delay signals and cause traders to miss better entry or exit points.
3. Subjectivity: Divergence often requires visual interpretation, leading to varied conclusions among traders.
4. Not Reliable Alone: Divergence should be part of a broader trading strategy, not used in isolation.
5. Less Effective in Sideways Markets: Divergence works better in trending markets and is less reliable during sideways or choppy conditions.
While divergence offers powerful insights, combining it with other tools and maintaining a cautious approach ensures more consistent and reliable trading results.
What Indicators Are Used to Identify Divergences?
Indicators are essential tools in technical analysis, helping traders spot divergences and generate valid signals for trading decisions. By using these indicators, traders can identify various types of divergence and leverage this information to predict market trends and optimize their strategies. Below, we will explore two popular and widely-used indicators—MACD and RSI—that help in recognizing divergences.
1. MACD (Moving Average Convergence Divergence)
MACD is one of the most popular tools for identifying divergences and analyzing price movements. This indicator combines two moving averages—a short-term and a long-term—to highlight the difference between the two. It also includes a signal line to assist in confirming buy or sell signals. MACD helps traders spot divergences when the price moves in one direction, but the MACD line moves in the opposite direction, indicating a potential trend reversal.
Traders can easily add MACD to their charts through most trading platforms, including Trendo, to help confirm their trades. By observing the MACD’s crossovers and divergence from price, traders can make more informed decisions regarding trend changes.
2. RSI (Relative Strength Index)
RSI is another commonly used indicator that measures the relative strength of buying and selling pressure. RSI moves between 0 and 100, with levels of 30 and 70 representing oversold and overbought conditions, respectively. By comparing price highs and lows with the RSI’s behavior, traders can identify divergence patterns that signal potential reversals.
When prices make higher highs, but RSI forms lower highs (or vice versa), this indicates divergence. Using RSI on platforms like Trendo, traders can track these signals to time market entries and exits more effectively.

3. Other Indicators for Identifying Divergence
Besides MACD and RSI, there are several other indicators that traders can use to spot divergence:
Divergence Training with the Stochastic Indicator
The Stochastic indicator is one of the most popular oscillators among traders for identifying momentum and overbought and oversold zones. This indicator oscillates between 0 and 100, and the levels 20 and 80 are commonly used to identify oversold and overbought conditions, respectively.
Divergence detection with Stochastic occurs when price behaviour does not match the %K and %D lines. For example, suppose the price creates a new lower low, but the Stochastic forms a higher low. In that case, a bullish divergence is formed, which may indicate weakening seller pressure and a potential reversal. If the price forms higher highs while the Stochastic produces lower highs, a bearish divergence has occurred, which may signal a downward reversal.
Stochastic generally provides clearer results on shorter timeframes, and its best performance is when divergence forms in overbought or oversold areas. It is recommended to combine Stochastic with other indicators, such as moving averages for confirmation.
Divergence Training with the CCI Indicator
The CCI indicator, or Commodity Channel Index, measures price deviation from its statistical average and typically oscillates between -100 and +100. Readings above +100 indicate overbought conditions, and below -100 show oversold conditions. Due to its sensitivity to momentum changes, this indicator is suitable for detecting divergence.
To identify divergence using CCI, you must examine the price chart and the CCI simultaneously. A bullish divergence occurs when the price makes a new lower low, but the CCI forms a higher low, which is a buy signal. Conversely, if the price forms a higher high while the CCI forms a lower high, a bearish divergence occurs, indicating weakness in the uptrend and suggesting a sell signal. It is recommended that, due to CCI’s sensitivity to rapid market changes, divergence signals be combined with a defined trend or support/resistance levels for confirmation.
Awesome Oscillator Divergence Training
The Awesome Oscillator (AO) indicator is a momentum-based oscillator that displays the strength and direction of market momentum. This indicator consists of green and red bars that oscillate around the zero line. To identify divergence with AO, it is sufficient to compare the price highs and lows with the AO highs and lows. If the price forms a higher high but AO shows a lower high, a bearish divergence has occurred, which may signal a selling opportunity. In contrast, if the price forms a lower low but AO forms a higher low, a bullish divergence (Saucer or Twin Peaks) is formed, and the likelihood of upward movement increases. One advantage of this indicator is its ability to filter out small market fluctuations and provide more precise divergence analysis.
It is recommended to combine the AO indicator with the Alligator indicator for more accurate results.
How to Use Divergence in Technical Analysis?
In this section, we will discuss how to effectively use divergence in technical analysis. These are practical rules for trading with divergence patterns. Let’s walk through the steps for incorporating divergence into your trading strategy.
Step 1: Identify the Patterns
For divergence to be valid, the price chart should form one of the following patterns:
- Higher highs
- Lower lows
- Double tops
- Double bottoms
If you notice divergence in an indicator but none of these patterns appear in the price chart, the divergence will not be effective. Therefore, it’s essential to ensure that the chart confirms the pattern before relying on the divergence signal.
Read more: What are the golden patterns for getting confirmation in Forex?
Step 2: Connect Only the Key Highs and Lows
To spot divergence, focus on the four main patterns mentioned earlier—higher highs, lower lows, double tops, and double bottoms. When drawing lines to identify divergence, make sure to connect significant price points. Small peaks or troughs on the chart that don’t represent key levels should be ignored, as they may not provide reliable signals.
Step 3: Mark the Relevant Highs and Lows
Start by marking the significant highs and lows on the price chart. Then, find the corresponding highs and lows on the indicator you are using (such as MACD or RSI). You can draw vertical lines to make these key points clear. By doing this, you ensure you are comparing the correct price movements and divergence patterns.
Step 4: Compare the Price Movements’ Length and Strength
This is one of the most important factors to consider. In a trending market, price tends to form higher highs or lower lows. However, when divergence occurs, the current move should be weaker and shorter compared to the previous move. A weak price movement in the face of divergence suggests that the trend might be losing momentum, which could indicate a potential reversal.
Step 5: Don’t Try to Catch a Falling Knife (Sharp Moves)
If the market hasn’t entered a consolidation phase before changing direction, there might not be a good entry point for a trade. Traders sometimes rush in, only to end up entering positions at unfavorable prices. It’s crucial to be patient and wait for the right moment. Entering a trade at the wrong price can drastically reduce your risk-to-reward ratio. Never attempt to trade against a sharp move (spike) in the market.
By following these steps, you can use divergence as a powerful tool to identify potential trend reversals and make more informed trading decisions. Remember to exercise patience and combine divergence with other analysis tools for the best results.
Divergence Trading Strategy
Divergence is a powerful tool in technical analysis that can provide valuable signals for traders. By using divergence-based strategies, traders can identify optimal entry and exit points, improving the profitability of their trades. Below, we’ll outline a few practical strategies for utilizing divergence in forex trading.
1. Trend Line Break Divergence Strategy
One effective strategy involves combining divergence with trend line breaks. Start by drawing an upward or downward trend line on the chart, depending on the market’s direction. Next, look for positive or negative divergence near the trend line. If the trend line is broken, this can signal a potential reversal. You would then enter the trade in the direction of the breakout and place your stop-loss slightly above or below the trend line to manage risk.
By waiting for a trend line break after observing divergence, traders can take advantage of significant price movements while confirming the shift in momentum. This strategy provides a clear signal to act, with the trend line serving as a key reference point for trade entries and exits.
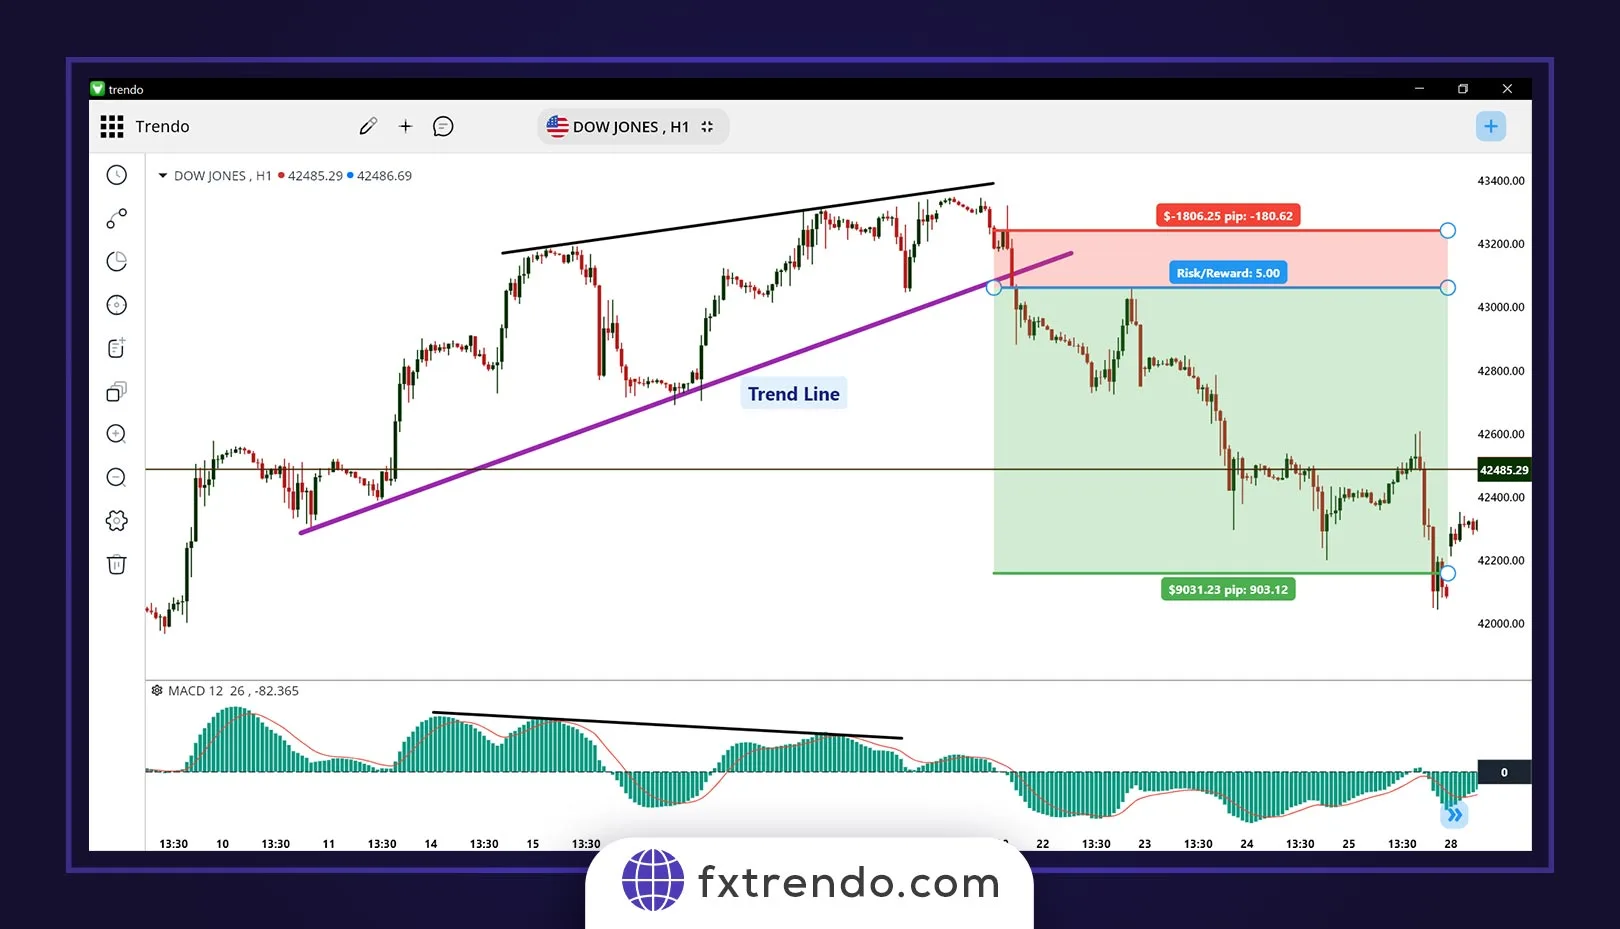
For example, as you can see in the image below, in the Dow Jones index on the H1 timeframe, the price has created a divergence with the MACD indicator. In this case, you could enter a sell trade by breaking the trend line and capture a 1:5 risk-to-reward.
2. Divergence with Support and Resistance Levels Strategy
This strategy combines divergence with support and resistance levels to pinpoint reliable entry and exit points in the forex market. First, identify key support and resistance levels on the price chart. Then, look for positive divergence near a support level, or negative divergence near a resistance level.
For example, if you spot a positive divergence near a strong support level and the divergence is confirmed, you can enter a buy trade. Conversely, if you notice a negative divergence near a resistance level and it is confirmed, a sell trade may be the appropriate action. This strategy leverages the power of both divergence and key price levels to provide additional confirmation before entering a trade.
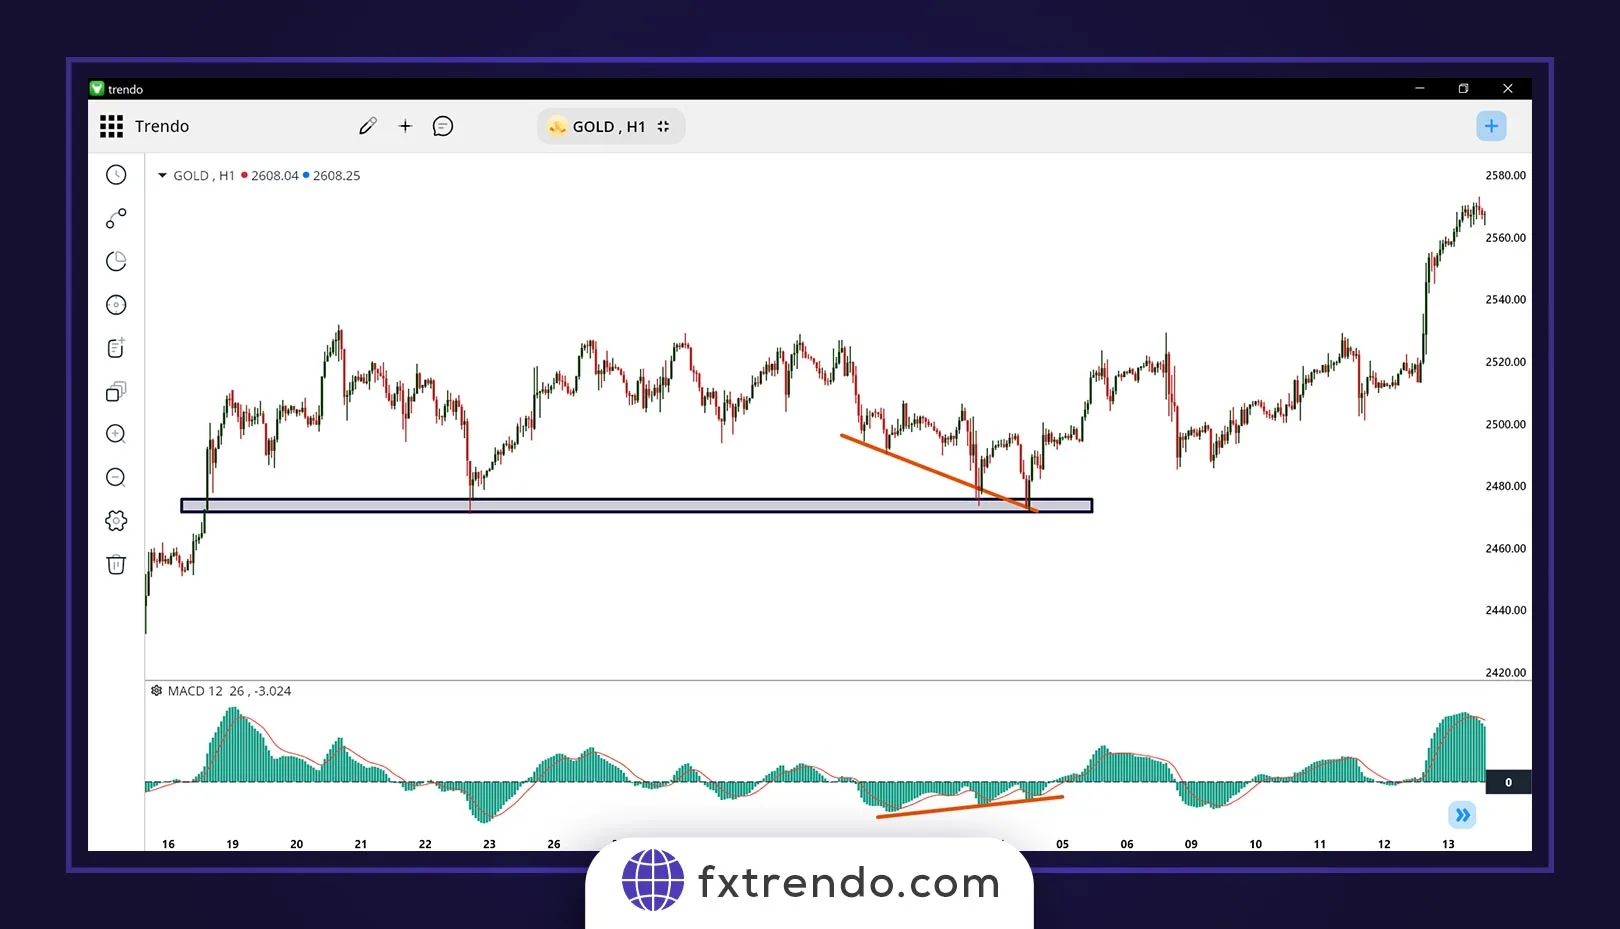
For example, as you can see in the image below of the global gold chart on the H1 timeframe, the price has created a positive divergence with the MACD indicator near a strong support level, and after that, the bullish trend of gold (XAUUSD) has begun:
By combining divergence with support and resistance, traders can gain greater confidence in their decisions and enhance their chances of success in the market.
By implementing these divergence strategies, traders can optimize their trading decisions, identify market turning points, and potentially increase their profitability. However, it is important to remember that no strategy is foolproof. Always combine divergence analysis with other technical tools and maintain disciplined risk management practices for the best results.
Read more: Features of the best broker for trading gold
Common Mistakes Traders Make When Using Divergence for Signal Generation
Although divergence is one of the powerful and widely used tools in technical analysis, many traders make mistakes while using it, which leads to incorrect entries and losing trades. Therefore, understanding these mistakes is considered the first step in improving the accuracy of a divergence strategy. In the following section, we will review 4 of the most common mistakes.
1. Incorrect identification of lows and highs
One of the most common mistakes is incorrectly marking highs and lows. Many traders mistakenly identify minor fluctuations as actual highs or lows, which creates false signals. For correct identification, only the main highs and lows (Swing High / Swing Low) should be considered, and small price noise must be ignored. The more significant and clearer these points are, the more valid the divergence will be.
2. Ignoring the overall market trend
One of the key principles of technical analysis is that “the trend is your friend.” Many traders focus only on divergence and ignore the dominant trend. As a result, entering a trade without checking higher timeframes or the primary trend often leads to incorrect positioning.
In strong bullish or bearish trends, divergences may appear multiple times without leading to an actual reversal. Divergence against the trend is generally weaker and cannot be considered a definite signal for a trend change. Therefore, always examine the trend first, then interpret divergence within its context and use it as a signal.
3. Entering too early without confirmation
Divergence alone is not a sufficient reason to enter a trade. Many traders enter a countertrend position as soon as they spot the first sign of divergence, even though the market may still lack the momentum required for a reversal.
Confirmations such as a trendline break, pattern formation, reversal candlestick, or reaction to support/resistance levels play an essential role in increasing the reliability of divergence.
4. Not paying attention to hidden divergences (Hidden Divergence)
Hidden divergence is one of the most powerful tools for identifying trend continuation, yet it is often overlooked compared to regular divergence. Ignoring this type of divergence causes the trader to:
- miss continuation signals,
- enter trades prematurely,
- and fail to identify the end of a correction correctly.
Conclusion
Divergence is an important concept in technical analysis that helps identify trading opportunities and manage risk, especially in the forex market. However, divergence does not always provide reliable signals and may fail in certain situations.
Traders should follow the principles outlined in this article and combine divergence with other technical analysis tools for more accurate decision-making.
By understanding divergence and its applications, traders can improve their trading strategies. Success in trading depends on knowledge, experience, and risk management. With continuous learning and the effective use of analytical tools, better results are achievable.
Frequently Asked Questions (FAQs)
1. What is divergence?
2. What indicators are used to identify divergence?
3. Is divergence always a valid signal?
4. When is the best time to trade using divergence?
5. Are divergences suitable for all timeframes?
6. What is the difference between regular and hidden divergence?
Regular divergence signals a potential reversal in the trend, while hidden divergence suggests a continuation of the current trend. Regular divergence occurs when the price creates a new high or low, but the indicator does not, indicating weakening momentum. Hidden divergence occurs when the price makes a l