
Weekly Forex and Cryptocurrency Analysis | The Impact of the Fed Meeting and New Tariffs on Gold, Forex, and Cryptocurrency Prices

On the brink of one of summer’s most pivotal weeks, global markets have slipped into a finely balanced state of anticipation and decision-making. Two events hold the power to reset every major asset class: the 1 August deadline for new U.S. tariffs on the European Union, and the Federal Reserve’s rate-setting meeting on Wednesday night.
This weekly analysis focuses on the technical situation for headline symbols, including gold, Bitcoin, EUR/USD, and the Dow Jones, all of which are now trading at critical levels and primed for a reaction to these looming fundamental catalysts. Drawing on the latest market data and price structure, we sketch each asset’s short-term path in the analysis that follows.
Fundamental Market Analysis | Fed and Trump Clash Over Interest Rates
This week opens with two pivotal events that could steer financial markets in the short term. First comes the August 1, 2025, deadline for the United States to levy fresh tariffs on European imports. Reports indicate that, if no accord is reached, a blanket 30% tariff will be imposed on all EU goods; an alternative draft agreement suggests a baseline 15% tariff on most industrial products. The final round of talks between Donald Trump and Ursula von der Leyen, President of the European Commission, is scheduled for Sunday, 27 July, in Scotland, with markets expected to react as trading opens early on Monday. A breakdown in negotiations would likely pressure the euro and European stock markets, while gold and the Japanese yen could draw a fresh wave of safe-haven demand.
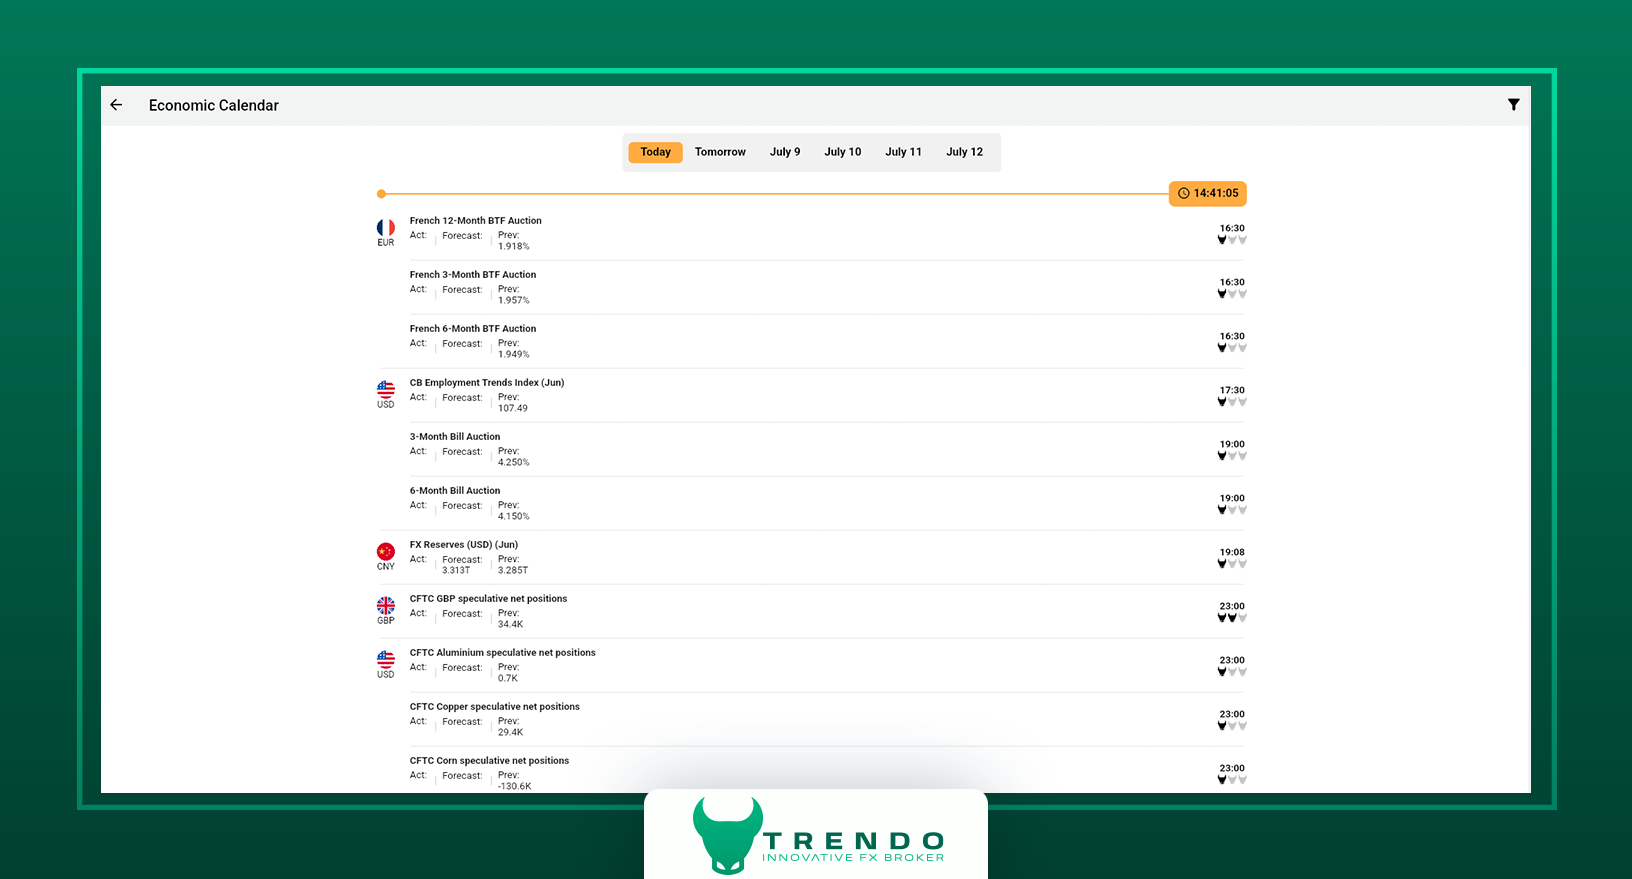
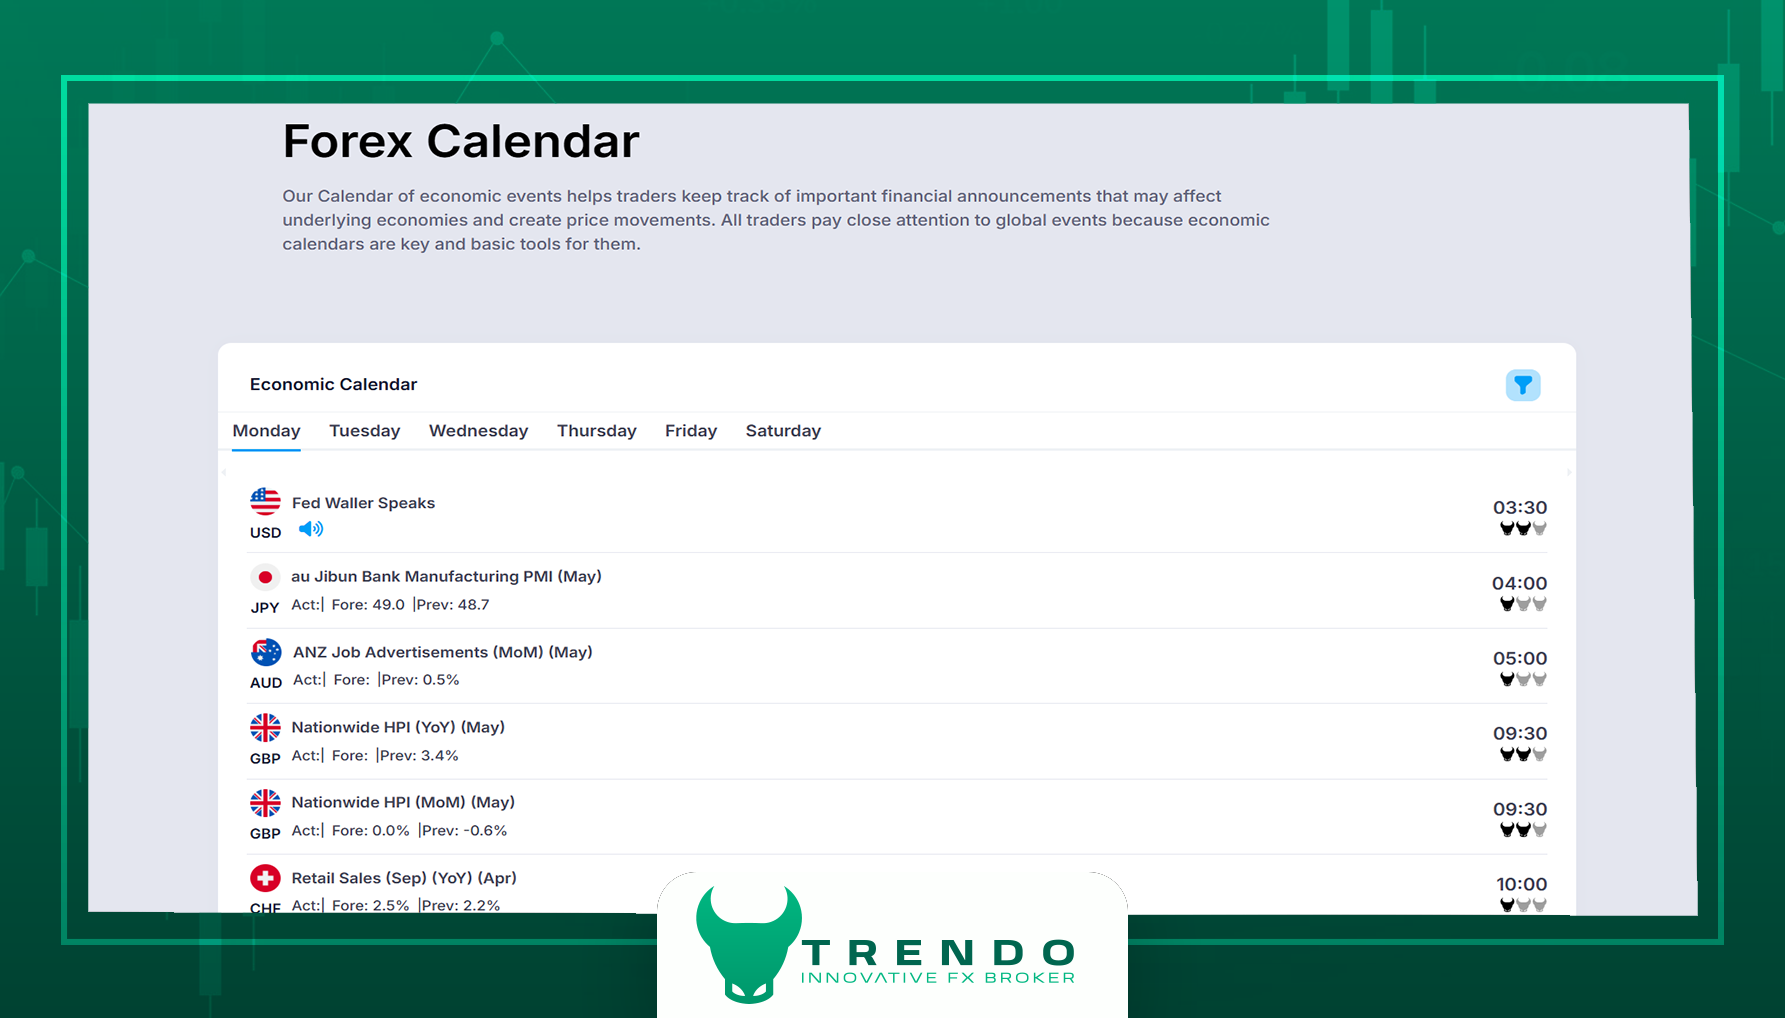
As highlighted on Trendo’s Economic Calendar, the second catalyst is the Federal Reserve meeting on Wednesday, 30 July 2025. The target range will be released at the scheduled time, followed by Jerome Powell’s press conference a few hours later. Consensus sees rates unchanged at 4.25%–4.50%, yet traders will dissect the statement’s tone for clues about a possible cut at the September meeting. If Powell signals readiness to ease, pressure on the dollar Index will increase, lifting risky assets such as gold, Bitcoin, and U.S. stock indices. Conversely, a hawkish or neutral stance may revive demand for the greenback.
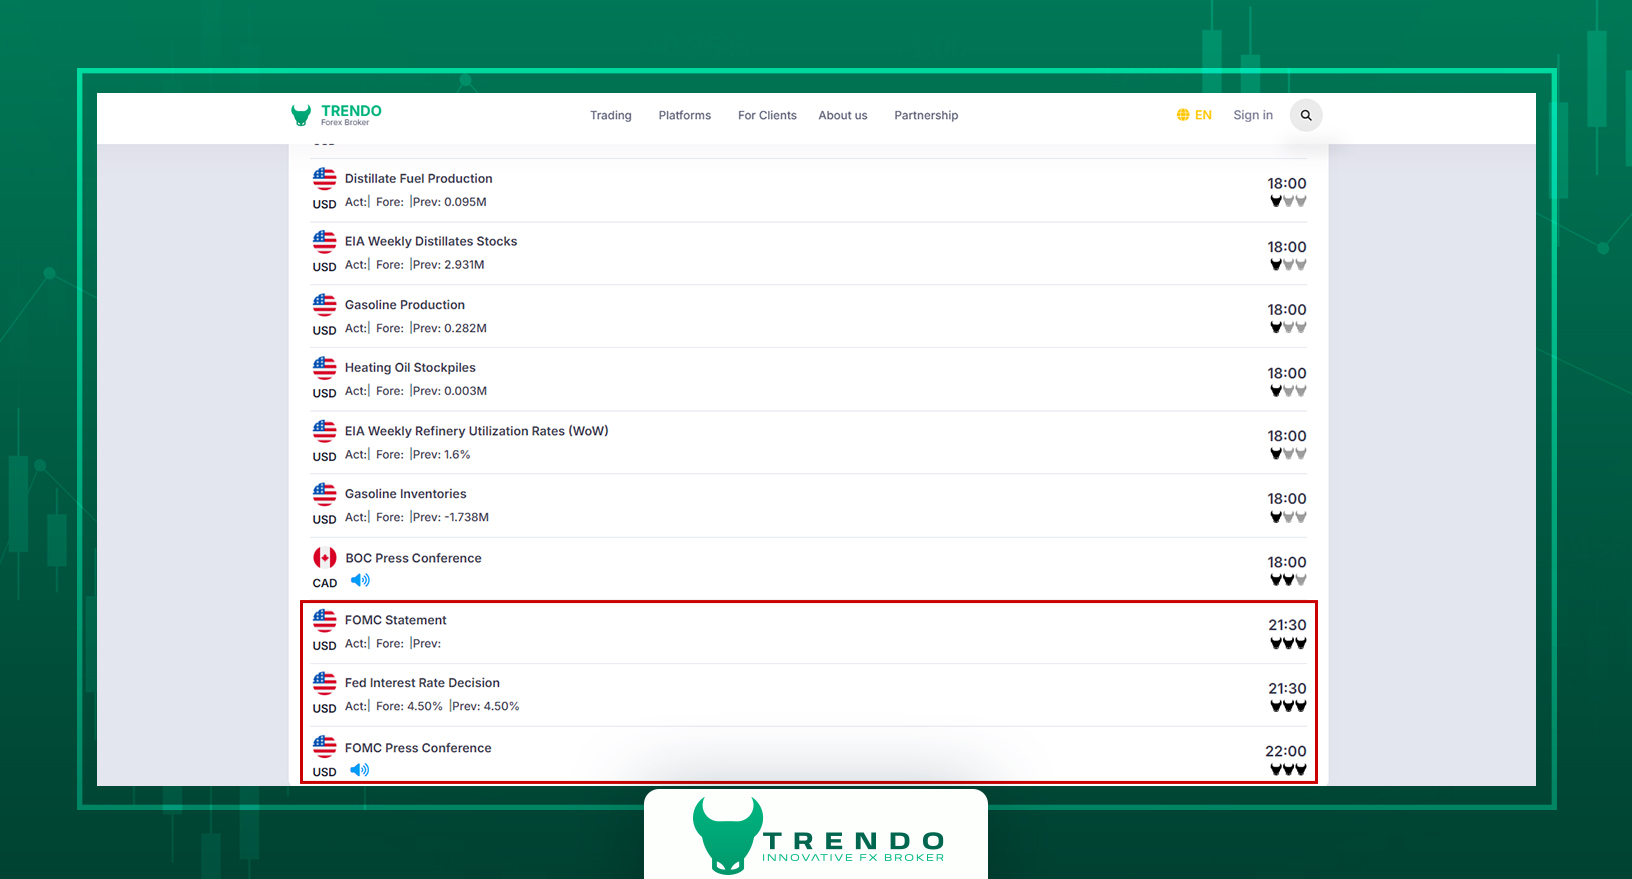
Forex Economic Calendar on Trendo
Technical Analysis of Key Assets
In this section of the Weekly Market Analysis, we focus on the technical structure of assets currently positioned at critical price levels. Gold, Bitcoin, EUR/USD, and the Dow Jones are on the brink of a breakout or a pullback. Below, we review the price action of these symbols to analyze the short- and mid-term scenarios.
Gold Technical Analysis | Breaking the Trendline and Key Support Level
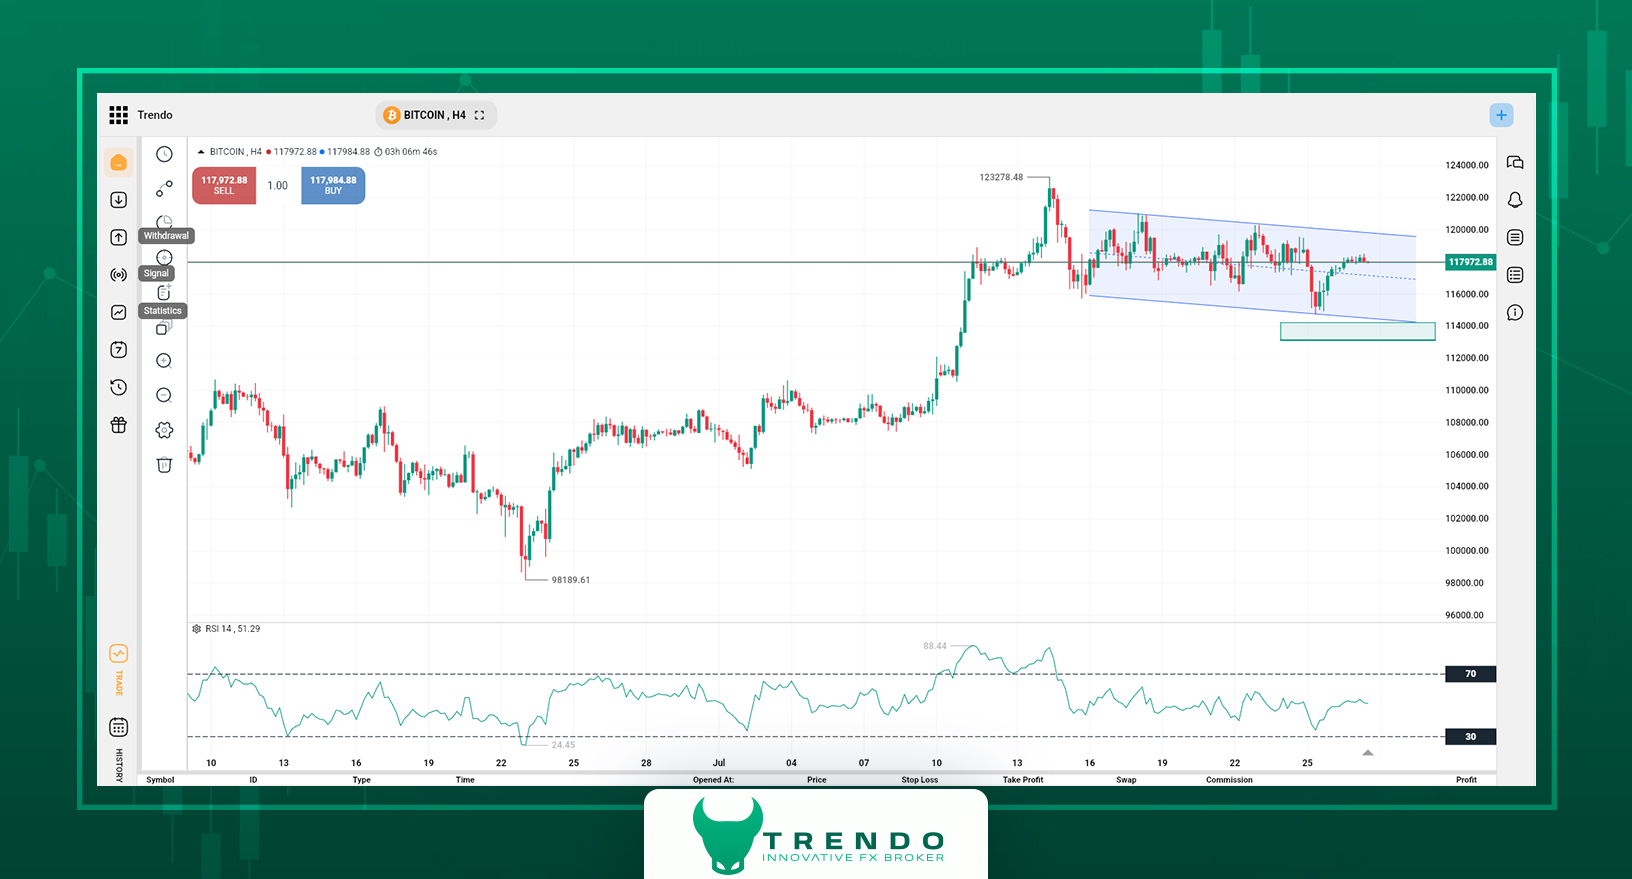
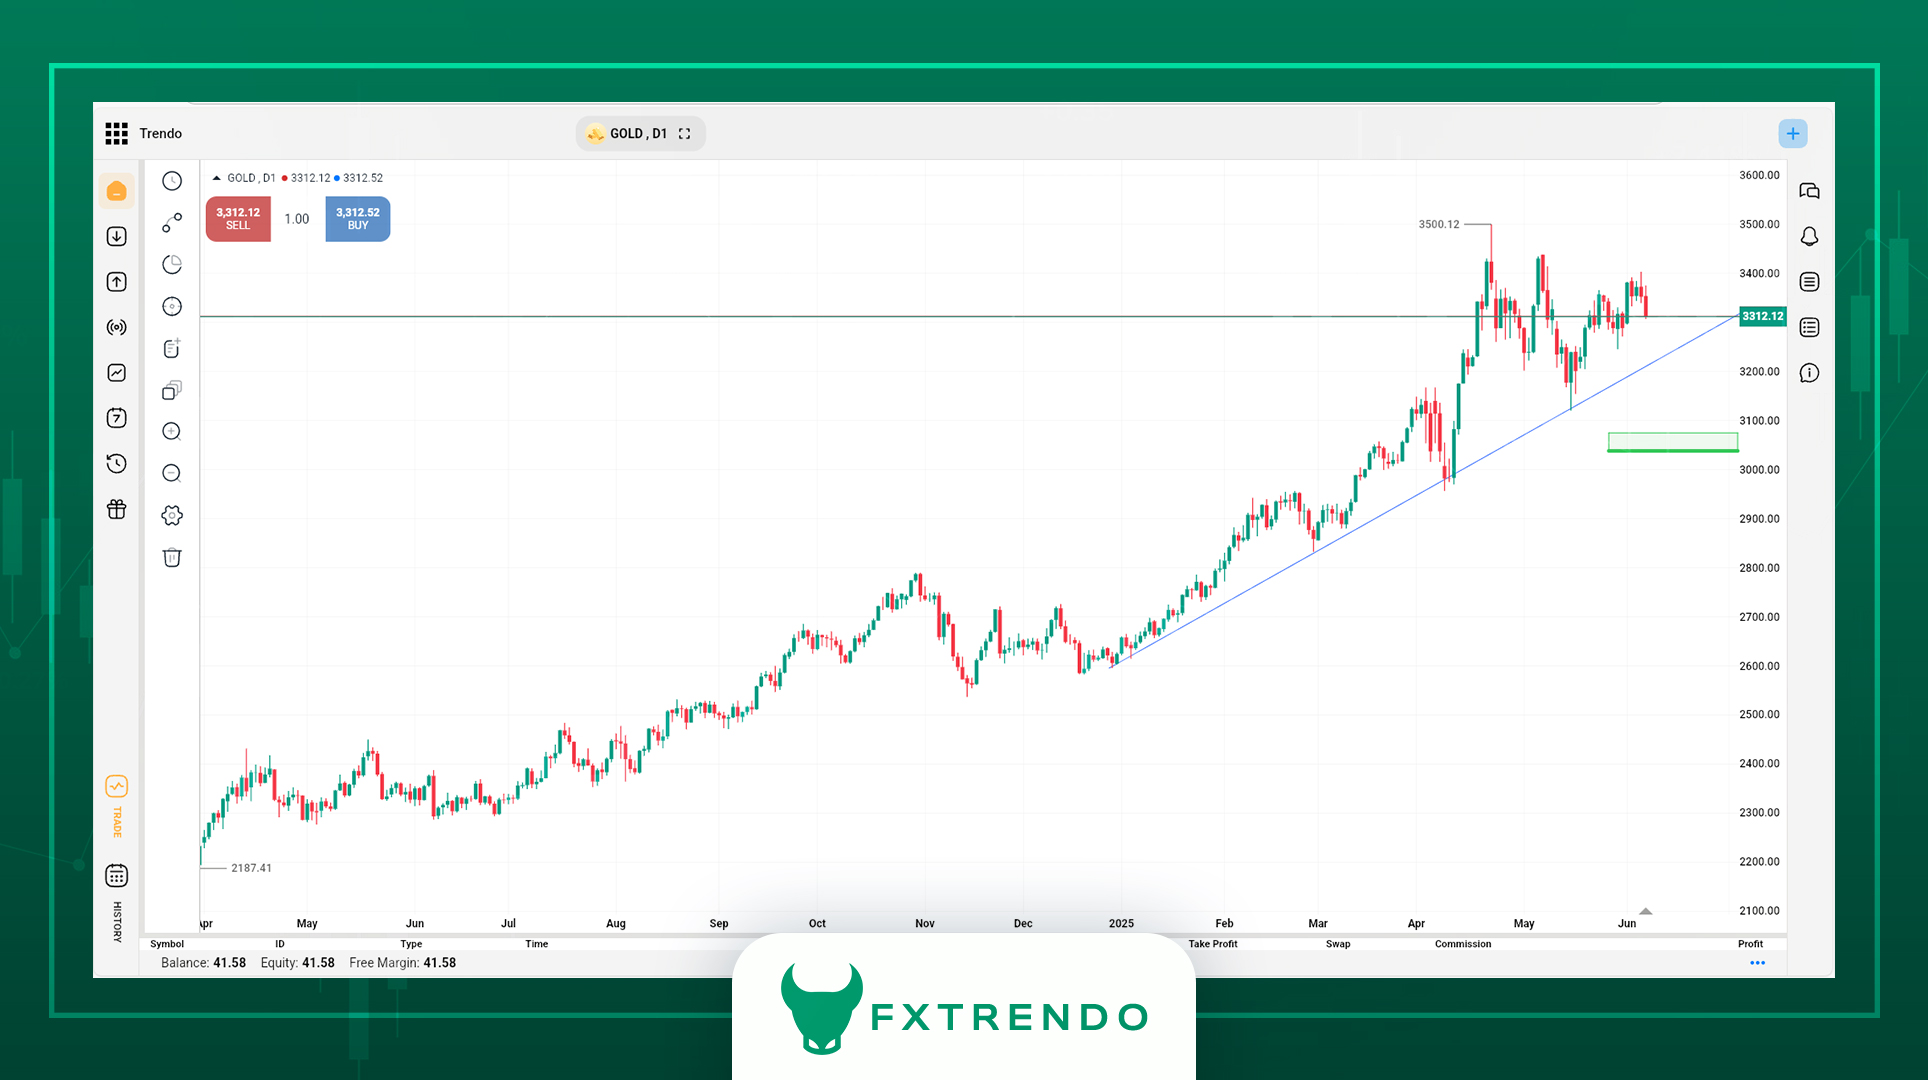
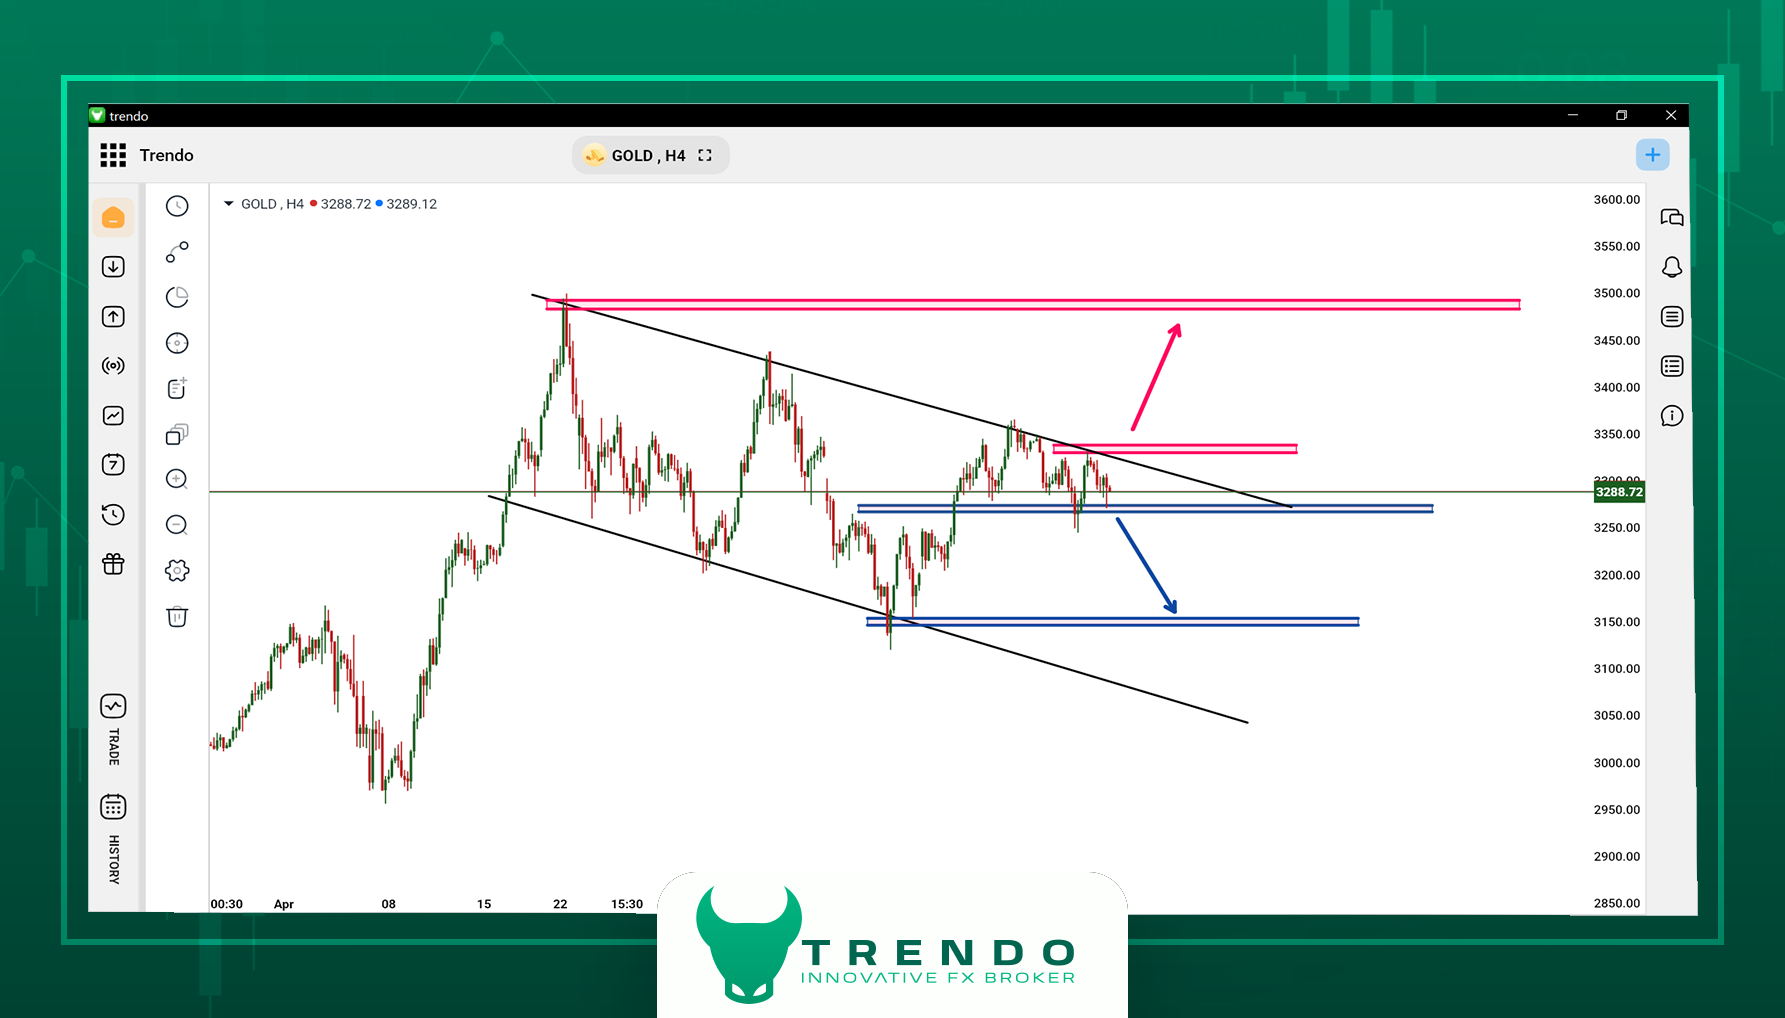
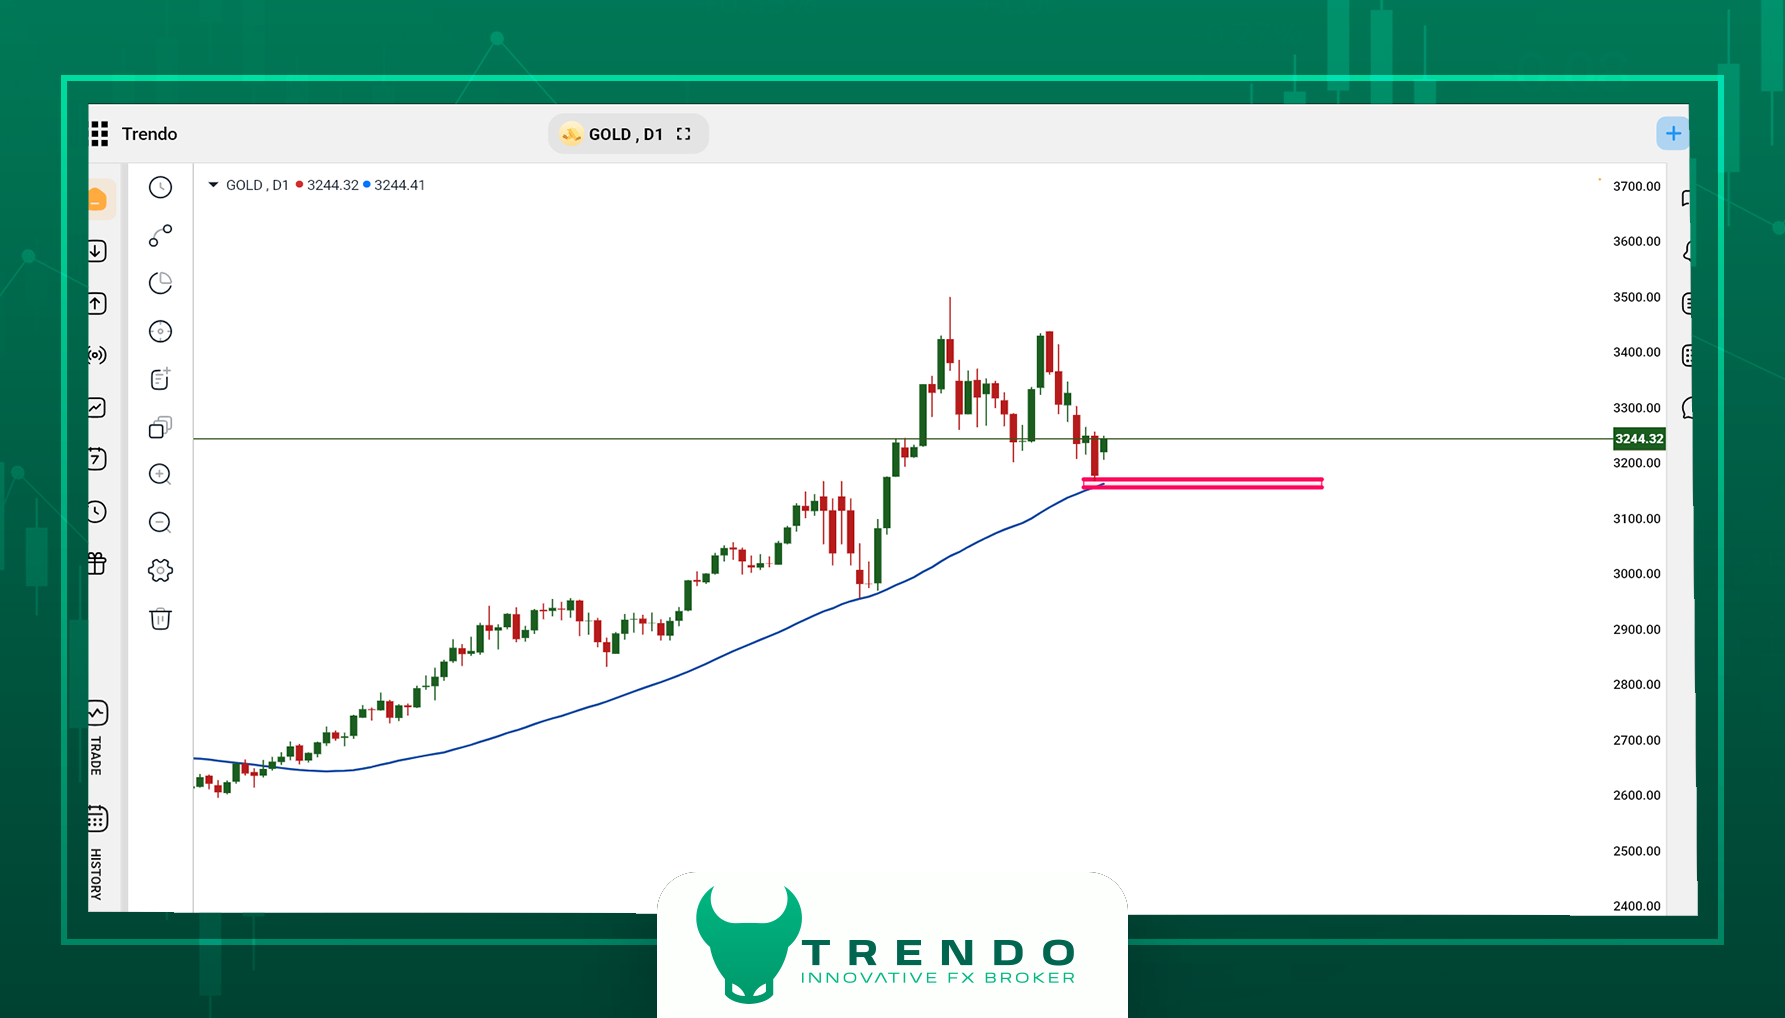
Gold has moved to the centre of traders’ screens this week after a strong trendline breakout on the 4-hour timeframe, pushing the metal into a delicate position. The price is oscillating near $3,336 and, after breaking, has reacted to the $3,320 – $3,325 support band. Within the 4-hour timeframe, this zone serves as significant support, and the price action here will determine the next leg. There are two possible scenarios here:
Bullish scenario: If the band holds and the trendline breach proves a false breakout, odds favour a rebound toward the $3,400 – $3,410 resistance area, which also contains a Fair Value Gap.
Bearish scenario: A decisive close below $3,320 would lock in a downside consolidation, placing the first corrective target at $3,240 – $3,250.
Traders should closely track gold’s behavior in this zone, as confirming or rejecting the break will outline the metal’s path for the days ahead. View the gold chart on the Trendo platform in the image below.
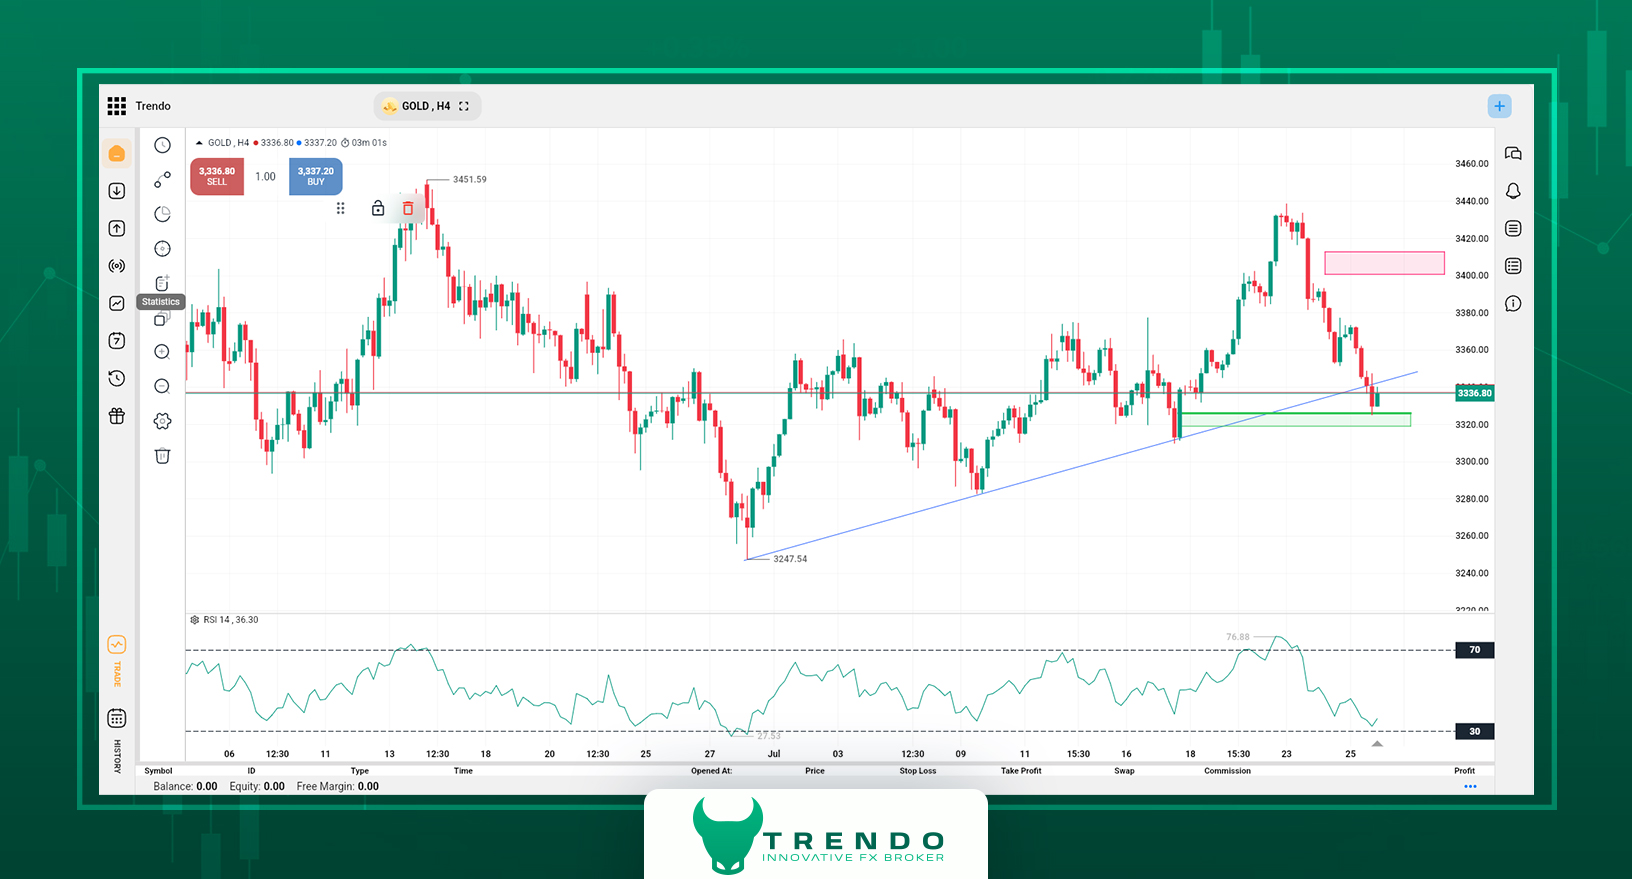
Gold technical analysis on Trendo Broker
Dow Jones Technical Analysis | Psychological Resistance on the Verge of a Break
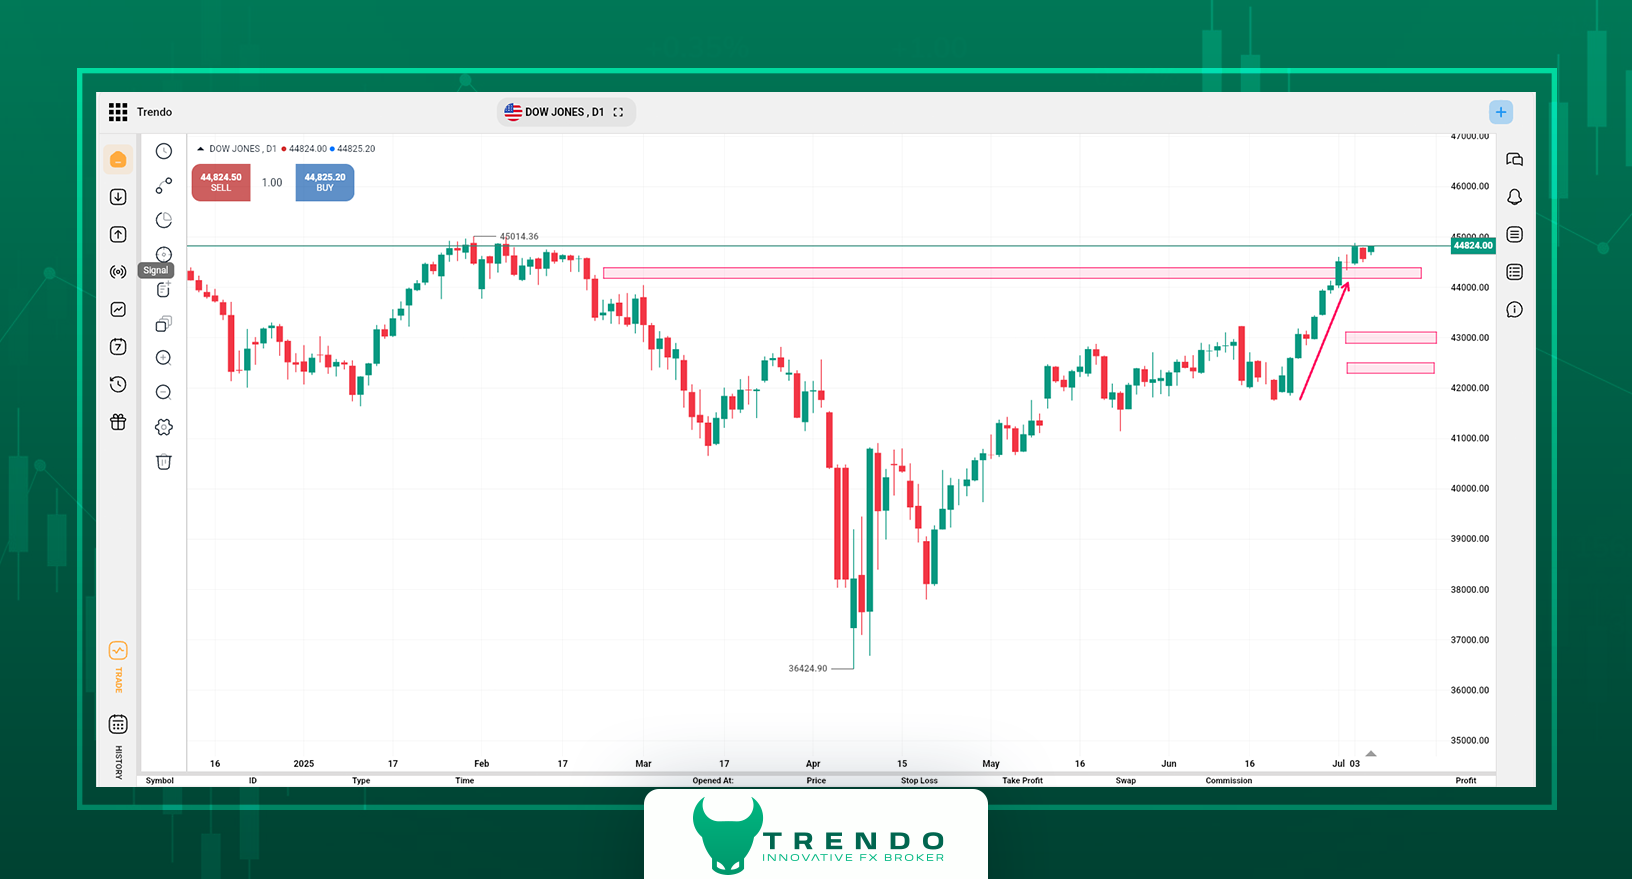
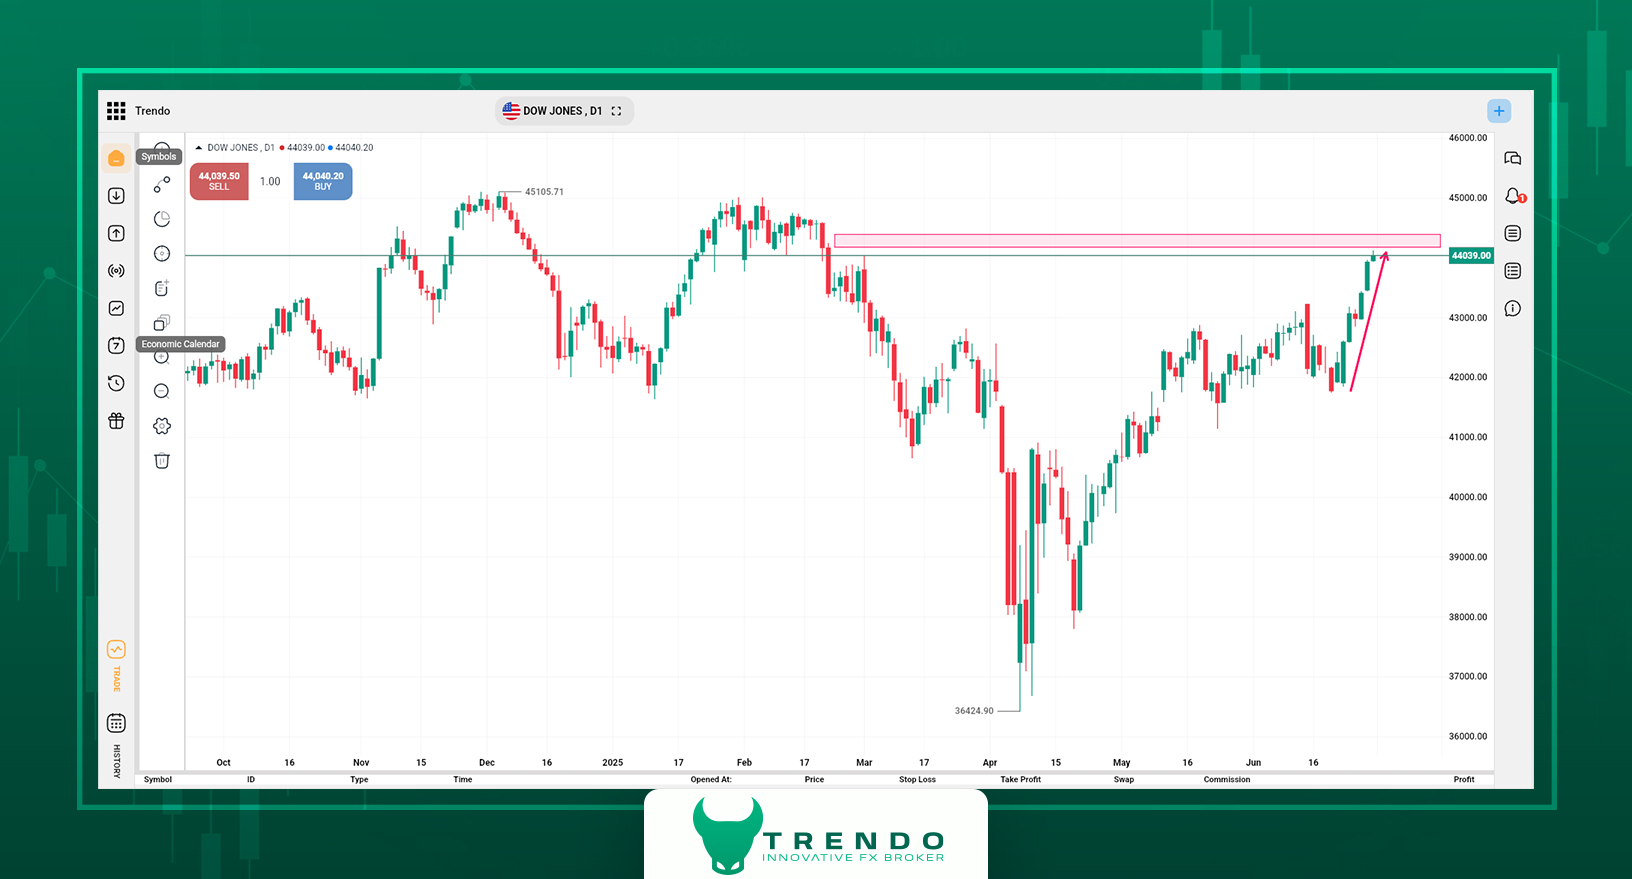
As the price chart for the Dow Jones symbol on the Trendo platform shows, the index has climbed back to the 45,000 level—a major psychological barrier that has twice repelled price. A third touch now raises the odds of a decisive breakout. Above this area, ample liquidity is available for stop-hunts; if the price can clear and hold, the near-term target extends toward the 45,300–45,500 point zone.
However, a check of the daily RSI reveals negative divergence between price and relative strength—an early warning that upside momentum may be fading. Should the 45,000 level be breached, traders must remain vigilant to the risk of a swift pullback and brief correction. On the downside, initial support rests around 43,500 points; losing that level would turn attention to the next support band at 42,300–42,500 points.
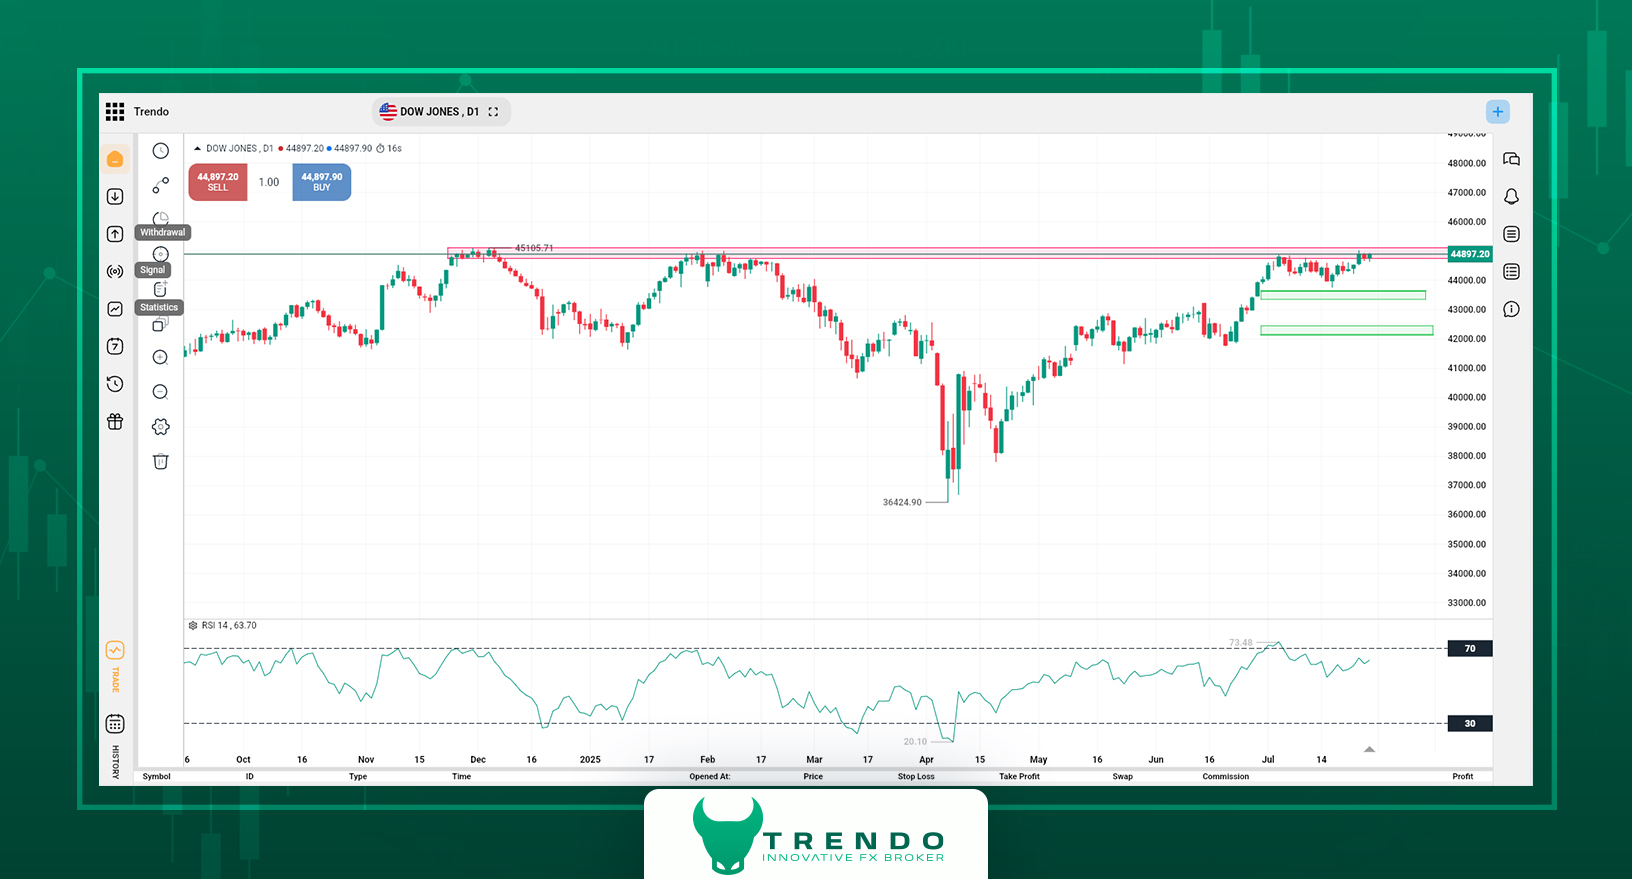
Dow Jones technical analysis on the Trendo trading platform
EUR/USD Technical Analysis | Awaiting the ECB Rate Call and Tariff Talks Outcome
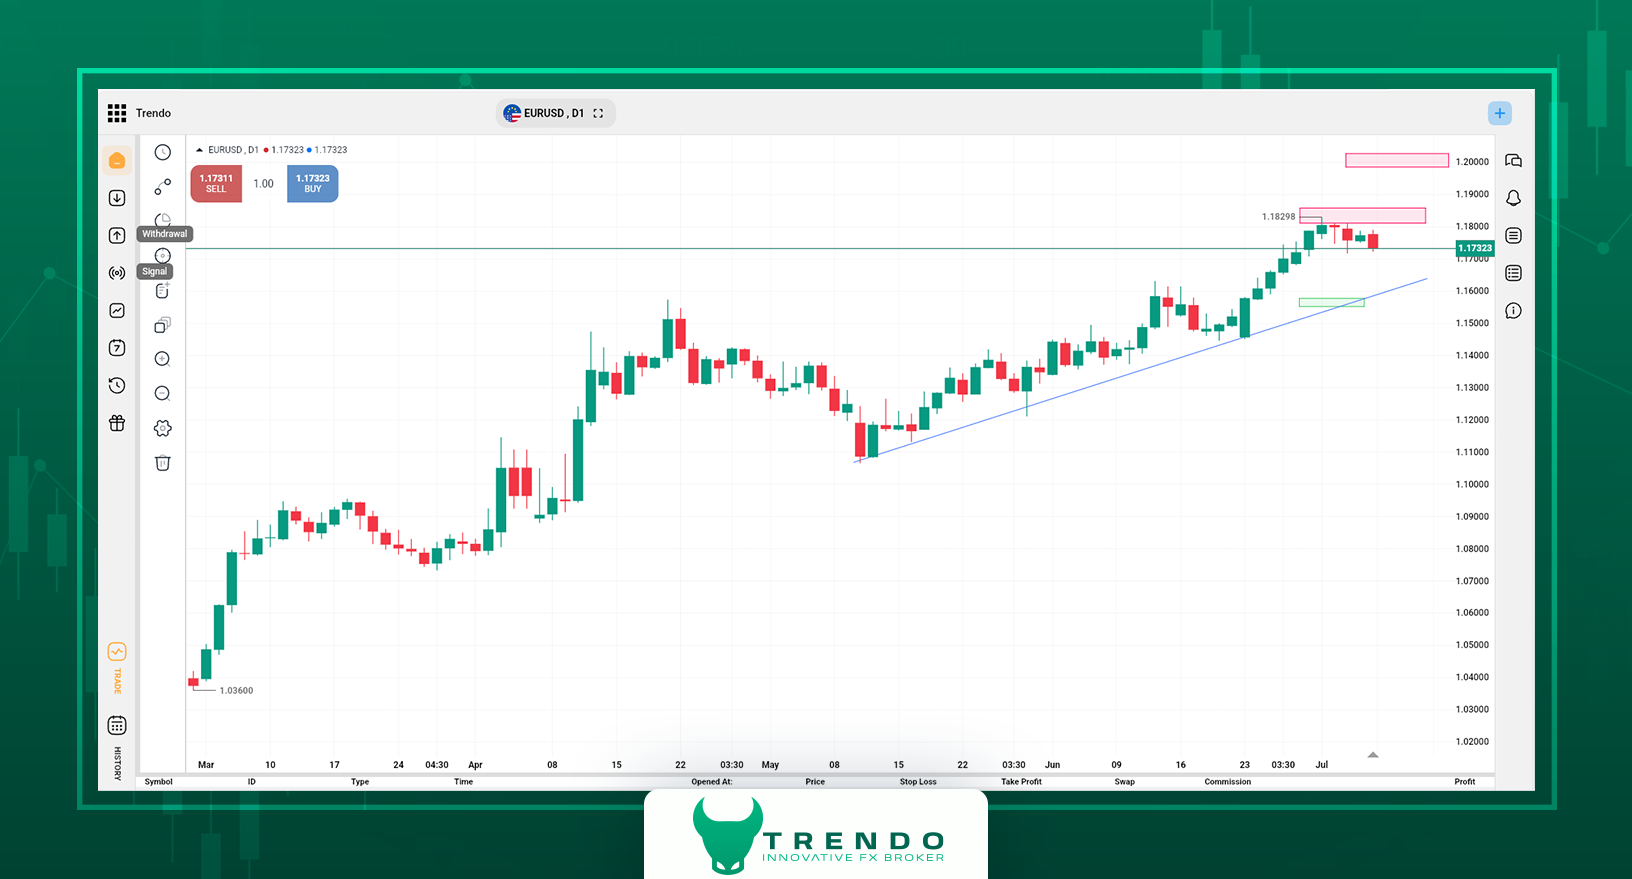
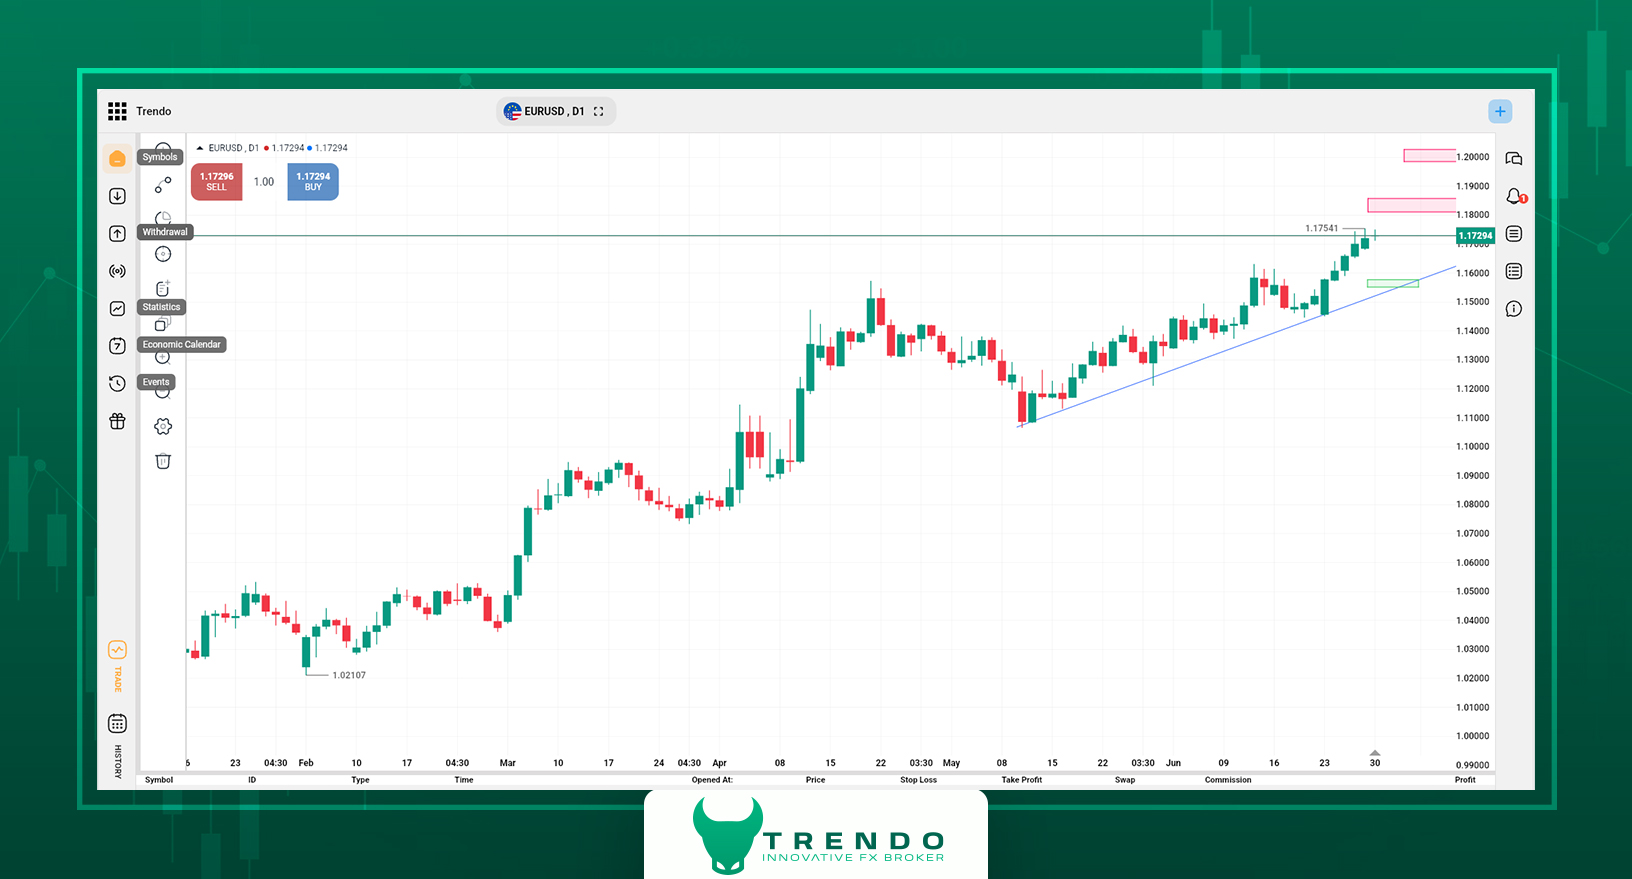
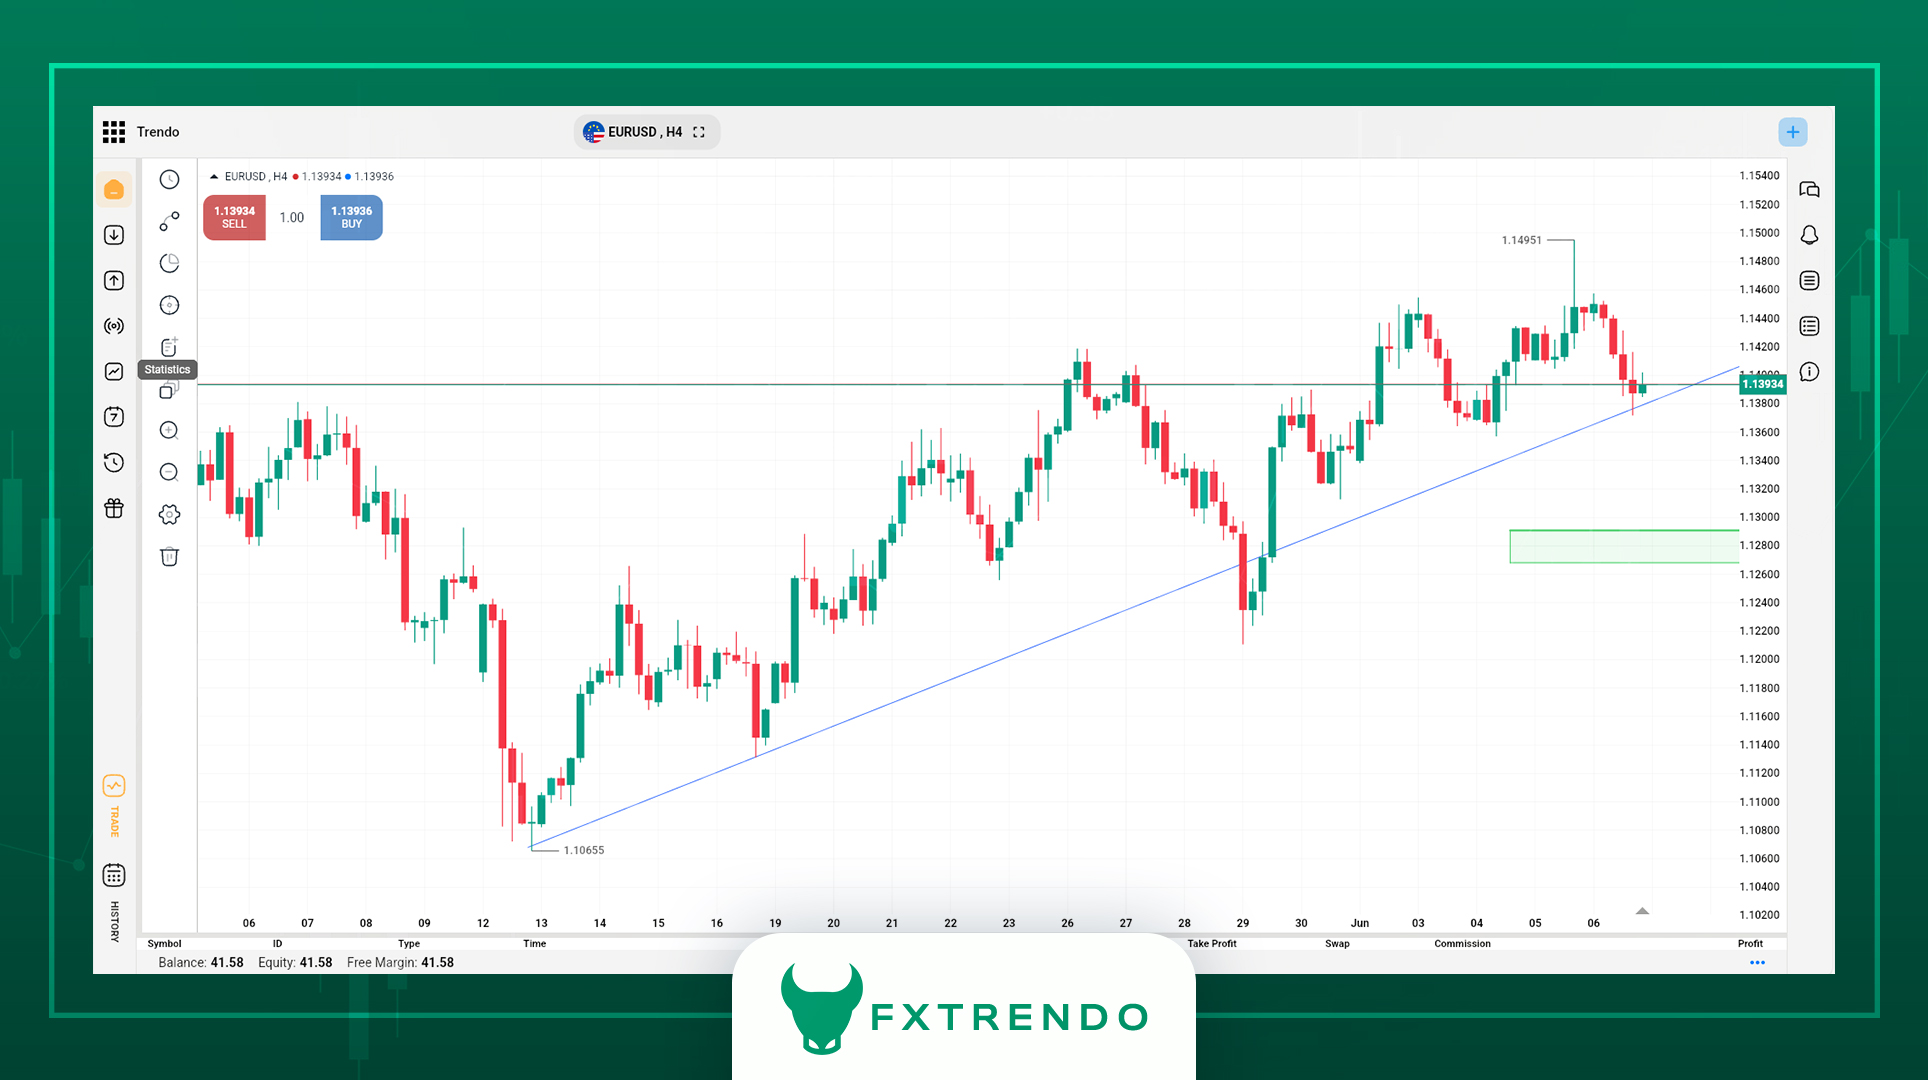
Within this week’s Weekly Market Analysis, the EUR/USD pair rebounded after tagging the 1.1685 support highlighted last week and is now trading near 1.1739. If no fresh political or monetary shock emerges, the first upside barrier sits at 1.1800; a clean break there could clear the way for a climb toward the 1.2000 zone.
The euro’s outlook, however, hinges on two fundamental drivers. First, the August 1st tariff deadline, which could put significant pressure on the Euro if negotiations fail. Second, the Fed meeting on 30 July, where Jerome Powell’s tone regarding a rate cut in September will shape the dollar’s path. Should EUR/USD push up to 1.20, watch for a potential negative RSI divergence on the daily chart—a warning that could trigger a short-lived pullback or trend change. Traders must remain vigilant to every policy announcement and tariff update. See the chart in the image below from the Trendo trading platform.
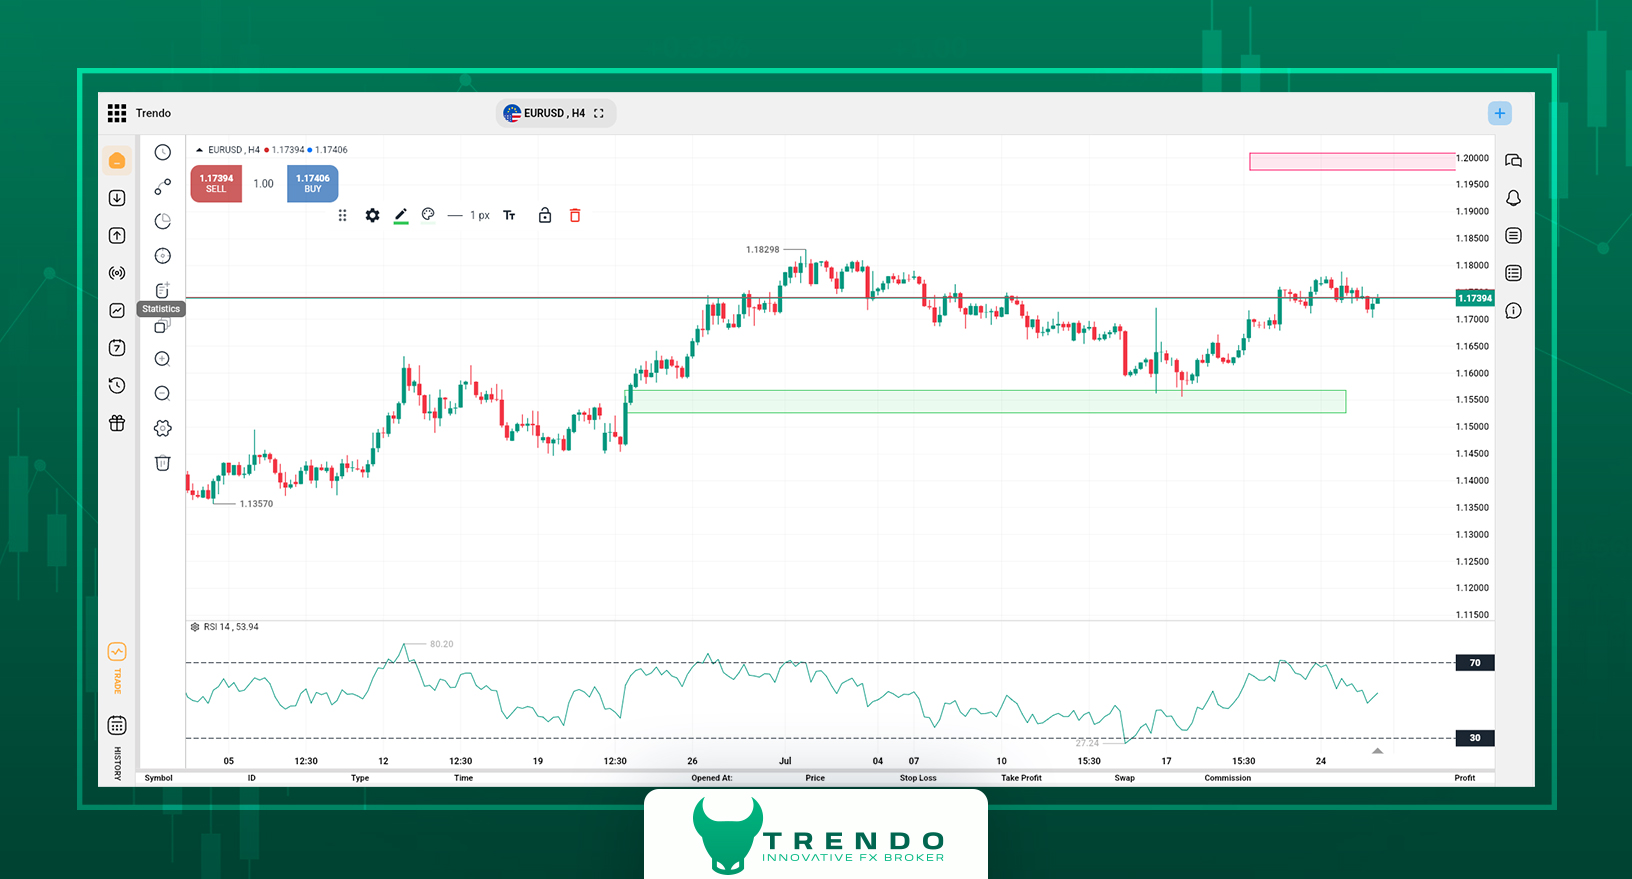
EUR/USD technical analysis on the Trendo platform
Bitcoin Analysis | Consolidation Below the All-Time High
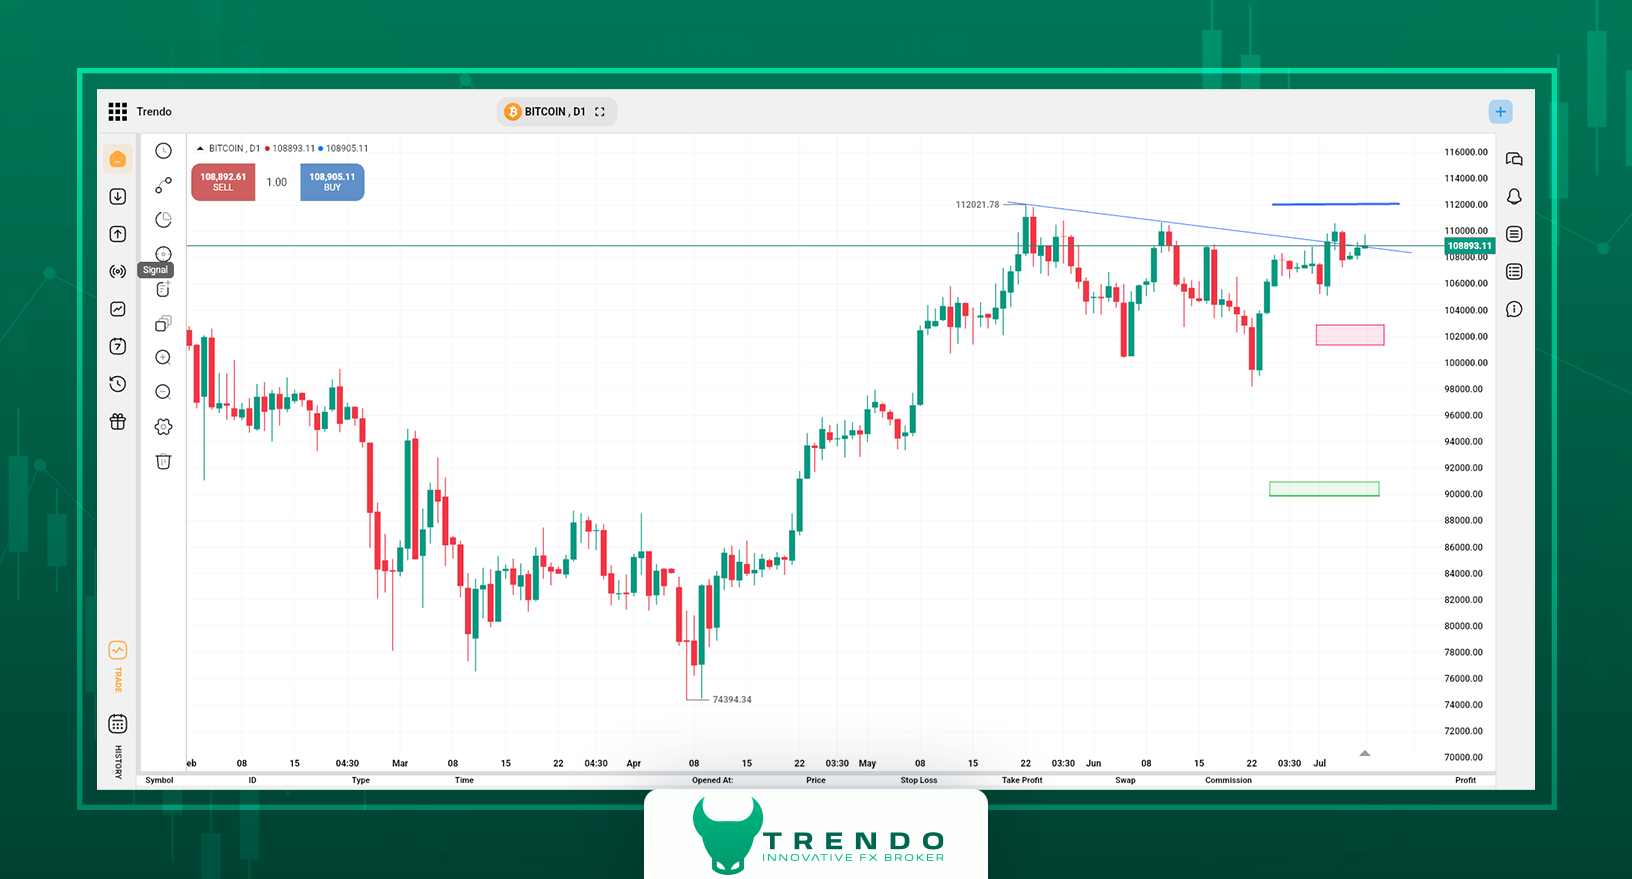
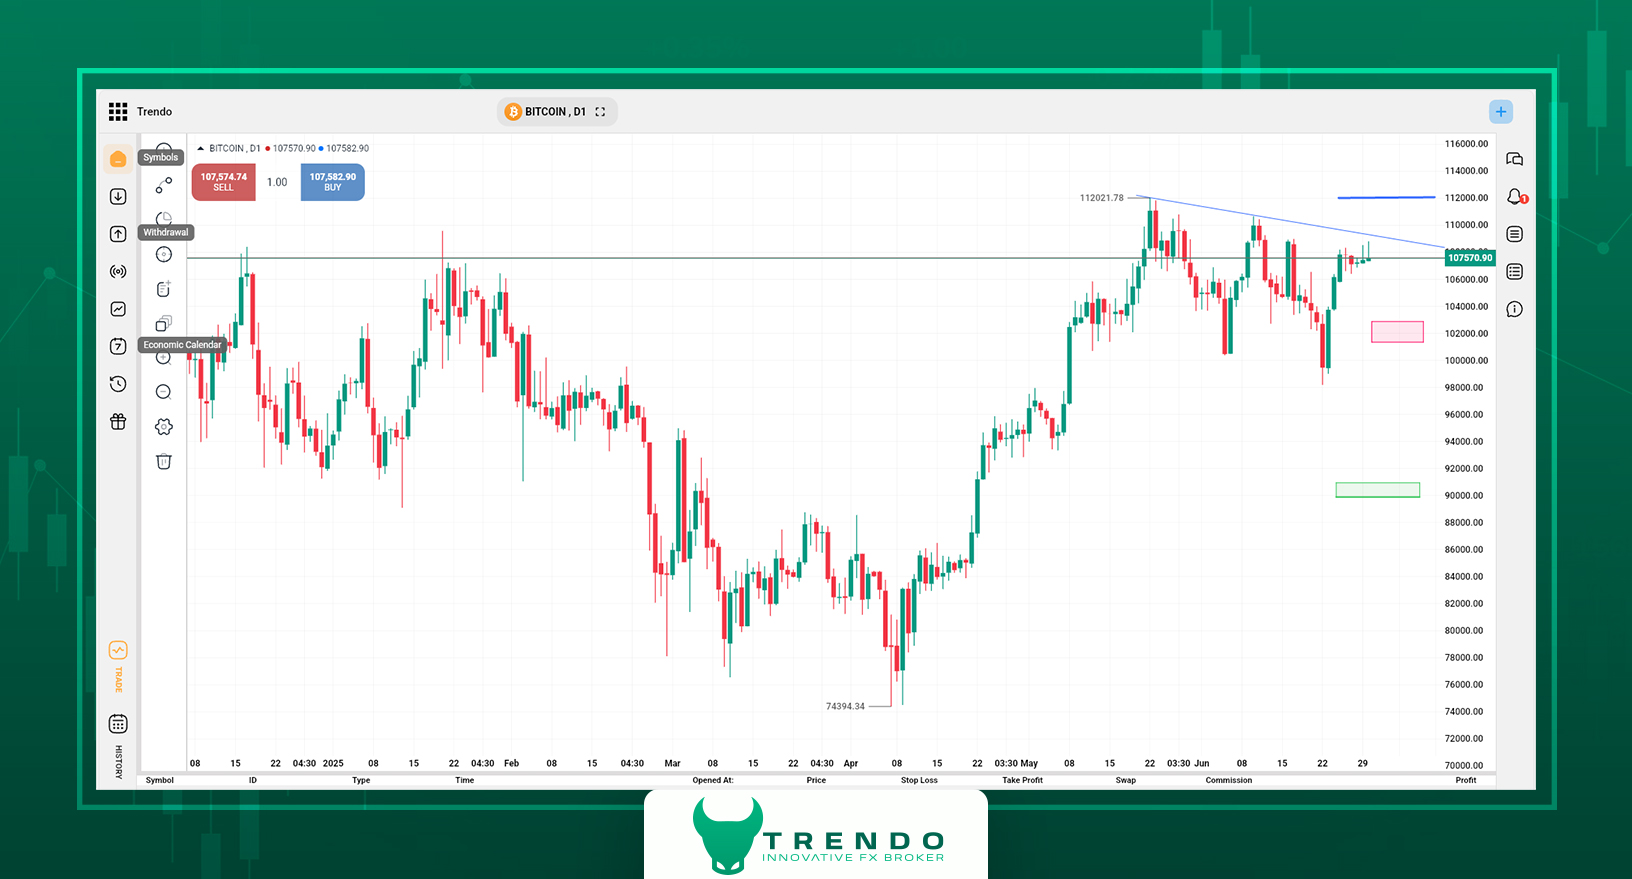
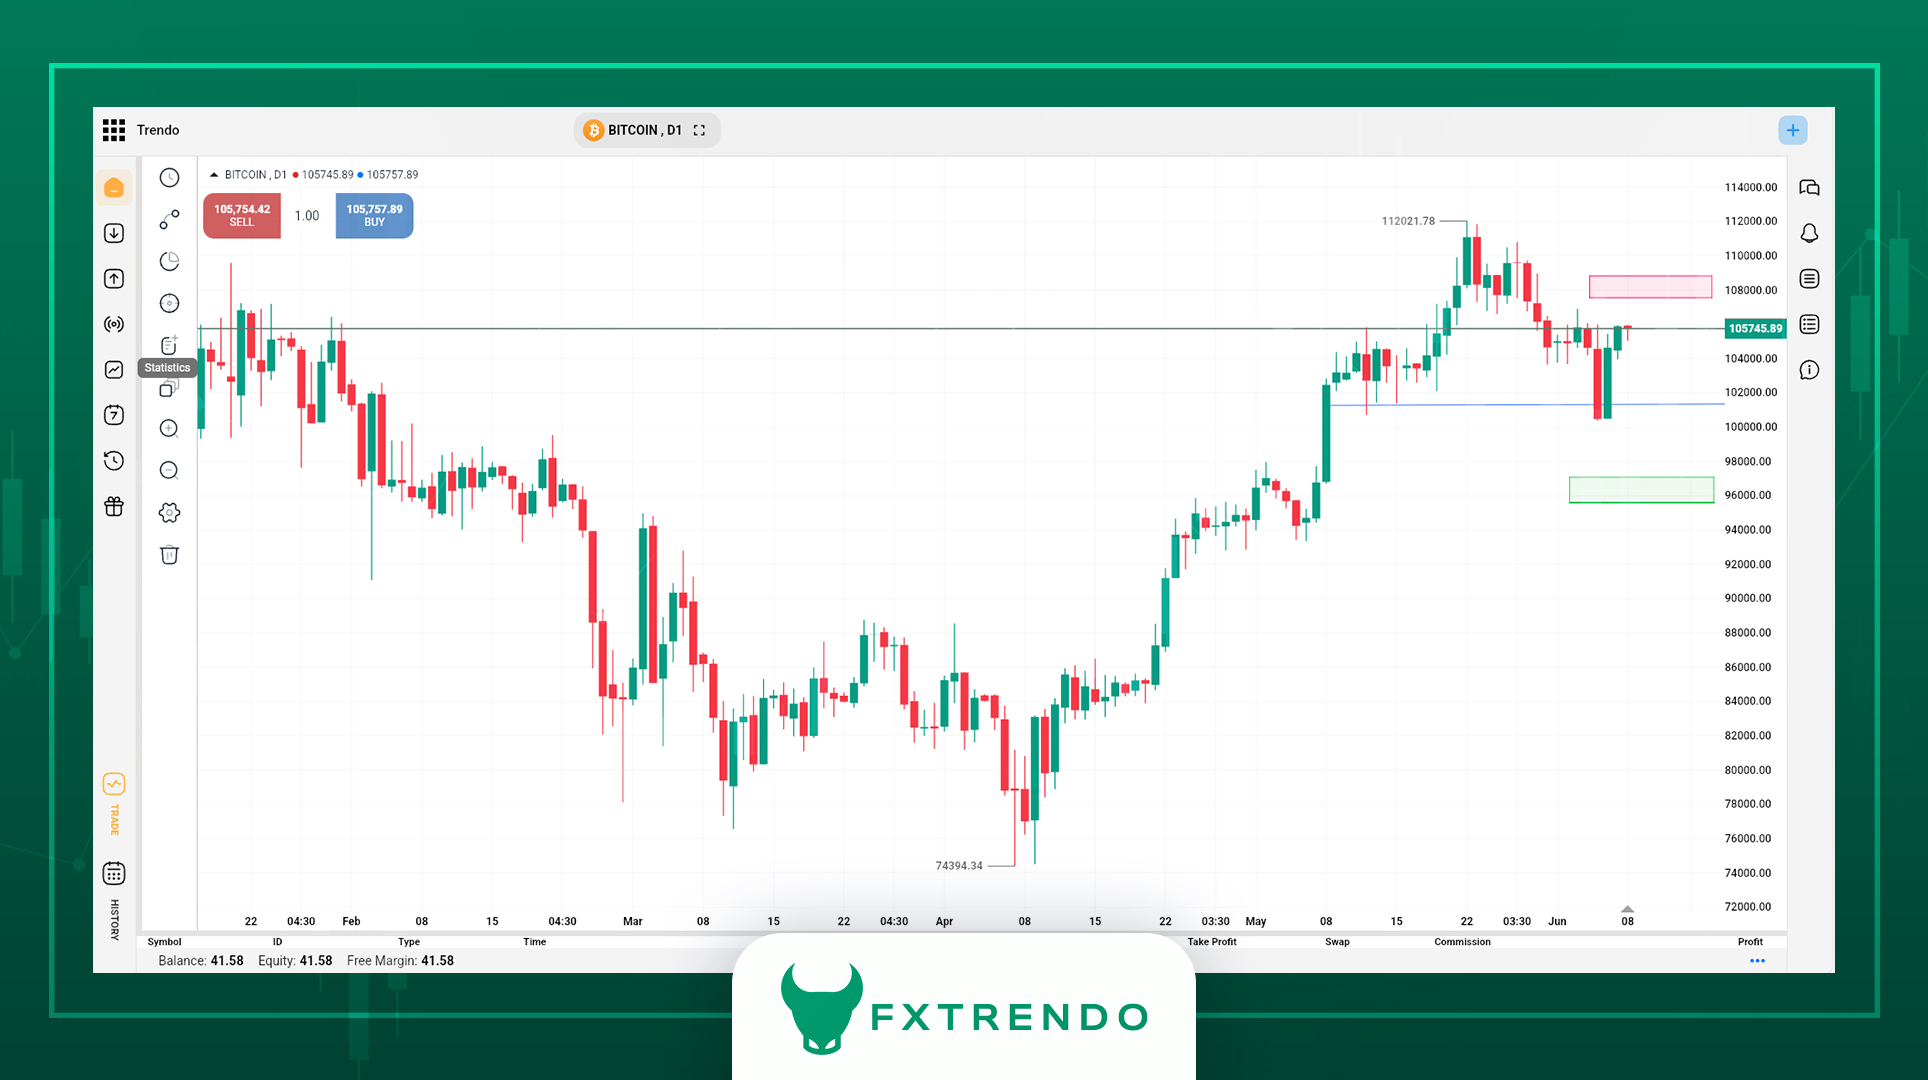
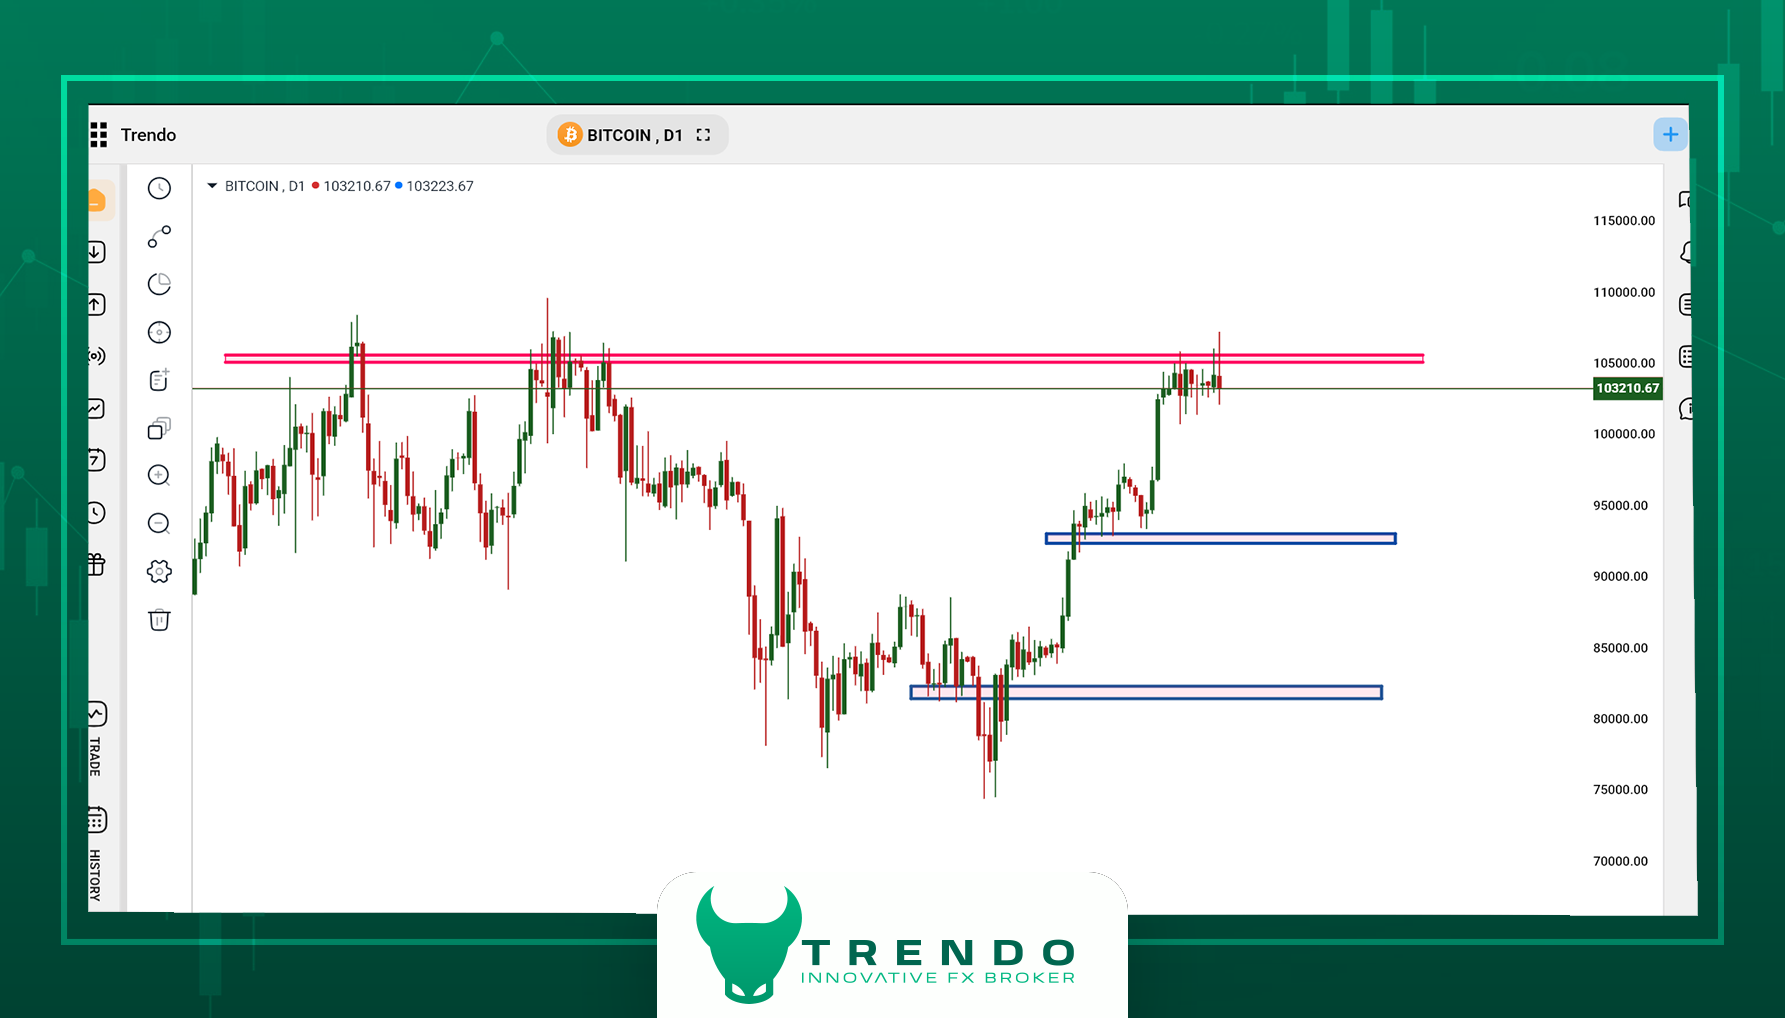
As the Bitcoin price chart on the Trendo trading platform shows, Bitcoin remains trapped in a tight, high-stakes zone. Over the past week, the coin has remained relatively stable, oscillating around $118,000—a psychological pause that signals the market is awaiting its next catalyst. The recent record of $124,000 stands as the primary resistance; a clear break above it could open a path toward Fibonacci extension targets in the $130,000–$ 135,000 range.
Bitcoin’s holding pattern centers on Wednesday night’s FOMC outcome (July 30). Traders are seeking clues about a potential rate cut in September; a dovish hint would likely weaken the U.S. Dollar Index and redirect capital into riskier assets, including Bitcoin. Conversely, a neutral statement could drag the price back toward $114,000. Currently, the market’s reaction to the Fed's message will set the next directional phase for Bitcoin.
Bitcoin technical analysis on Trendo Broker
Final Overview | Seizing Volatility, Acting in Real Time
In this weekly Analysis by Trendo, we saw core asset classes poised to react to the key economic and political events. On the one hand, the Federal Reserve meeting and Jerome Powell’s press briefing could reset the near-term path for the Dollar Index, gold, and crypto. On the other hand, a final U.S.–EU trade result will directly impact the euro, European stock markets, and overall risk sentiment.
In such conditions, instant access, advanced charting, and lightning-fast execution are vital. The Trendo trading platform delivers professional-grade tools for a reliable, swift, and precise trading experience in global markets.
For live insights, trade alerts, and real-time macro news, join Trendo’s official Telegram channel now and stay a step ahead.
Forex Weekly Analysis - June 29, 2025
Global markets have just wrapped up a turbulent and pivotal week. Unprecedented cryptocurrency legislation in the U.S. has paved the way for new developments in crypto assets, while political tensions between Washington and Brussels have intensified amid threats of steep tariffs. Meanwhile, relentless attacks by President Trump on Jerome Powell and the Federal Reserve have severely shaken expectations for U.S. monetary policy.
These simultaneous events have placed key assets, such as Gold, Bitcoin, Ethereum, EUR/USD, and major stock indices, in tight but potentially explosive technical positions, where any fresh catalyst could trigger substantial moves. In this week’s market analysis from the Trendo team, we closely examine fundamental drivers and technical setups, mapping out potential pathways for the days ahead. Stay with us through this report if you’re looking to navigate this volatility with greater clarity and informed decision-making.
Fundamental Market Analysis | Multi-Front Pressure on Monetary Policy, Global Trade, and Crypto
The new trading week opens with markets facing a trio of heavyweight catalysts: escalating US–EU trade tensions, unprecedented political pressure on the Federal Reserve, and the formal rollout of a U.S. regulatory framework for cryptocurrencies. Any one of these drivers could decisively pivot price action in the days ahead.
Trump’s Tariff Squeeze on the European Union
The Trump administration has formally announced a 30% tariff on European imports, effective August 1, pending a last-minute trade deal. In parallel, Trump has proposed imposing a minimum tariff of 15 to 20% on all EU goods, arguing that “zero tariffs” are unacceptable and that access to the U.S. market must carry a cost.
These policies pose a direct threat to the EU trade balance and could quickly weigh on the euro and regional equity benchmarks. In the forex market, EUR/USD remains under pressure near key support as traders digest the tariff headlines.
Federal Reserve Under Trump’s Fire
In a sharp tirade, the U.S. president again blamed Jerome Powell for the housing slump and accused the entire Federal Reserve Board of blocking his removal. Trump now demands Powell’s ouster and an aggressive rate cut to 1 percent—an idea that clashes with market conditions and the current inflation path.
Political pressure aside, the odds of a cut at the next FOMC meeting remain very low. Yet the attacks have made traders more sceptical of policymakers, widening Treasury spreads, and adding volatility to the U.S. dollar.
Historic Crypto Legislation Passed | A New Chapter for Digital Markets
Following last week’s developments, one development dominates this Weekly Market Analysis: the formal passage of three landmark cryptocurrency bills in the U.S. Congress. Backed by bipartisan votes, the package delivers the first truly comprehensive legal framework for digital-asset activity, cementing America’s role as the world’s regulatory front-runner.
The three core acts are:
GENIUS Act – establishes a full-reserve, transparent, and directly supervised framework for stablecoins.
CLARITY Act – draws a clear supervisory line between the SEC and the CFTC, settling jurisdictional disputes over digital assets.
Anti-CBDC Act – bans the Federal Reserve from issuing a retail central-bank digital currency (CBDC) to safeguard citizens’ privacy.
Why this matters:
- Crypto firms now have a defined legal backbone, making it easier for institutional investors to commit capital with confidence.
- Fully backed, transparent stablecoins—such as USD1 or Amazon Coin—can be launched in short order, opening up new payment rails.
- Bitcoin and Ethereum, as decentralised assets, gain stronger legitimacy and legal protection, boosting long-term adoption.
Beyond America’s borders, the message is unmistakable: rather than fighting crypto, the U.S. intends to channel it through precise regulation. That policy pivot has been a pivotal driver behind Bitcoin’s surge toward its historic $124,000 area.
Euro Rate Decision Looms | A Pivotal Call for the ECB
The European Central Bank will convene its rate-setting meeting next week. While euro-area inflation has eased, economic growth is still fragile, leaving markets eager for guidance on the policy path ahead. The ECB’s decision could set the near-term tone for EUR/USD, especially if fresh tariff stress flares at the same time.
In such an environment, professional traders must track numbers in real-time and react quickly and logically to every scenario. The Trendo trading platform, equipped with instant analytics and lightning-fast execution, empowers you to base each move on solid economic realities amid the fluctuations.
Technical Market Analysis | Markets Poised for Key Level Breakouts
In the next segment of our Weekly Market Analysis, we shift our focus to the technical landscape of leading assets. After a low-volatility week, many trading symbols now hover on the edge of either a breakout or a firm consolidation at critical zones. From gold’s tight triangle formation to Bitcoin’s renewed attempt to cement itself above its all-time high, every chart points to a stage where a single price move could spark the next market phase. In this section, we will examine each asset separately and precisely, mapping their short- and medium-term technical outlooks based on the most recent price action.
Gold | Price Compressed in a Tight Triangle, Waiting for a Clean Breakout
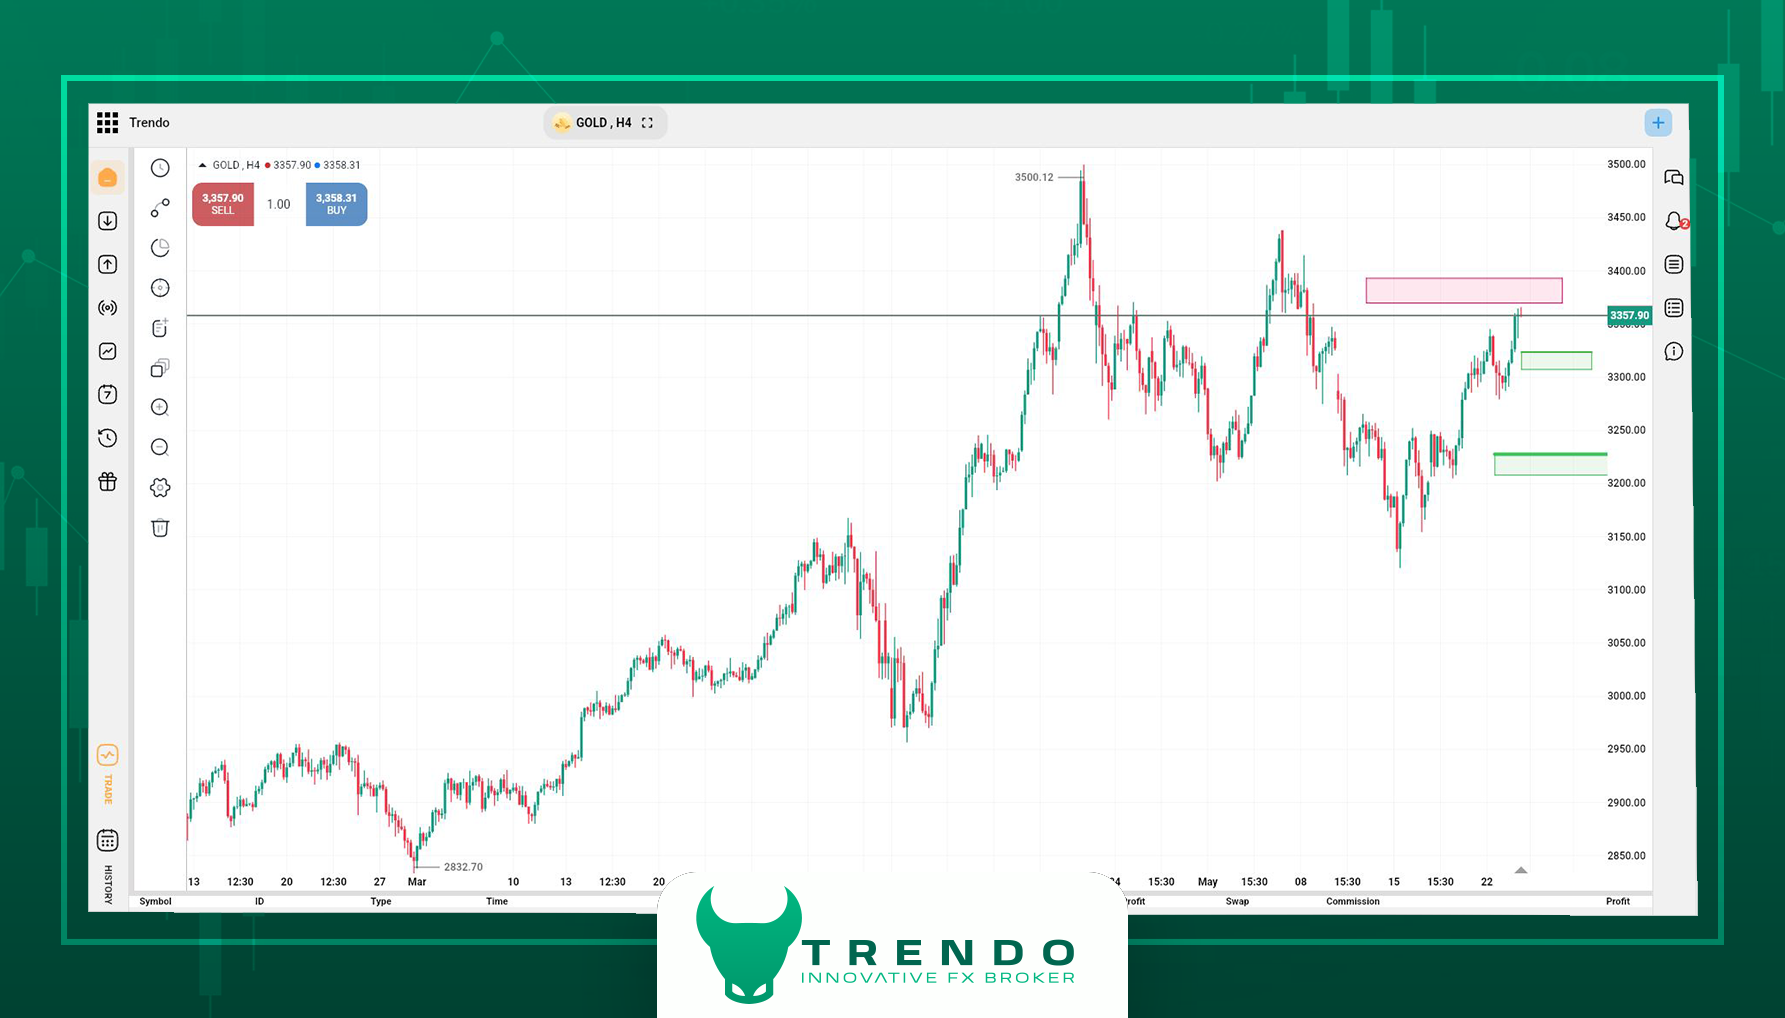
In this section of our Weekly Market Analysis, we investigate gold behavior, which remains firmly in traders’ sights. Over the past week, the metal has ranged within a narrow band between $3,310 and $3,377, and now trades near $3,350, midway through a symmetrical triangle consolidation.
The price action indicates that the market has coiled to a point where a technical breakout appears imminent. Whichever side wins could launch a powerful trend in the weeks ahead.
Key levels to watch are:
:Primary resistance is $3,410. A decisive break and hold above this high would open the path toward higher zones.
:Major support is in the range of $3,170 - $3,179. A sustained break below this floor could spark a deeper correction toward the $3,090 region.

Gold analysis at Trendo Broker
With global markets still grappling with tariff wars, monetary policy uncertainty, and sticky inflation, gold retains its traditional safe-haven appeal. Yet the next leg needs a fresh catalyst—either a new macro release or a clear break of the current triangle. In the days ahead, monitor price action and volume at the levels listed above; gold’s reaction there may reveal the market’s direction for the second half of July.
Bitcoin | Record High Reached; Is the Market Ready to Consolidate?
Continuing our Weekly Market Analysis, we turn to the week’s headline asset: Bitcoin. After a powerful rally that sliced through historic resistance, the coin reached $124,000, carving out a new all-time high on its chart. Since then, the market has shifted into consolidation, with prices oscillating near $118,000. This pattern of a sharp impulse followed by a gentle pull-back typically marks the onset of a decision phase.
At present, $114,000 is Bitcoin’s first support level. Should price revisit that shelf, the reaction there will likely steer the next leg; holding it is critical for any continued up-trend.
If 114,000 support fails, sellers could drive the market toward deeper supports at $107,000 and $102,000. These zones stand out as the following corrective objectives and carry significant psychological weight.
Because Bitcoin now trades in uncharted territory, setting precise upside targets requires a new price structure to develop, which can later be gauged using tools such as Fibonacci extensions. For the moment, the trading strategy should focus on price behavior at $114,000 and confirmation of continuation patterns on lower time frames. In parallel, the formal passage of U.S. crypto legislation, especially the GENIUS Act, has boosted institutional appetite and may help maintain bullish sentiment in cryptocurrencies.

Technical analysis of Bitcoin at Trendo
EUR/USD | Support Tagged, yet a Broken Trend-Line Clouds the Outlook
In this segment of the Weekly Market Analysis, EUR/USD price action has grabbed traders’ attention. After a mild pullback from 1.1850, the pair slid to the 1.1685 zone—its first flagged support from last week—and is currently oscillating around that level.
The key issue, however, is that the short-term rising trendline, which had acted as dynamic support for months, was breached in recent days. This break has raised doubts about the longevity of the prior uptrend.
There are two technical scenarios:
Bullish scenario: If the 1.1685 floor holds and price quickly reclaims the broken trendline, a rebound toward 1.1850—and potentially 1.2000—remains on the table. Positive fundamental catalysts would reinforce this path.
Bearish scenario: Continued selling that pushes EUR/USD below 1.1685 would expose the next key support near 1.1480.
Looking ahead, next week’s European Central Bank rate decision could be the decisive driver. Traders should monitor how the price reacts to current support levels and incoming policy headlines to gauge the pair’s direction.

Technical analysis of EUR/USD on Trendo Trading Platform
Ethereum | Sharp Rally and a Shot at Breaking the All-Time High
In recent months, Ethereum has delivered a strong run in the cryptocurrency market. Since late March, the price has surged from around $1,380 to levels near $3,700—an almost threefold advance—and is now on the verge of significant resistance.
From a technical perspective, ETH is approaching the $3,800 zone, its first significant resistance level. A clean break and hold above this mark would clear the runway toward $4,100—an area that forms a weekly double top and is viewed by many traders as prime liquidity hunt territory.
Should price vault $4,100, the market will likely target the next technical objective around $4,200. That scenario, however, demands a decisive breakout followed by firm acceptance above today’s barriers.
Conversely, failure to defeat current resistance could spark a limited pullback; still, solid support at the $3,550 and $3,300 areas should keep the broader bullish structure intact.
It is noteworthy that the formal passage of U.S. crypto legislation—especially the GENIUS Act, which governs fully backed stablecoins—has boosted institutional confidence and attracted new capital into the sector. This remains a tailwind for digital-asset valuations, particularly for robust smart-contract platforms such as ETH.

Technical analysis of ETH on the Trendo platform
Dow Jones | Brief Pullback, Yet the Bullish Outlook Still Stands
Over the past 13 trading sessions, the Dow Jones has entered a mild corrective phase and now stands at approximately 44,300 points. Despite this pause, the mid-term trend remains up, as the prior leg advanced with strong momentum.
If the retracement deepens, the 43,000 and 42,400 zones are poised to act as major support levels. How price reacts here will shape the index’s next move; holding these shelves could ignite a fresh upswing within the broader bullish structure.
On the weekly chart, the Dow hovers just below a double-top resistance around 45,000 points. A renewed push that breaks and holds above that resistance would likely carry the index toward the next technical target at 46,000 points—a level many traders view as a potential liquidity hunt above the prior high.
In summary, as long as the Dow Jones remains above the outlined supports, the upward structure remains valid, and the recent pullback may present a buy-the-dip opportunity for market makers and swing traders alike.

Dow Jones index analysis on the Trendo trading platform
Final Summary | Decision-Making at the Crossroads of Policy, Price, and Regulation
In this Weekly Market Analysis, we saw global markets at one of their most delicate junctions in recent memory. Washington’s plan for a sweeping 30% tariff on EU goods has dragged trade friction back into focus, knocking the euro and European stocks. At the same time, fierce political heat on the Federal Reserve—ignited by Donald Trump’s criticism of Chair Powell—has clouded the U.S. rate outlook and stirred Treasury volatility.
Alongside these macroeconomic headwinds, Congress has passed three landmark crypto bills—chiefly the GENIUS Act for fully reserved stablecoins—giving digital assets a clear legal runway and priming institutions for new allocations. Paired with the recent strength of Bitcoin and Ethereum, the legislation marks a new chapter in crypto adoption.
In this fragile yet opportunity-rich backdrop, speed and precision distinguish professionals. Instant data, powerful analytics, and lightning-fast execution help capture the edge. Log in to your Trendo trading platform now to command the market with on-chart trading, advanced indicators, and rapid order routing. For live analysis, trade alerts, and swift news, join the Trendo Telegram channel and track every wave like a true pro.
Forex Weekly Analysis - June 29, 2025
Global financial markets experienced a volatile and eventful week, one in which key U.S. economic data and developments in trade policy influenced the direction of many assets. The release of the U.S. Non-Farm Payrolls (NFP) report on Thursday, July 3, 2025, exceeded expectations, initially triggering a sharp rally in the U.S. dollar. However, traders quickly reversed this move, and the dollar’s gains were largely eroded by swift selling pressure.
Meanwhile, President Trump’s extension of the trade negotiation deadline to July 9 and the announcement of a tariff agreement with Vietnam boosted the sentiment in risky markets like stocks and cryptocurrencies. The overall market sentiment remains heavily influenced by interest rate expectations and the Federal Reserve’s future policy stance, especially in light of Trump’s recent sharp criticism of Fed Chair Jerome Powell, which has intensified political pressure on monetary policymakers.
In this weekly financial markets analysis by the Trendo Analytical team, we first examine the most important fundamental data and market reactions. We then proceed with a technical analysis of five key assets, including crude oil, the Dow Jones, EUR/USD, and Bitcoin, to explore potential scenarios for the upcoming week.
Fundamental Analysis | Reflection of Employment Data and Trade Policies in Market Movements
The focus of this week's financial markets analysis centers on market reactions to the NFP report, complementary economic indicators, and developments in U.S. trade policy—factors that have played a pivotal role in shaping the trajectories of major assets.
NFP Appeared Stronger than Expected
The US NFP report released on July 3 recorded an increase of 147,000 jobs, surpassing the forecast of 110,000. The unemployment rate fell to 4.1%, better than the consensus estimate of 4.3%. These figures initially signaled sustained strength in the U.S. labor market.
Contrary to expectations, the U.S. dollar, after an initial surge, faced rapid selling pressure and relinquished much of its gains. This reaction indicated that the market’s focus extends beyond positive headline numbers to a broader macroeconomic outlook and monetary policy trajectory. Many traders interpreted this as evidence of a structural capital outflow from the dollar, a trend that began in early 2025 and continues to unfold.
ADP Employment Data: A Warning Ahead of NFP
Prior to the official NFP release, the ADP employment report for June delivered a significant shock to the market, posting a decline of 33,000 against an anticipated increase of 95,000. This discrepancy raised traders doubts about the labor market’s health. Although the NFP report alleviated some concerns, the conflicting data cloud the economic outlook.
Trump’s Pressure on the Federal Reserve: A Political Narrative on Interest Rates
A key highlight this week was President Trump’s sharp comments on the social platform “Truth Social”, where he criticized Jerome Powell and the Federal Reserve board, stating: “Interest rates should be at 1%.” This statement renewed political pressure on the central bank, potentially influencing market expectations for an interest rate cut in the September meeting.
Currently, futures markets price about a 22% probability of a 50 basis point rate cut by year-end, up from lower probabilities in previous days.
Trade Agreement with Vietnam and Extension of Tariff Negotiation Deadline
In trade developments, Trump announced a new agreement with Vietnam granting tariff-free access for American goods to the Vietnamese market, countering Vietnam’s imposition of heavy tariffs ranging from 20% to 40% on imports and exports. Simultaneously, the deadline for other tariff negotiations was extended to Tuesday, July 9.
Markets generally viewed these developments positively, particularly in the risky assets such as U.S. stocks and cryptocurrencies, which have experienced relative growth. However, companies like Nike, with production ties to Vietnam, were negatively impacted by the agreement.
Oil, Interest Rates, and Strategic Reserves
In energy markets, Trump’s remark that “strategic oil reserves will only be replenished when prices are appropriate” signaled a reluctance by the government to purchase at current price levels. Crude oil remained around $67 per barrel, trading within a tight range that will be further analyzed below.
In summarizing this section of the weekly financial markets analysis, the market is currently influenced by a complex interplay of relatively strong economic data, political pressures, trade tensions, and dollar outflows. Under such conditions, a scenario-based approach that integrates both fundamental and technical factors is essential for informed trading decisions.
Also, note that on the Trendo trading platform, you can monitor important economic data alongside technical analyses and make your trades accordingly.
Forex Economic Calendar on the Trendo Trading Platform
Technical Analysis of Financial Markets | Asset Behavior Review Over the Past Week
We now turn to the technical analysis of four key assets that reached critical price levels last week. Their reactions to recent fundamental developments will significantly shape market expectations going forward. Price behavior in oil, the Dow Jones, EUR/USD, and Bitcoin has arrived at junctures where either a breakout or consolidation will determine the mid-term market direction. By examining chart structures, support and resistance levels, and trend strength, this section aims to provide a technical analysis of financial markets to equip traders with actionable scenarios for the week ahead.
Crude Oil | Is the Consolidation Phase Coming to an End?
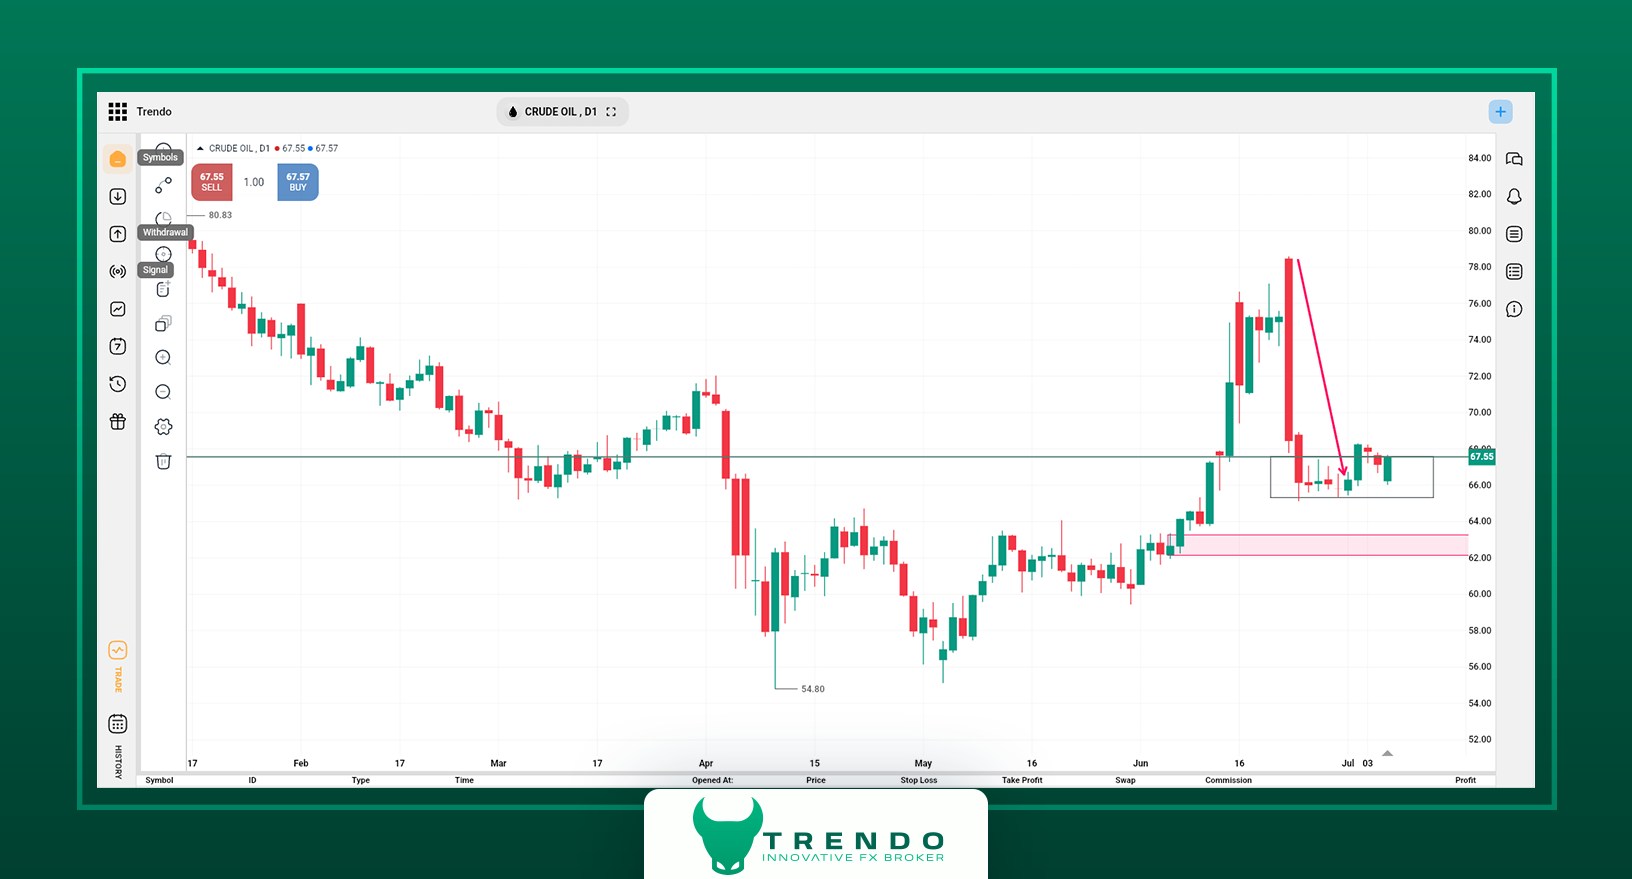
Crude oil remains confined within a narrow and sensitive trading range, currently hovering near $67 per barrel. The price failed to break out last week, indicating that the consolidation phase is nearing its conclusion, as depicted on the Trendo platform chart. In technical analysis, prolonged price compression often precedes a strong breakout, either upward or downward.
In the bullish scenario, breaking through the $70 level and stabilizing above it could pave the way toward key resistance levels at $78 and $82. Conversely, breaking the $62 support would signal a bearish phase, with subsequent targets at $55 and $50.
Given Trump’s recent stance that strategic reserves will only be replenished at “appropriate prices,” active political support at current levels appears limited. Therefore, the next price direction will heavily depend on market sentiment and investor behavior near this range.
Weekly Oil Analysis on the Trendo Trading Platform
Dow Jones | Resistance Break and Consolidation Signal Bullish Momentum
The Dow Jones extended its recent uptrend by breaking through the critical resistance at 44,400 points and currently trades around 44,750. This move reflects increased buying interest and a strengthening bullish structure in the U.S. stocks market.
Notably, the index cleared resistance without significant pullback and managed to hold above this level, enhancing the likelihood of further gains. If buying pressure persists, the next target lies near 46,500, a recognized mid-term resistance.
In a corrective scenario, the former resistance at 44,400 now acts as dynamic support. A breach here could trigger a temporary pullback toward 43,000 and then 42,350. However, as long as prices remain above these levels, the mid-term uptrend remains intact.
Following optimism from the extended trade talks and stronger-than-expected economic data, many traders view any short-term corrections as buying opportunities.You can see the Dow Jones chart on the Trendo trading platform along with analysis below.
Technical analysis of Dow Jones index on Trendo platform
EUR/USD | Negative Reaction to 1.1850 Key Resistance
After several weeks of consecutive gains, the EUR/USD pair encountered significant selling pressure at the important resistance level of 1.1850 last week. The price retreated to 1.1732, indicating the start of a short-term correction within a broader medium-term uptrend.
EUR/USD remains a key symbol for assessing safe-haven demand and dollar strength. The negative reaction at 1.1850 suggests short-term overbought conditions, especially considering the dollar’s relative strength following the NFP release.
If the correction continues, the first support lies at 1.1573. A break below this level would open the way to stronger support around 1.1480, which coincides with an ascending daily trendline that has repeatedly prevented deeper declines in recent months.
Conversely, a renewed break and hold above 1.1850 could lead to further gains toward 1.1950 and then 1.2000.
The current behavior of EUR/USD reflects the multifaceted market environment, where technical strength in the uptrend coexists with fundamental factors such as monetary policy and capital flows influencing short-term movements. If you are a trader of this popular currency pair, you can trade it with zero spread on the exclusive Trendo trading platform.
Technical analysis of EUR/USD on Trendo
Bitcoin | Fluctuations at Resistance: Genuine Breakout or Price Trap?
Bitcoin recently managed to break above the significant resistance at $109,000 and the medium-term descending trendline but quickly fell back below these levels. This ambiguous behavior raises a critical question among traders: is this a genuine breakout or a classic false breakout (stop-hunt)?
recently managed to break above the significant resistance at $109,000 and the medium-term descending trendline but quickly fell back below these levels. This ambiguous behavior raises a critical question among traders: is this a genuine breakout or a classic false breakout (stop-hunt)?
Currently, Bitcoin trades again near $109,000, a crucial crossroads. Therefore, this part of the weekly financial markets analysis holds special importance for crypto market participants.
If Bitcoin can firmly hold above $109,000, the next targets are $112,000 and then $119,000. However, sustained selling pressure and confirming bearish daily candles could lead to a correction toward $102,000 support level. A break below this support would open the path toward $90,000.
The key point in this situation is the trade volume and candlestick patterns on the daily timeframe, which will clarify whether the recent pullback is a natural retracement or a signal of further correction.
Given the increased risk appetite in global markets following the tariff negotiation extension and the dollar’s relative weakness, bullish sentiment in cryptocurrencies remains alive. Nevertheless, caution in new entries is warranted until $109,000 is decisively broken and held.
Bitcoin analysis on Trendo broker
Final Summary | Decision-Making at the Intersection of Data and Opportunity
This weekly financial markets analysis demonstrated how U.S. employment data, President Trump’s positions, and trade developments have shaped key assets trajectory at critical technical levels. The market’s contradictory reaction to the NFP report, Bitcoin’s volatility, and the Dow Jones’ consolidation above resistance all underscore the complexity of the current environment. In such conditions, a thorough understanding of economic data combined with technical analysis is the key to devising successful trading strategies.
For those seeking precise, fast, and professional tools to seize market opportunities, the Trendo trading platform offers everything in one place: live asset charts, direct on-chart trading capabilities, and a real-time economic calendar to help you analyze and execute trades immediately. To access more up-to-date analyses, be sure to join the Trendo Telegram channel and follow us for targeted and professional financial market coverage.
Forex Weekly Analysis - June 29, 2025
Global financial markets experienced varied volatility over the past week, influenced by a combination of conflicting economic data and an uncertain monetary policy environment. Although the initially announced ceasefire between Iran and Israel attracted market attention, its impact diminished over time due to the absence of further developments, shifting the primary focus back to key U.S. economic data. In this context, all eyes are now on the upcoming U.S. Non-Farm Payrolls (NFP) report for June, scheduled for release on Thursday, July 3rd, at 12:30 GMT, which has the potential to significantly influence the short-term direction of many asset classes.
In this weekly financial markets analysis by the Trendo analytical team, we first review the most important fundamental drivers of last week, followed by a technical outlook on the trajectories of assets such as gold, oil, the Dow Jones, EUR/USD, and Bitcoin.
Fundamental Analysis | Review of Last Week’s Key Drivers
Geopolitical developments, particularly the ceasefire between Iran and Israel, primarily influenced financial markets last week. This situation led to a muted reaction to U.S. economic data compared to usual. With partial tensions easing and relative political stability restored, market attention has refocused on critical U.S. economic data. The highlight of this week is the release of the U.S. Non-Farm Payrolls report on Thursday, July 3rd, which could play a decisive role in shaping Federal Reserve interest rate policy and market direction. In the following, we examine recent impactful economic data and upcoming expectations.
U.S. Employment Data | Key Driver in Weekly Financial Markets Analysis
The forthcoming U.S. Non-Farm Payrolls report is the most significant economic event on the current trading calendar. Forecasts estimate an increase of approximately 120,000 jobs in June, down from 139,000 in May. Recent trends suggest a gradual weakening in the U.S. labor market, though not yet at a critical level.
If the actual figure exceeds expectations (e.g., above 140,000), it is likely to strengthen the U.S. dollar and trigger a short-term correction in the stock market, as investors would perceive a reduced likelihood of Federal Reserve rate cuts. Conversely, if the number falls below 100,000 or significantly underperforms forecasts, the market may interpret this as economic weakness, potentially leading to adecline in the dollar, a rise in gold prices , and increased volatility in stock indices. Given the market’s focus on monetary policy, this data release could set the primary trading direction for the week.
Iran-Israel Ceasefire
The ceasefire announcement between Iran and Israel, while seemingly easing regional tensions, remains fragile and conditional. This ceasefire came in response to U.S. strikes on Iranian nuclear facilities and a controlled response by Tehran. This development led to declines in oil and gold prices, while supporting risky assets such as stocks and Bitcoin. Nonetheless, markets remain cautious about this agreement, and any new events could rapidly alter trading dynamics.
U.S. Economic Data
The final U.S. Gross Domestic Product (GDP) growth figure for the first quarter of the year (Q1) was revised downward to -0.5%, weaker than anticipated. However, the release of exceptionally strong durable goods orders (+16.4%) and a decrease in initial unemployment claims indicate that the U.S. economy has not fully entered a recession. These conflicting data points create an ambiguous picture of economic growth and demand, complicating monetary policy decisions. You can monitor all key economic releases in real time using the Trendo trading platform.
Monetary Policy of the Federal Reserve
Recent remarks by Jerome Powell, Chair of the Federal Reserve, signaled a continued cautious approach to monetary policy. He emphasized that the Fed requires more data to assess the future path of interest rates and that it is premature to make definitive statements regarding the timing of rate cuts. Nevertheless, markets still anticipate approximately a 60 basis point reduction by the end of the year, with the direction of monetary policy in the coming months heavily dependent on employment and inflation data.
Trade Policy and Tariffs
Ahead of the July 9th deadline, the United States has not yet changed the 10% tariffs imposed on certain goods. Negotiations with countries including India, China, and Vietnam are ongoing, but no formal agreements have been reached so far. The agreement between the U.S. and China on rare earth exports is largely symbolic rather than operational. Markets have priced in these developments only to a limited extent, unless an unexpected event occurs.
Fundamental Summary
In this weekly financial markets analysis, the market’s primary focus has shifted from geopolitical developments back to economic data. Ahead of the critical U.S. NFP report release scheduled for Thursday, July 3, traders are seeking clues to evaluate the Federal Reserve’s interest rate trajectory. Given the relative weakness in economic growth alongside labor market resilience, the market is at a sensitive juncture where any unexpected data could significantly alter price directions in gold, the dollar, indices, and cryptocurrencies. In such an environment, closely monitoring economic data and adopting scenario-based decision-making will be key to successful trading this week.
Technical Analysis of Financial Markets | Review of Key Asset Trends
Global financial markets experienced notable volatility last week, with many assets approaching critical technical levels. Price action in gold, oil, the Dow Jones Index, EUR/USD, and Bitcoin has reached zones where either a breakout or a reversal could define the medium-term market direction. In this section of the weekly financial markets analysis, we review price structures and key levels to outline potential scenarios for these major assets.
Gold | Persistent Downward Pressure Near a Key Trendline
As visible on the Trendo trading platform chart, gold has exhibited a clear downtrend over the past 10 trading days, falling from around $3450 to near $3270. The weekly candle closed with a bearish body, confirming medium-term bearish sentiment. On the daily timeframe, the price is approaching a reliable upward trendline that has acted as key support multiple times over the last six months and remains unbroken. Gold currently stands at a critical juncture: a break below this structural support could trigger a deeper correction.
If the daily trendline is breached and the price settles below the $3230 level, a further decline toward $3160 is likely. Conversely, if the market bottoms out in this area and rebounds, the first major resistance to watch will be at $3420. Surpassing this zone could reinitiate an uptrend, paving the way back to the previous high near $3450 and beyond.
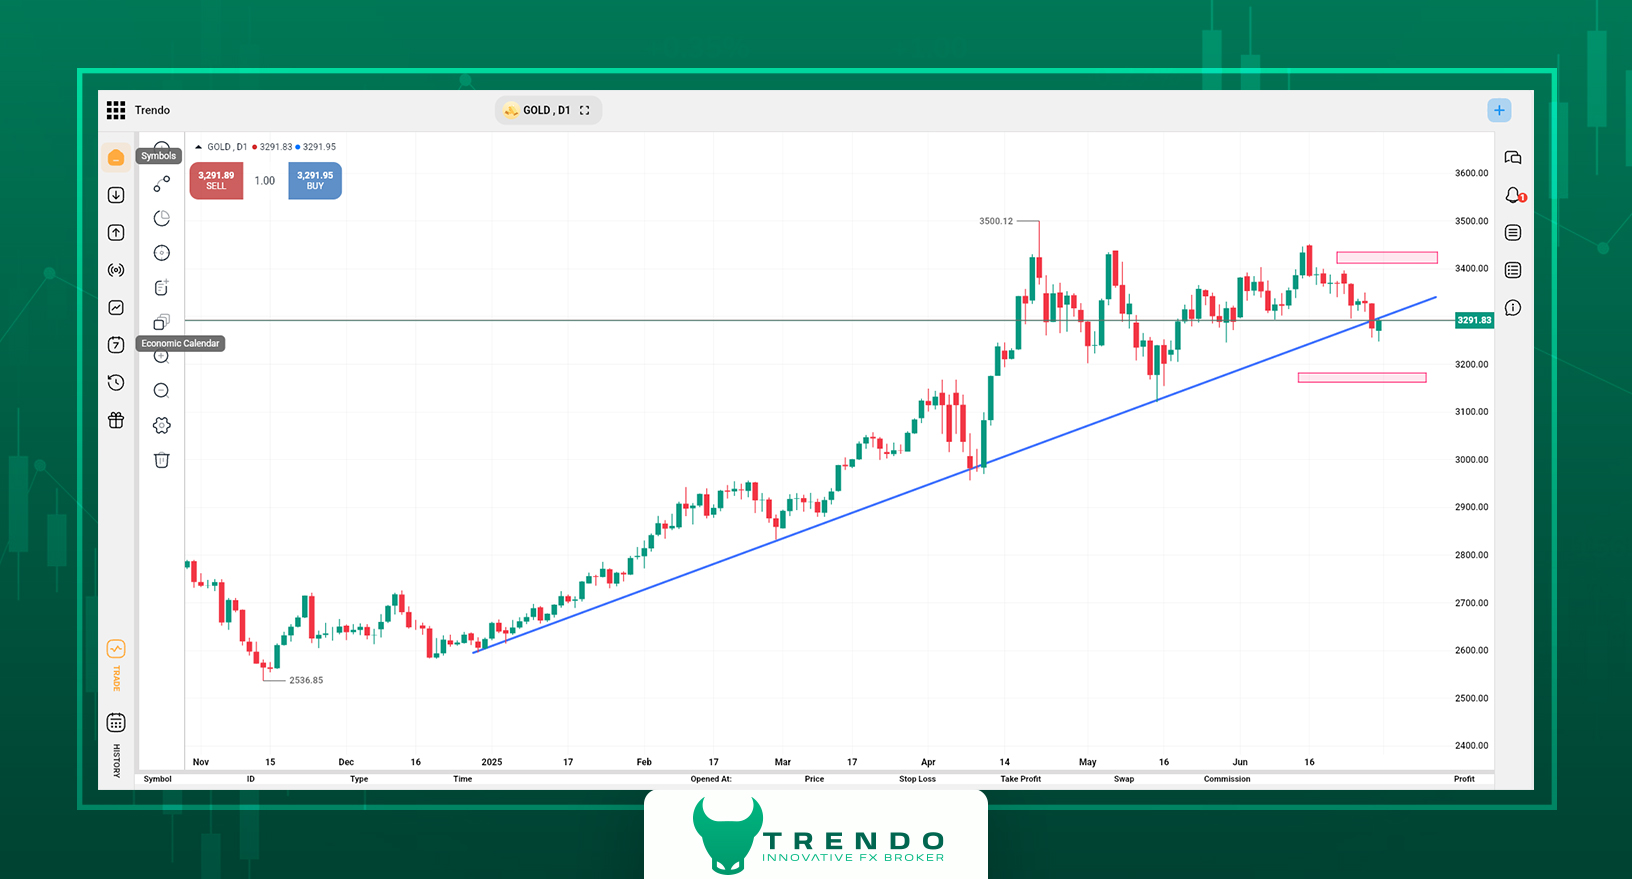
Gold analysis on the Trendo trading platform
Crude Oil | Price Consolidation at Support Zone After Sharp Decline
Following a breakdown of its upward structure in the $78 range, crude oil faced significant selling pressure, dropping to around $66. Prices are currently fluctuating within this region, with several consecutive Doji candles indicating market indecision and a lack of dominant buying or selling forces. From a technical perspective, the $62 level serves as the primary mid-term support and is the key threshold for future market reactions.
In a bearish scenario, breaking the $62 support level could lead to a further decline toward lower levels such as $55 and $50, which previously acted as market lows before political tensions intensified. However, if prices hold this level and demand strengthens enough to push above $70, the next resistance zone lies between $78 and $82. Crossing this area could weaken the current downward structure and could mark the beginning of a mid-term recovery phase.
Note: U.S. President Donald Trump has explicitly stated several times in his speeches about his intention to lower global oil prices, which may signal further downward pressure on oil prices in the coming months.
You can visually check the above analysis on the oil chart viewed on the Trendo trading platform (picture below).
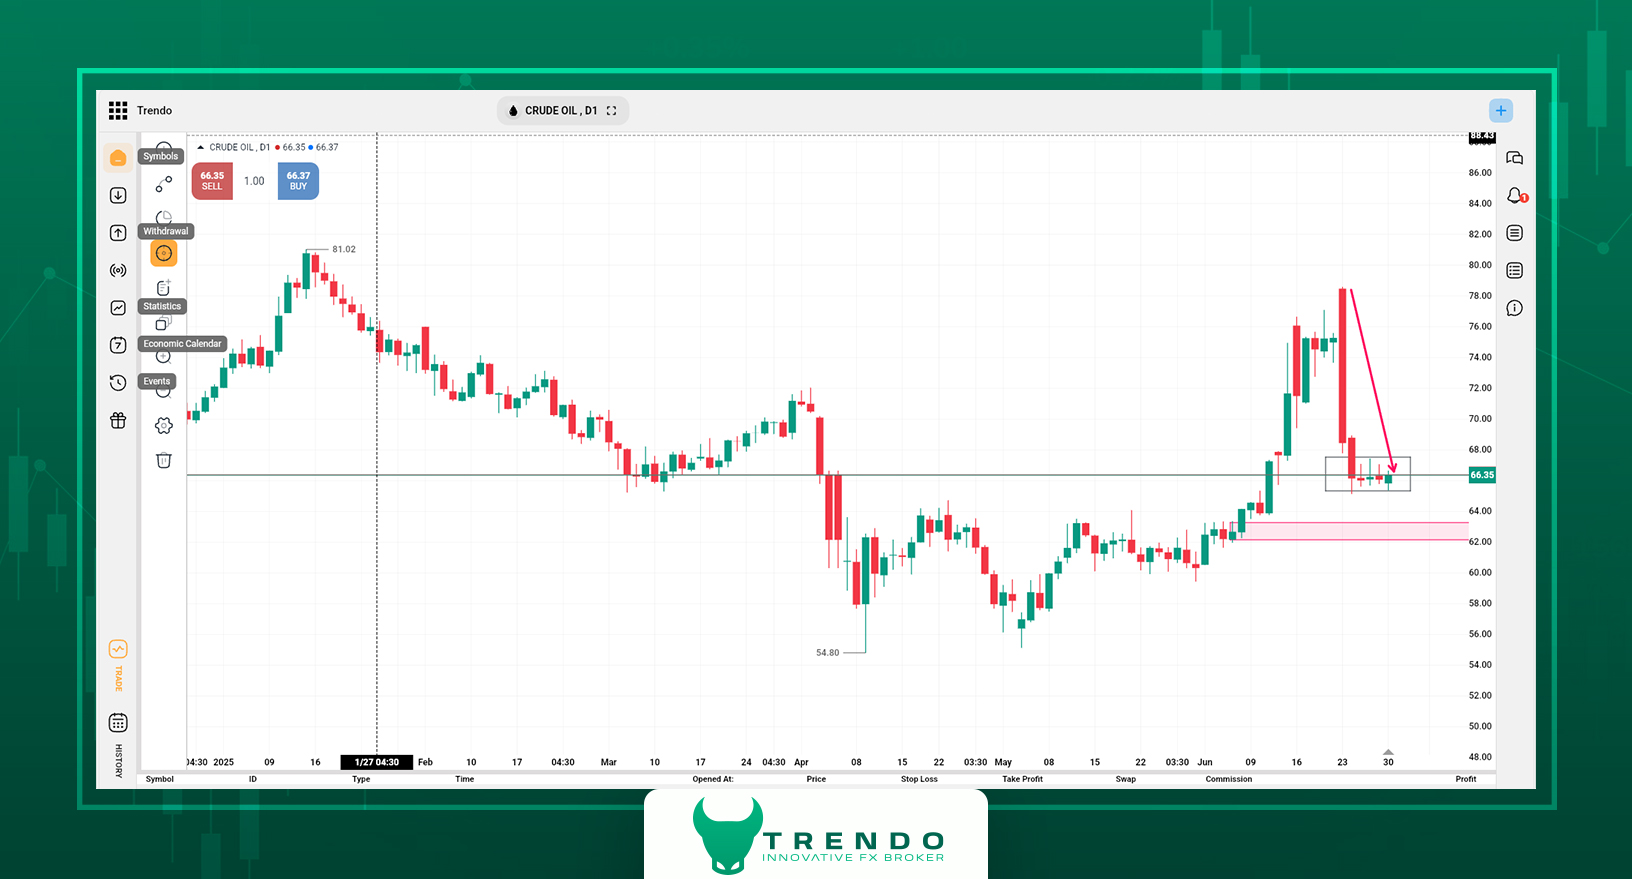
Crude Oil analysis on Trendo
Dow Jones | Strengthening Uptrend Approaching Weekly Resistance
As shown on the price chart from the Trendo platform, the Dow Jones index experienced a steady uptrend last week, advancing from the 41,800 range to around 44,000. The daily candle structure indicates that after successful bottoming, the market has moved with buying pressure toward a significant resistance level. Currently, the Dow Jones is approaching the key 44,400 level, recognized as a strong weekly resistance that historically has triggered supply and price reversals.
A decisive breakout and price stabilization above 44,400 could pave the way for further growth toward the 46,500 range. However, in a corrective scenario, the first major support lies at 43,000, with 42,350 serving as a secondary support zone to prevent deeper declines. As long as prices remain above these supports, the mid-term structure of the Dow Jones remains bullish.
Dow Jones Index analysis on Trendo broker
EUR/USD | Momentum Slowing Near Key Resistance
The EUR/USD pair rose from 1.1450 to a high of 1.1754 last week, recording six consecutive bullish candles. This initial strong upward momentum showed signs of weakening toward the end of the week, as buyer strength diminished. The price has now reached a zone where renewed selling pressure may cause a pullback. However, a credible daily upward trendline, tested three times so far, could provide support during future corrections.
If buying pressure persists and breaks the current resistance, the pair may target 1.1850 and then the psychological 1.2000 level. The first support is at 1.1573, and if broken, the 1.1480 area—aligned with the daily trendline—could trigger a stronger reaction from buyers. If you are a EUR/USD trader, you can trade this popular pair with zero spread on the Trendo trading platform under professional conditions.
EUR/USD technical analysis on Trendo
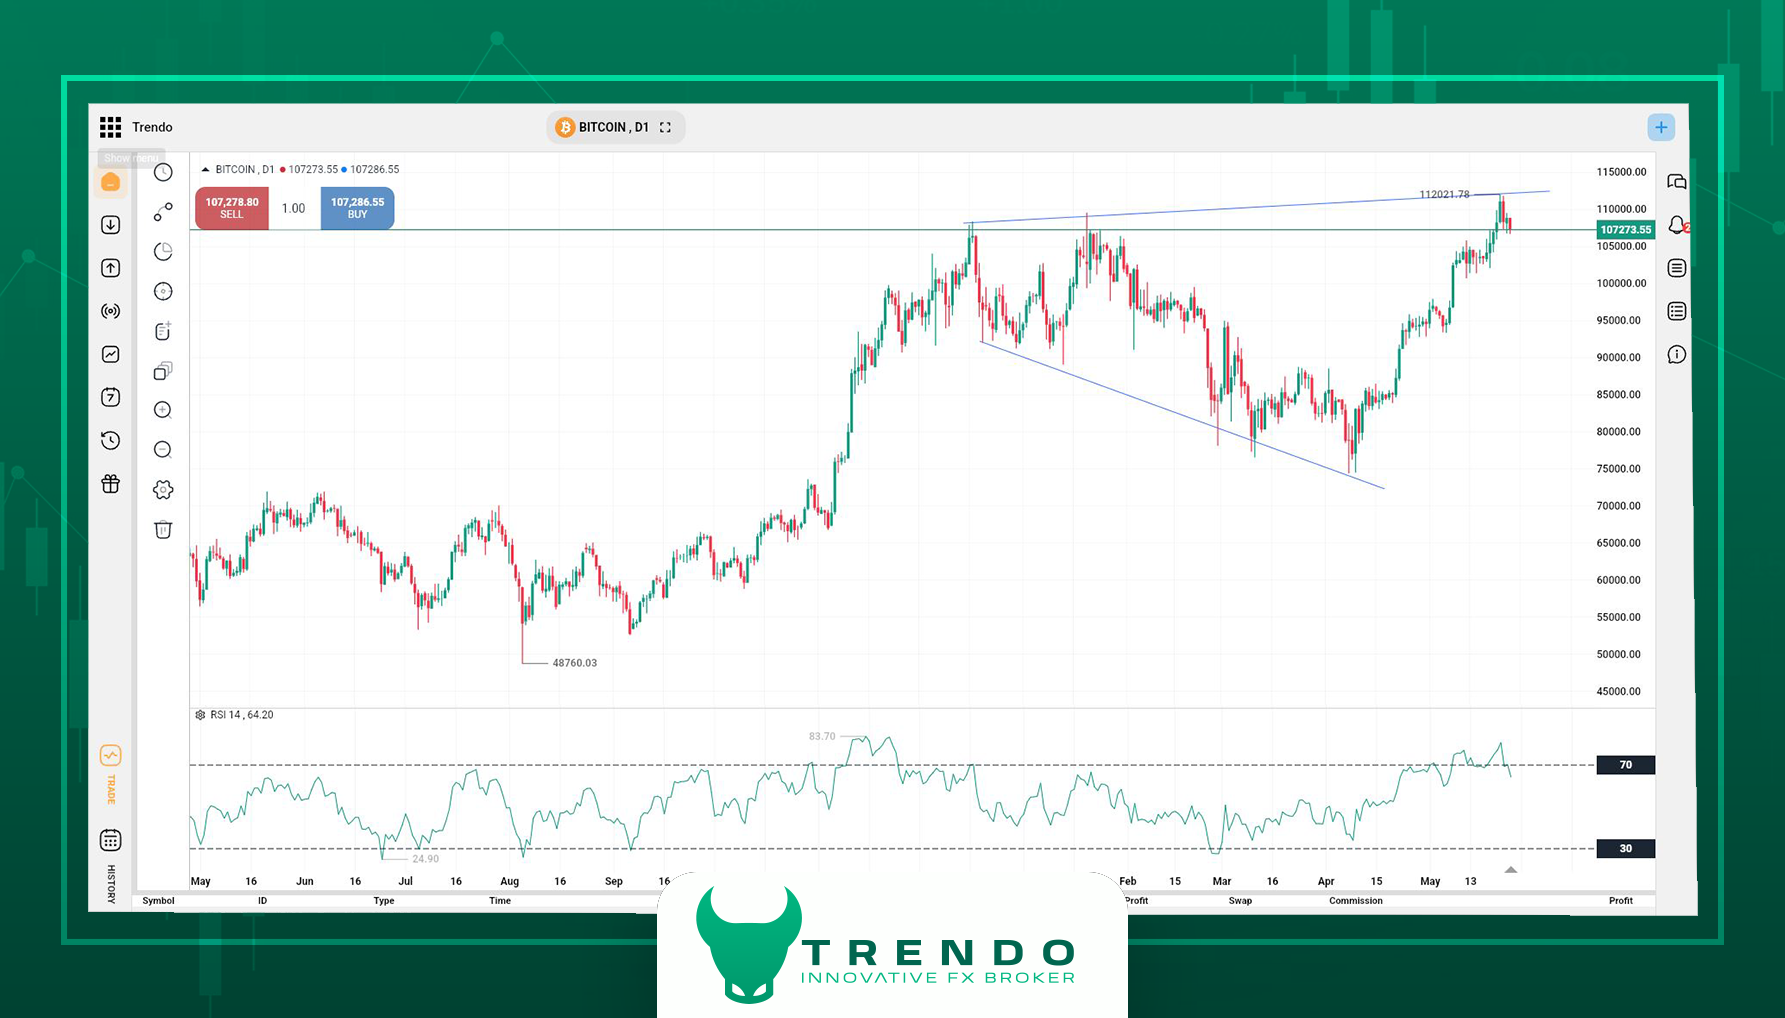
Bitcoin | Approaching Trend Resistance After Strong Rebound
Bitcoin has rallied powerfully in recent days, recovering from its recent low near $102,000 to the current level around $108,000. This surge, accompanied by strong daily candles, signals renewed buyer interest and an attempt to exit the correction phase. Bitcoin is now nearing a mid-term descending trendline, where the third touch could occur near $109,000—a key technical resistance for the current structure.
A decisive break above this resistance would open the path toward the first target at $112,000, with potential to extend gains to $119,000 if prices stabilize above that level. Failure to break $109,000, especially if confirmed by bearish divergence or reversal candles, would signal a continuation of the corrective trend downward, with initial support at $102,000. A break below this support could deepen the correction toward $90,000 or lower. You can view the Bitcoin chart analysis in the image below from the Trendo trading platform.
Bitcoin analysis on the Trendo trading platform
Summary
Last week, the overall atmosphere of the financial markets was dominated by news regarding the Iran-Israel ceasefire and regional political developments, leading traders to react primarily to real-time news and geopolitical events. However, this week presents a markedly different scenario. The market’s main focus has shifted to key economic data, especially the U.S. Non-Farm Payrolls (NFP) report scheduled for Thursday, July 3. This report could play a decisive role in shaping Federal Reserve monetary policy and movements of markets in the coming weeks.
Important Note: Jerome Powell will deliver a significant speech tomorrow, Tuesday, July 1, at 13:30 GMT. Although details remain undisclosed, any comments regarding interest rates or related topics are expected to cause market volatility. For up-to-date and professional market analyses, follow the Trendo broker’s Telegram channel.
Forex Weekly Analysis - June 8, 2025
In this weekly Forex analysis from Trendo Broker, the most significant developments of the past week and the outlook for the coming days are reviewed to help traders prepare for market volatility. The week began with a media confrontation between Donald Trump and Elon Musk, which had a considerable impact on financial markets. Following this event, Tesla shares plummeted by more than 15%, erasing nearly $150 billion from the company’s market capitalization. The crypto market was not spared from this media frenzy; Bitcoin’s price retreated below $102,000, heightening investor concerns.
On another front, a drone attack on Russian oil facilities, coupled with a cautious decision by OPEC+ to modestly increase oil production, led to a jump of over 3% in Brent crude prices. Additionally, the European Central Bank (ECB), in a predictable move, cut its deposit rate for the first time since 2022, lowering it to 2%. The release of the U.S. employment report, which showed a significant rise in wages, postponed expectations for a Federal Reserve rate cut. These events altered the trading trajectory of the EUR/USD pair, stock indices, and gold. In this report, which is part of the “Weekly Trendo Analysis” series, we take a closer look at the key events in the days ahead, including the release of U.S. inflation data and the crucial Federal Reserve meeting. Stay with us to remain informed about the latest market status and trading outlooks.
Weekly Fundamental Analysis | Key Economic Events of the Week
In the fundamental analysis section of this weekly Forex analysis, the economic and political events of the past week have been reviewed. Central bank policy changes, key economic reports, and geopolitical developments are among the factors shaping market direction. By analyzing the details and implications of each event, we aim to help traders gain a clearer perspective on future market trends.
Central Banks and Monetary Policies
The ECB's decision on June 5 to cut the deposit rate to 2 % was one of the most significant events of the week. Although this 25-basis-point reduction was expected, Christine Lagarde’s remarks obscured the future path:
“We will make decisions step by step and are fully prepared for future developments.”
This cautious stance caused the euro to initially fall to 1.05 and then rebound to 1.06. Yields on German and French bonds also dropped by 8 basis points, flattening the European yield curve.
U.S. Employment Report and Delayed Fed Rate Cut
The release of the U.S. May employment report surprised traders. Non-Farm payrolls increased by 139,000, exceeding expectations, but the market focused on the 0.4% wage growth. Brian Jacobsen, Chief Economist at Annex Wealth, considered this report as negating the possibility of a Fed rate cut:
“There is no particular deterioration, and for now, there will be no rate cut.”
Following this report, the dollar strengthened and the yield on the 10-year U.S. Treasury rose to around 4.5%.
Uncertainty in Bank of Canada Policy
The Bank of Canada kept the interest rate unchanged at 2.75%. However, Governor Tiff Macklem highlighted the risks posed by trade tensions with the United States:
“Trade tensions are the biggest obstacle to economic growth; if they intensify, we will cut rates.”
Currently, traders see more than an 85% chance of a rate cut at the Bank of Canada’s next meeting.
Inflation and Global Economic Growth
The Eurozone’s Harmonized Index of Consumer Prices (HICP) for May was reported at 1.9%, below the ECB’s 2% target, paving the way for further rate cuts and increasing downward pressure on the euro.
Ongoing Weakness in China and Australia’s Economies
In China, the Caixin Services PMI for May was 51.1, showing slight improvement from the previous month. However, with the composite index still below the neutral 50 mark, Wang Zhe, Chief Economist at Caixin Insight, warned:
“China’s economy remains under pressure from external factors and urgently needs a significant boost in domestic demand.”
Meanwhile, in Australia, Q1 GDP grew by only 0.2%, causing a 0.6% drop in AUD/USD.
Energy Markets and Geopolitical Tensions
A drone attack on Russian oil facilities and a cautious decision by OPEC+ to increase oil production by just 411,000 barrels per day, pushed Brent crude up over 3%, nearing $85. This strengthened energy indices in the stock market and heightened inflation concerns.
U.S. and Canadian Labor Markets
The U.S. May employment report indicated continued labor market resilience. Although the number of new jobs (139,000) was lower than the previous month, the 0.4% wage increase caught traders’ attention, prompting a reassessment of interest rate expectations and steepening the U.S. bond yield curve.
Canada’s labor market underperformed last week, with the unemployment rate rising to 7%. This situation increased the likelihood of a Bank of Canada rate cut and weakened the Canadian dollar.
Political Tensions and Risky Markets’ Reaction
One of the week’s most prominent events was the Twitter clash between Donald Trump and Elon Musk. Trump accused Musk of being “untrustworthy,” to which Musk responded. This media conflict quickly spilled over into the markets.
Following this, Tesla shares fell more than 14% in two days, wiping out about $150 billion in market value. The crypto market was also affected, with Bitcoin dropping below $102,000 and even reaching $101,650. This demonstrated that political tensions, especially ahead of the U.S. elections, can exert significant pressure on riskier markets.
Weekly Technical Analysis | In-Depth Review of Key Market Symbols
In this section of> weekly Forex analysis
Technical Analysis of Gold (XAU/USD)
Continuing this weekly Forex analysis, we review the technical status of gold. Last week, the price of this precious metal exhibited no significant fluctuations and oscillated between $3,200 and $3,400 levels, with the latest trades around $3,300.
Daily Timeframe Outlook
On the daily chart, an upward trendline is clearly visible, having been touched four times by price so far. These repeated touches indicate significant liquidity below this trendline (in the $3,220–$3,250 range). If this trendline is broken, the price may fall to the key support at $3,050. However, news related to a possible renewed Russian attack on Ukraine could completely alter this scenario; heightened geopolitical tensions could prevent any decline in gold prices.
Weekly Candlestick Review
On the weekly chart, the last closed candlestick formed an inverted hammer pattern. Notably, the upper shadow of this candlestick precisely touched the strong resistance at $3,400. This pattern warns traders that if political concerns ease, a downward price correction is possible.
Short-Term Status in the Hourly Timeframe
On the hourly chart, gold has recently adopted a downward trend. However, this decline slowed noticeably at the end of the week, with price stabilizing at the key support of $3,312. The formation of several consecutive Doji candles in this zone indicates the uncertainty of the market and the potential for a short-term upward reversal. If the market opens on Monday with strong bullish candles, the likelihood of a short-term price rebound increases.
Weekly analysis of global gold price at Trendo
Technical Analysis of Bitcoin (BTC/USD)
In this part of the weekly Forex analysis, we examine the technical aspects of Bitcoin. Last week, Bitcoin’s price was sharply affected by the media conflict between Trump and Musk, dropping to around $100,500—a move resembling a clear “stop-hunt” targeting the day’s lowest price. However, the price quickly rebounded with a strong candle and is now consolidating around $105,550.
Corrective Structure and Potential Continuation of the Uptrend
A detailed price action review shows that the corrective structure from the recent high ($112,000) forms a clear triple-bottom pattern. This pattern, along with the gradual decrease in the momentum of the recent decline, underscores the corrective nature of the drop. Thus, a full trend reversal and deep price fall are currently unlikely, though limited corrections within the main trend are possible.
Key Price Levels for the Coming Days
For upcoming trades, a significant resistance zone lies between $107,800 and $109,000. It’s predicted that a strong break above this resistance would set Bitcoin on course to retest the previous high ($112,000). Conversely, if political and geopolitical tensions escalate, selling pressure could increase, pushing the price down to the daily support zone of $96,399–$97,800.
Traders should closely monitor political developments and war-related news in the coming week, as any escalation could put further pressure on Bitcoin and other risky assets.
Bitcoin analysis in Trendo Trading Platform
Technical Analysis of EUR/USD
In this section of the weekly Forex analysis, we review the EUR/USD pair, which has experienced a slow upward trend over the past 15 days. A comprehensive look at the chart presents two clear technical scenarios for traders.
First Scenario: QM Pattern and Potential Decline
Currently, the daily chart shows a well-formed QM (Quasimodo) pattern. If a confirming bearish candle appears in this area, the likelihood of a price drop from the current level increases significantly. In this case, traders should expect the price to move toward lower support levels.
Scenario Two: Diamond Pattern and Continued Uptrend
Alternatively, due to the sharp uptrend of the past two months, the QM pattern may be invalidated, with the price moving toward forming a classic “diamond” pattern. Traders should remain vigilant to this possibility as well.
Four-Hour Timeframe and Negative Divergence Warning
On the four-hour chart, a clear negative divergence is visible, indicating a slowdown in the upward momentum. This divergence warns traders to manage their trades with greater caution.
Key Support and Resistance Levels for the Coming Days
If the trend turns bearish, the first reliable support area on lower timeframes is between 1.12700 and 1.12800. Conversely, if the price rises, a key resistance in the four-hour timeframe lies at 1.18143.
Therefore, traders should consider both scenarios in the coming week and closely monitor price reactions at these key levels.
EUR/USD analysis at Trendo broker
Trendo Weekly Forex Analysis Summary
Last week, financial markets were influenced by high-impact events, from the media conflict between Trump, President of the United States, and Elon Musk, the world's richest individual, to the ECB’s significant rate cut decision. The sharp drop in Bitcoin and the more than 14% decline in Tesla shares demonstrated that, under current conditions, traders must be more vigilant regarding political and economic developments. Additionally, the release of the U.S. employment report and the OPEC+ decision in the energy sector have further complicated the market’s outlook.
Based on the analyses provided in this weekly Forex analysis by Trendo Broker, traders should closely follow upcoming news, including U.S. inflation data and the Federal Reserve meeting. For better and more precise decision-making, traders can utilize the advanced features of the Trendo trading platform. This platform provides real-time economic data and important news, along with up-to-date price charts. Furthermore, its powerful analytical tools allow for direct trade execution and management on the charts.
Forex Weekly Analysis - June 1, 2025
In the upcoming week, global financial markets will be influenced by key economic data releases and significant central bank decisions. This weekly analysis by Trendo Broker analytical team focuses on the U.S. Non-Farm Payrolls (NFP) report and central bank decisions, examining the forex market and trends in major currencies such as the U.S. dollar, euro, and Canadian dollar. Moreover, it presents a thorough technical and fundamental analysis of gold (XAU/USD), providing a comprehensive outlook on trading opportunities for this precious metal. Join us for the detailed insights.
Dollar Volatility and Cautious Market Optimism | Focus on NFP and Federal Reserve Decisions
Ahead of the NFP report scheduled for Friday, June 6, the dollar experienced a turbulent week but remains on a weekly upward trend. Initially, President Trump’s threat to impose heavy tariffs on imports from the European Union initially unsettled the markets; however, postponing this decision until June 9 and progress in trade negotiations with Europe and the UK have increased the likelihood of an agreement. Nonetheless, uncertainties surrounding these tariffs continue to complicate financial market sentiment. Markets are cautiously optimistic about trade agreements, which has alleviated concerns regarding the possibility of an economic recession. Analysts predict the Federal Reserve will cut interest rates twice by the end of 2025.
Next week, investors’ attention will turn to important economic indicators, including the PMI index for manufacturing and services, and especially the NFP report on Friday. Should this report exceed expectations and wage growth surpass 3%, expectations for rate cuts may be tempered, strengthening the dollar. Additionally, statements from Federal Reserve members in the coming days will significantly influence trader expectations. To stay informed about the precise timings of these events, you can utilize the Trendo forex economic calendar and follow Trendo on Telegram for the latest analyses and news.
Trendo forex economic calenda
Euro Awaits ECB Decision | Rate Cut and Lagarde’s Signals in Focus
In the coming week, markets will not only monitor U.S. economic data but also decisions from the European Central Bank (ECB). In its previous meeting, the ECB cut interest rates by 25 basis points and signaled the possibility of further cuts. The Eurozone economy showed modest growth in the first quarter of the year, and although core inflation continues to rise, headline inflation is approaching the 2% target. Traders anticipate another 25 basis point rate cut at the next ECB meeting. In this content, the official ECB statement, economic forecasts, and remarks by ECB President Christine Lagarde will be critical; a cautious stance or inclination toward further cuts would likely weaken the euro in the short term.
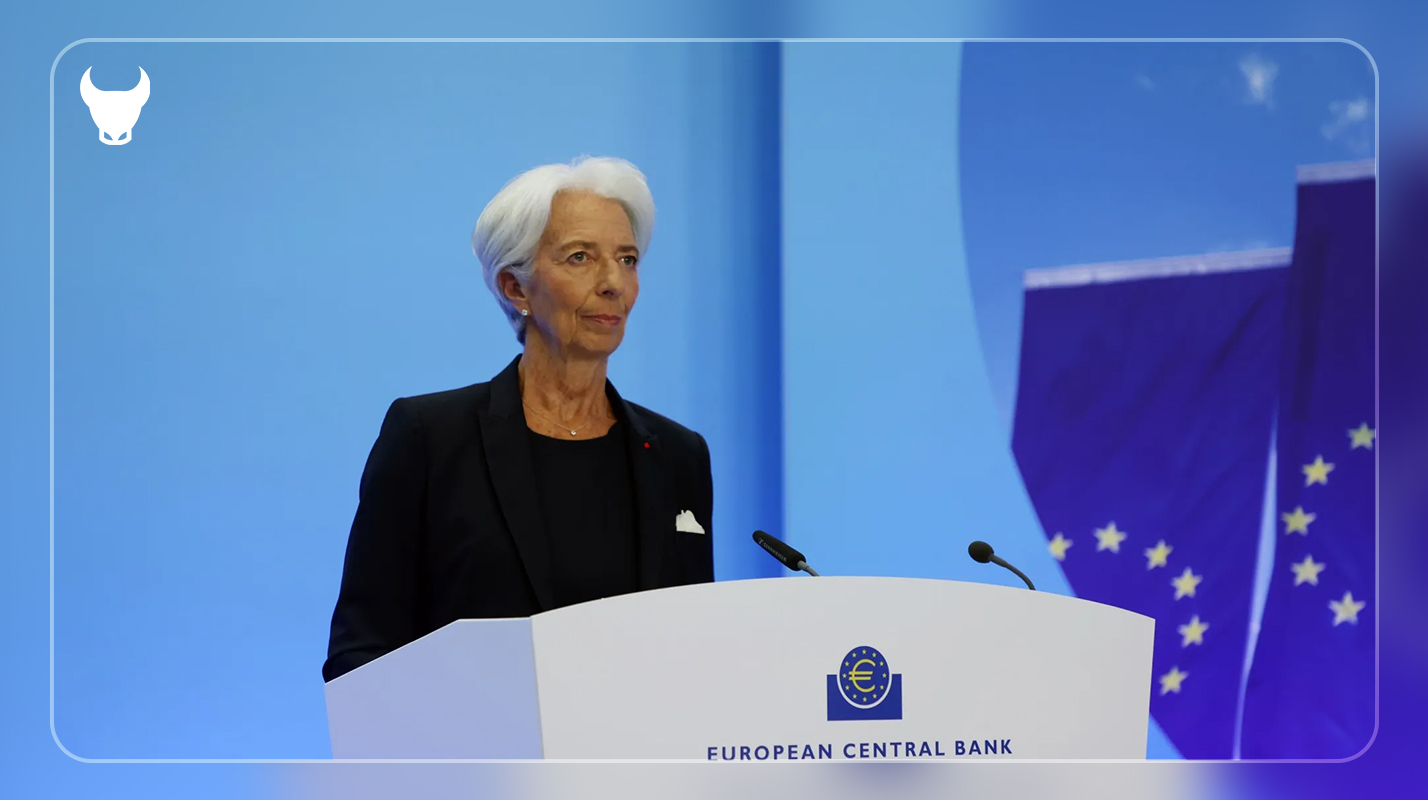
Christine Lagarde, President of the European Central Bank
Canadian Dollar Outlook | Central Bank Statement and Employment Report Under Scrutiny
After seven consecutive rate cuts, the Bank of Canada paused its easing cycle in April, adopting a cautious approach to inflation. While overall inflation in Canada declined from 2.3% to 1.7% in April, core inflation remains high. Therefore, the central bank is expected to maintain its current policy.
The statement from this meeting and the employment report for May will be pivotal for the Canadian dollar’s trajectory. Should the central bank express heightened inflation concerns and employment data surpass forecasts, expectations of rate cuts may diminish, strengthening the Canadian dollar. Therefore, it is essential to monitor the economic calendar closely and refrain from trading without being informed of the latest events.
Australian Economic Growth in Focus | Will the Australian Dollar Strengthen?
Asian markets await Australia’s Gross Domestic Product (GDP) report on Wednesday. The Reserve Bank of Australia (RBA) has recently reduced interest rates by 25 basis points and expressed concerns about economic growth challenges. The details of these concerns will be clarified in the minutes of the meeting held on Tuesday, June 3. Nevertheless, the Australian dollar has maintained relative stability, supported by improved global risk sentiment. If GDP data meets or exceeds forecasts, the Australian dollar is likely to strengthen.
Gold Volatility Ahead of Economic Reports | Central Bank Support and Bond Yield Challenges
Last week, gold closed at $3,288 on Friday, May 30, approximately 2% lower than the Monday, May 26, peak of $3,356. Meanwhile, the U.S. 10-year Treasury yield rose above 4.5% midweek before settling near 4.4%.
The U.S. dollar index fluctuated between 98.9 and 100, finishing the week at 99.44. This combination of a strong dollar and high bond yields encouraged sellers near the $3,330 level.
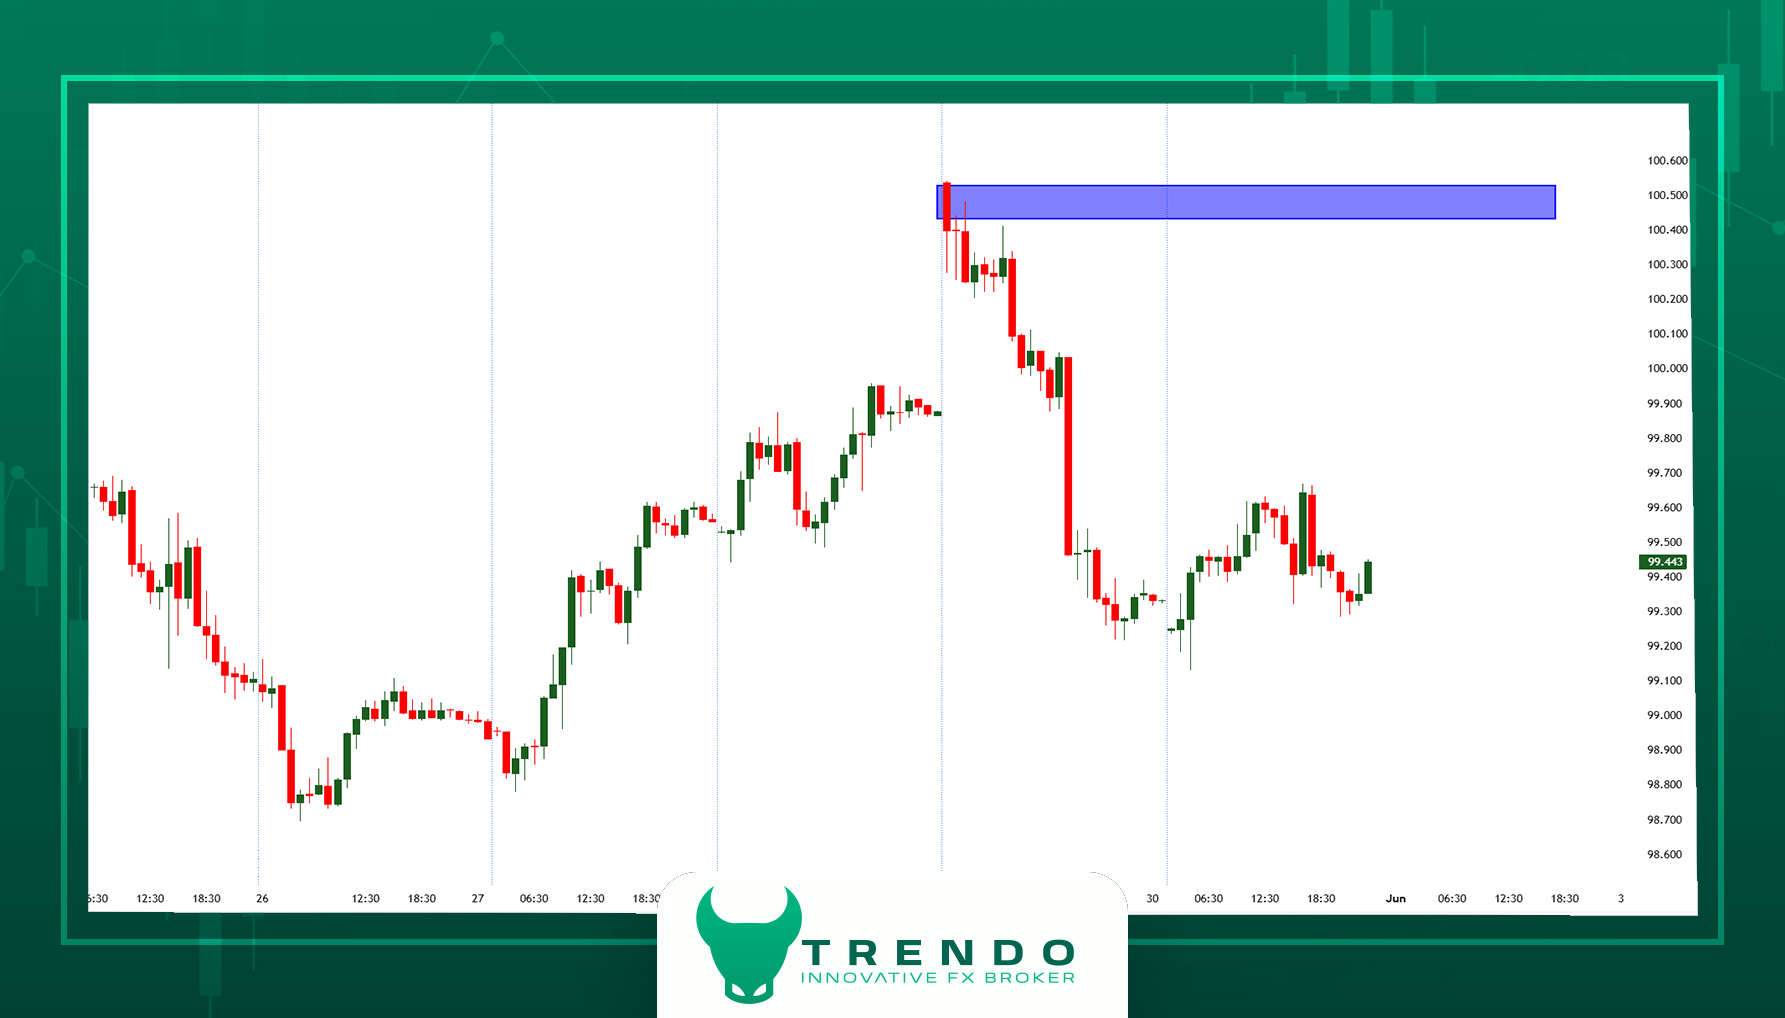
US Dollar Index Chart in One-Hour Timeframe
The main reason for the increase in yields was concerns regarding the budgetary status of the United States. Moody’s recently downgraded the U.S. credit outlook, and the passage of an expensive tax bill in Congress has increased the budget deficit, causing market caution about heavy bond issuance. Additionally, ongoing tariff policy shifts under the Trump administration have increased volatility in the dollar and stock market, leading traders to waver in their decision between investing in gold and keeping liquidity.
Nonetheless, from a fundamental perspective, supportive forces remain strong. The World Gold Council reported that central banks purchased 244 tons of gold in the first quarter of this year, slightly less than the winter record but still among the highest levels in the last three years. China has increased its gold reserves for the sixth consecutive month and expanded its gold import quotas.
In the short term, traders will focus on U.S. economic data. On Monday at 14:00 GMT, the ISM manufacturing index for May will be released. On Wednesday, the ISM services index is set to be published with an estimate of 52; the lower the figure of this report, the greater the pressure on the dollar. Also on Wednesday, the JOLTS report may confirm a decline in job openings, and Thursday’s weekly unemployment claims, recently at 240,000, will clarify the future path of interest rates. The week culminates with the critical NFP report on Friday, expected to show 130,000 new jobs, which will influence bond yield trends.
From a Technical perspective, nearby resistance is located in the range of $3,335 to $3,345; and breaking through this area will pave the way for reaching $3,500. Conversely, a strong move below $3,270 may increase the risk of a decline toward $3,140, near the May correction channel bottom.
Technical Analysis of Gold on H4 Timeframe in the Trendo Trading Platform - June 1, 2025
In summary, the long-term outlook for gold remains mildly bullish, supported by central bank gold purchases, persistent U.S. budget deficits, and ongoing geopolitical tensions. However, for short-term trading, attention should be paid to the economic data released this week. Risk management around the key levels of $3,270 (support) and $3,334 (resistance) is recommended, as breaking either will determine the short-term price direction.
Final Thoughts
As we dicussed in this weekly forex analysis, financial markets are on the verge of an exciting week where key data such as the NFP report, decisions from the European and Canadian central banks, and Australia's GDP report could dictate the path of currency pairs in Forex and global gold. Given the expected volatility from these events and uncertainties surrounding Trump’s tariff policies, traders should prepare with disciplined risk management and continuous monitoring of Trendo forex economic calendar. For access to up-to-date analyses and real-time news, follow us on Telegram and utilize the Trendo trading platform for professional trading.
Forex Weekly Analysis - May 25, 2025
In this weekly forex analysis, we delve into the latest economic and political developments that have once again captured market attention. Over the past week, a mix of renewed tariff threats and complex inflation reports have combined to place price trends in sensitive assets, such as gold, Bitcoin, currency pairs, and stock indices, at a critical crossroads.
Just as traders thought the markets were entering a calmer phase, a looming50% U.S. tariff threat against the European Union , a new Trump tax bill, and inflation data diverging from expectations have complicated the possible scenarios. This week calls for a closer look at the charts and careful listening to the political talks. The Trendo analytical team helps you integrate technical and fundamental analysis to prepare for informed decision-making.
Fundamental Market Analysis | Hidden Risks Beneath a Calm Surface
Last week’s seemingly balanced data and news failed to conceal the real risks from the markets’ eyes. At first glance, stable interest rates, modest economic data improvements, and rising stock indices evoked a positive atmosphere. However, the new Trump tax bill, heavy tariff threats against Europe, and rising core inflation in some countries clearly indicate that market calm may only be a temporary pause.
In this section of Trendo’s weekly forex analysis, we review key developments cohesively—from Federal Reserve decisions to Canadian inflation data, PMI reports, and the outlook for trade tensions that could shift market trajectories.
U.S. Federal Reserve & Inflation | Policy Steady but a Cautionary Outlook
The minutes from the Fed’s May meeting made it clear policymakers are in no rush to cut rates. Some members even considered the possibility of rate hikes again. The 2-year Treasury yield rose, the strengthening of the dollar, and the removal of the rate-cut scenario for the summer were the market's reactions to this message. Fed Chair Powell emphasized in his press conference that tariff pressures could lead to sustained inflation, not just a temporary spike.
Canadian Inflation Data | Hidden Inflation in the Shadow of Falling Energy Prices
Canada’s annual CPI fell from 2.3% to 1.7%, but core inflation indicators like Core CPI and CPI Median increased, signaling stubbornly high underlying inflation. The market lowered expectations for a rate cut at the next Bank of Canada meeting, strengthening the Canadian dollar.
UK Interest Rates | Room Opens for a Cut
UK inflation dropping to 2.3% increased the likelihood of a rate cut in June. This data weakened the pound and prompted investors to reconsider long positions. However, if wages remain high, the pace of rate cuts may be slower than expected.
Eurozone | Service Sector Growth, Manufacturing Slump
The composite PMI rose to 52.3, reflecting service sector expansion but ongoing manufacturing contraction. This mix raises the chances of the ECB starting rate cuts this summer. The euro gained slightly, though concerns about the industrial outlook persist.
G7, OPEC, and Trade Wars | Diplomatic Calm or Brewing Storm?
The recent G7 summit focused on China’s excess capacity, sanctions on Russia, and supply chain support. Meanwhile, OPEC+ agreed to extend production cuts until the end of 2025, likely keeping oil prices at higher levels. But the most significant development is the return of Trump's aggressive tone in trade policy:
- Threat of a 50% tariff on imports from Europe
- Approval of new tax legislation in the House of Representatives
- Emphasis on increased pressure on China and risky trade negotiations
Markets are pricing in possible scenarios ahead of June 1, when tariffs could take effect. This uncertainty is fueling hidden but dangerous volatility.
Summary of Weekly Fundamental Analysis by Trendo
At first glance, conditions appear more stable than before, but beneath the surface, political pressures, hidden inflation, and trade threats are shaping a complex outlook. Traders must act in the coming weeks with data-driven analysis and robust risk management strategies rather than emotional reactions.
Technical Analysis of Financial Market | Examining Key Price Levels in Major Assets
In this section of Trendo’s weekly forex analysis, we review the technical performance of key market symbols, focusing on price structure, candlestick behavior, and critical support and resistance levels. The current market environment relies more than ever on precise technical analysis, as many assets approach sensitive price zones where sudden moves could define medium-term trajectory.
Gold (XAU/USD) | Strong Rebound Approaching Key Resistance
After a decline to the $3,200 range, the price of gold experienced a significant rise last week, climbing to $3,350 level. This movement was accompanied by a resurgence in demand at support levels. However, in the 4-hour timeframe, the upward momentum has slowed, and gold now faces a critical resistance zone between $3,377 and $3,392, levels that have historically triggered meaningful price reactions.
The first support in the 4-hour timeframe lies between $3,306 and $3,310. A break below this could push gold toward $3,222–$3,205 in the daily timeframe. Gold's reaction to the upcoming resistance, particularly considering U.S. inflation data and the geopolitical landscape, will define the future direction of this asset.
Weekly Gold Analysis in Trendo
Bitcoin (BTC/USD) | All-Time High but Warning Signals Emerge
Bitcoin surged past previous resistance to hit a new all-time high of $111,980 last week but immediately faced heavy selling pressure, retreating to $107,000. In the daily timeframe, a Diamond Top pattern is forming, which could potentially reverse the trend if completed.
Additionally, the weekly candle of Bitcoin is closing as a high-volume Doji, a classic sign of market indecision at high levels. Negative RSI divergence on the weekly timeframe further reinforces this concern. Key supports stand at $104,000 and $98,500.
Bitcoin analysis on the Trendo trading platform
USD/CAD | Sharp Correction, Targeting Below Liquidity Zone
USD/CAD dropped over 2 % last week, currently trading near 1.37269. In the daily timeframe, a strong liquidity zone lies below 1.3435, which the market may move toward to gather orders.
Importantly, this level overlaps with the 200-week moving average, making it a powerful equilibrium zone. If the Canadian dollar’s weakness continues, this level could be tested rapidly. Traders should watch price action closely in these areas.
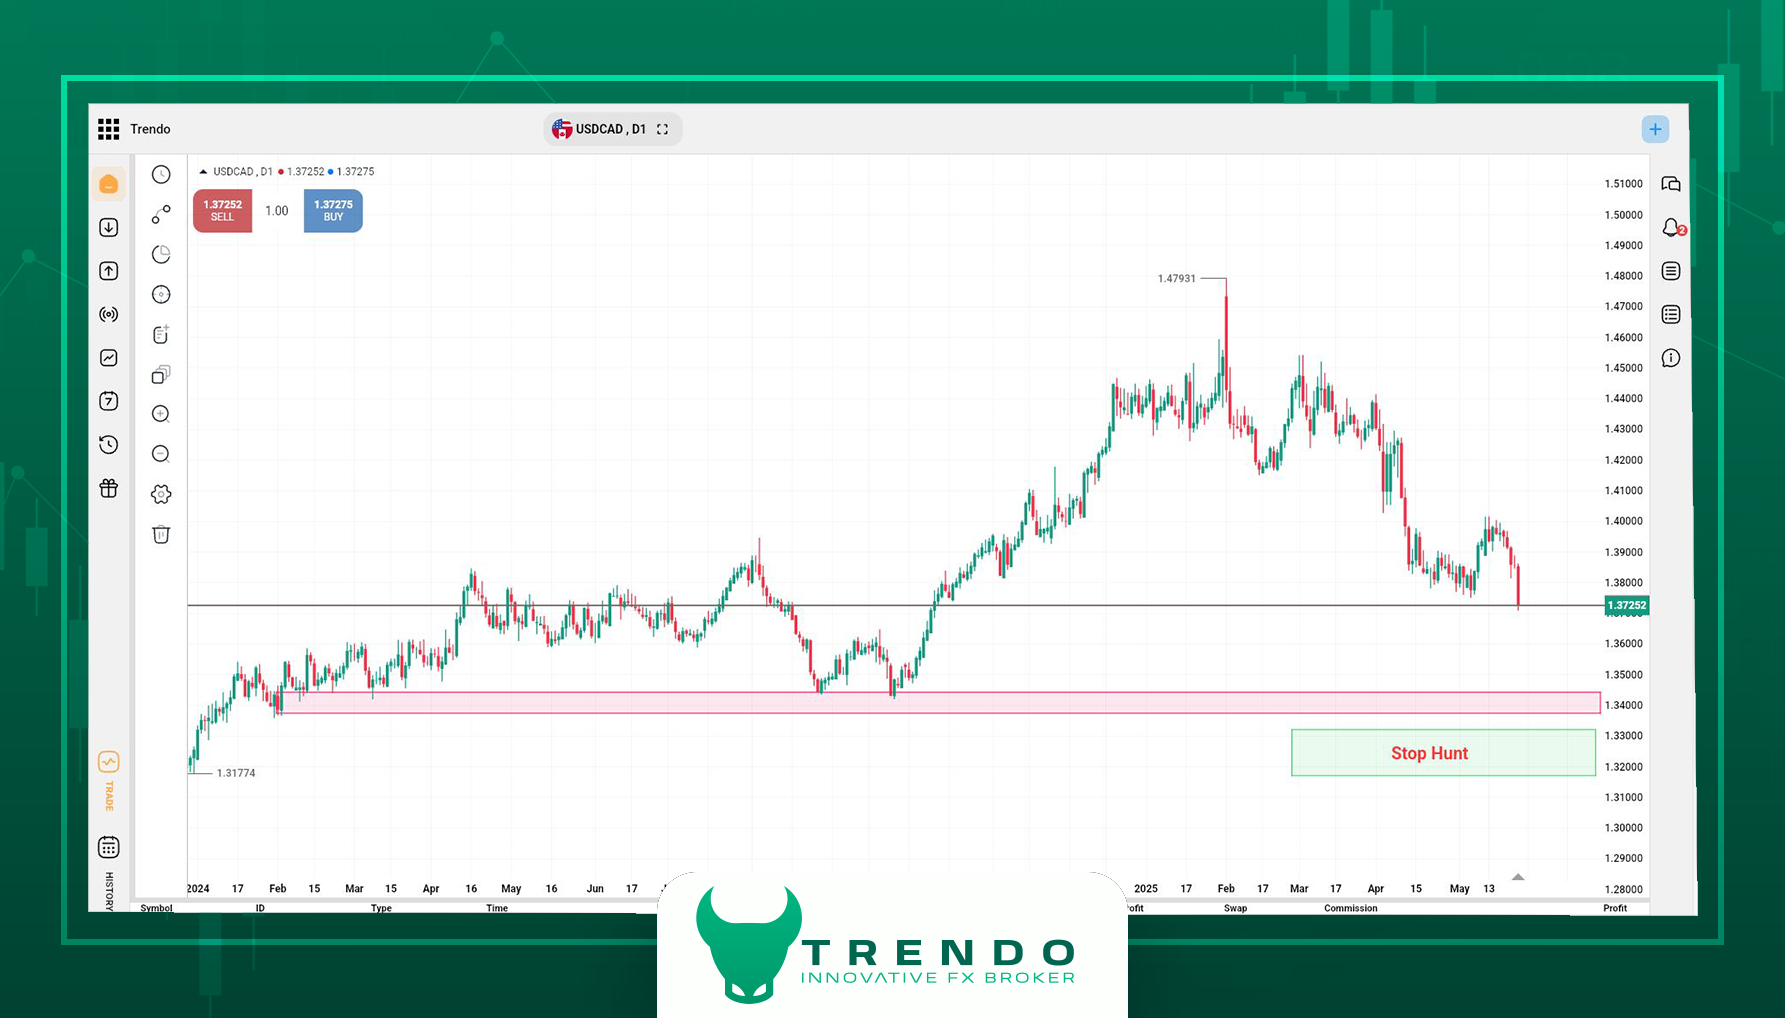
Technical analysis of USD/CAD on the Trendo broker
Summary and Final Recommendations
After a relatively calm week, markets are entering a new phase of uncertainty. From trade threats to hidden inflation pressures, many assets’ price structures are at sensitive ranges. In this environment, traders must prepare to respond to key upcoming data releases.
Events like the FOMC minutes, U.S. GDP report, and Core PCE could dramatically shift market direction. Other key data from New Zealand, Germany, Australia, and Canada will also impact currency pairs. In this environment, combining technical and fundamental analysis, following the economic calendar, and utilizing professional tools on the Trendo trading platform are more crucial than ever for sound decision-making.
Forex Weekly Analysis - May 19, 2025
In this weekly forex analysis from Trendo Broker, we review recent developments and forecast upcoming trends, offering practical insights for traders. Focusing on forex analysis-including both technical and fundamental perspectives-we closely examine the key factors influencing asset prices.
Last week, Donald Trump’s pivotal trip to the Middle East resulted in signing multibillion-dollar contracts with Arab countries, injecting a wave of calm not only into the Middle East but also into global markets. This major development sparked optimism across financial markets, impacting assets such as gold and Bitcoin. As this trend continues, traders are eagerly awaiting new opportunities. In the upcoming week, financial markets will be influenced by critical events including PMI data releases from the US, UK, and Eurozone, as well as speeches from Federal Reserve officials. These events are expected to trigger notable volatility in forex pairs, gold, and Bitcoin. For more information, please stay with us.
Weekly Gold (XAU/USD) Analysis in Forex
Gold faced significant selling pressure last week, leading to price declines and weakening its safe-haven appeal. The week opened at $3291.36 per ounce, but early selling pushed prices down to $3221.36. The downtrend extended to $3208 before the market entered a consolidation phase.
Later in the week, a second wave of selling on Wednesday pushed the price below $3200, and then down to $3180. By Friday, the price had recovered slightly to around $3197. The technical analysis in this section reflects a cautious market environment with no clear trend, influenced by economic data and monetary policy developments.
Experts’ Views on Gold
Adrian Day (Asset Management): The downtrend is likely to persist, but buying opportunities will emerge after a correction.
Adam Button: Unlikely that gold will fall below $3000.
Darin Newsom: Holding above $3123.30 could strengthen a bullish scenario.
Mark Leibovit: If selling pressure persists, the next support level lies at $2900.
Kevin Grady: Declining volume suggests major players are exiting, with algorithms now driving the market.
Fundamental analysis of gold highlights that rising bond yields and improving international trade relations have reduced gold’s appeal. However, maintaining the $3156.60 level (50-day moving average) could signal a temporary correction.
Global gold chart on the Trendo trading platform - Daily timeframe with 50-day moving average
Weekly Forex and Currency Pair Analysis
In the past week, the Forex market has been influenced by a combination of economic data, geopolitical developments, and monetary policies. The US-China trade agreement boosted risk appetite, while the US dollar gained strength supported by robust inflation data. Forex fundamental analysis shows traders have scaled back bets on Federal Reserve rate cuts, with the market pricing only 57 basis points of easing for the year.
United States: Upcoming PMI releases and Fed speeches will likely dictate the dollar’s direction. Dollar strength is probable if inflation concerns persist.
Australia: The Reserve Bank’s expected 25 basis point rate cut was delivered, but its cautious tone supports the Australian dollar.
United Kingdom: Inflation and PMI data, alongside Bank of England decisions, will shape the pound’s trajectory. Reduced expectations for rate cuts have bolstered the pound.
Eurozone, Canada, Japan: PMI and inflation figures will influence monetary policy decisions in these regions.
This weekly Forex analysis indicates that trade agreements have mitigated geopolitical risks; however, economic data set to be released next week will determine the market's trajectory.
Weekly Bitcoin Analysis
Bitcoin remains the leading cryptocurrency with a market cap of $2.05 trillion and dominance of 61.58%. Our analysis covers both technical and fundamental perspectives:
Bitcoin Technical Analysis
As of the time of writing this analysis, Bitcoin is valued at $103,408 and has experienced a 0.4 percent decline over the past 24 hours. Key support levels lie at $92,647 and $81,565, while resistance levels are at $104,000 and $120,000. It is anticipated that the price will fluctuate within the range of $94,000 to $105,000; however, if the $105,000 level is breached, a surge towards $120,000 is not out of the question.
Bitcoin chart on the Trendo trading platform - Daily timeframe
Bitcoin Fundamental Analysis
Fundamentally, three bullish forces are evident for Bitcoin, including global liquidity growth, the widespread entry of institutional investors through ETFs and corporate purchases, and the reduced supply following the 2024 halving. However, regulatory crackdowns and news shocks remain the primary risks that could exert downward pressure on Bitcoin's price and create a bearish trend.
Summary
As we have analyzed in this weekly Forex analysis from Trendo Broker, gold is undergoing a correction under fundamental pressures but key supports may alter the trend. The US dollar leads forex pairs, buoyed by strong economic data, while other currencies respond to monetary policies and economic releases. Bitcoin holds upside potential backed by technical and fundamental factors, though trading requires careful risk management.
For better decision-making, traders should combine technical and fundamental Forex analysis and closely follow key news from reliable sources. With PMI and inflation data on the horizon, markets may experience significant volatility this week. It is recommended to use the Trendo trading platform for precise monitoring of developments and to utilize advanced trading tools. Meanwhile, follow Trendo’s official Telegram channel for instant updates.
Forex Weekly Analysis - May 5, 2025
At the start of the week ending May 12, 2025, global financial markets are navigating one of the most complex political and economic crossroads. On one hand, a temporary 90-day agreement between the United States and China to reduce tariffs has revived hopes of easing trade tensions, while on the other hand, somewhat weak economic data from the U.S. and Federal Reserve warnings about inflation and unemployment have maintained a cautious atmosphere.
In this Trendo weekly analysis, we take a close look at the most significant fundamental developments and the reactions of key markets including gold, EUR/USD, Bitcoin, and U.S. stock indices, aiming to provide a clear outlook on what may unfold this week. For active financial market participants, this week could redefine investment directions for months to come.
Fundamental Analysis | Turning Points in Geopolitical and Monetary Landscape
Consideration of recent data and developments in the weekly forex analysis indicate that global markets are passing through a sensitive transitional phase, where economic signals, monetary policies, and diplomatic stances simultaneously shape asset trajectories.
1. U.S.–China Tariff Truce: A Genuine Hope or Just Artificial Breathing?
The most notable event this week was the 90-day agreement between Washington and Beijing to mutually reduce 115% of tariffs, which somewhat calmed market sentiment. Although limited and temporary, the establishment of a regular negotiation mechanism between the two sides was seen as a positive signal for risky markets. Particularly, the U.S. Treasury Secretary Janet Yellen emphasized that neither party seeks economic decoupling. The strengthening of stock and cryptocurrency markets in response to this news confirmed this sentiment.
However, analysts caution that if China insists on complete tariff removal and the U.S. does not make initial concessions, this truce could lead to a new deadlock. Therefore, it cannot yet be considered a definitive phase change in bilateral relations.
2. Federal Reserve | Steady Policy Amid Growing Risks
At the recent FOMC meeting, the Federal Reserve kept interest rates steady in the range of 4.25% to 4.50%. However, the final statement adopted a more cautious tone, highlighting for the first time the simultaneous rise in inflation and unemployment risks. Chair Jerome Powell, while emphasizing the strength of the U.S. economy, noted that tariff-related pressures could lead to structural inflation.
The renewed emphasis on a "data-driven" policy stance has left markets desperate. With strong employment data showing an increase of 177,000 jobs, the likelihood of a rate cut in June has diminished but remains heavily dependent on inflation rates and future indicators.
3. Europe and the UK | Unity Against External Pressures
European policymakers are striving to maintain trade unity against U.S. pressures. Chinese President Xi Jinping, during meetings with European officials, emphasized strategic cooperation with the European Union and called for resistance against "unilateral bullying." Meanwhile, the U.S. reduction of tariffs on British cars and steel signals a gradual improvement in transatlantic relations.
Meanwhile, the ECB President’s cautious remarks about the possibility of further rate cuts if economic growth weakens have added downward pressure on the euro—triggering a correction in EUR/USD.
4. Imported Inflation Factor: Tariffs and Consumer Goods Prices
A Wall Street Journal report on a potential 30% price increase for laptops and smartphones in the U.S. has intensified concerns about cost-push inflation. If tariffs lead to sustained price increases, the Federal Reserve may be forced to keep interest rates high to contain inflation—a move that directly impacts bonds, stocks, and gold markets.
Technical Market Analysis | Seeking Critical Levels and Price Confirmations
Continuing the weekly forex analysis, the technical outlook on key market assets reveals that many symbols have reached critical price levels after a week filled with political and economic headlines, making the next moves crucial for traders.
Gold | Heavy Downward Movement, Support Level at Risk of Breaking
After a historic rise to around $3,500 in recent weeks, gold entered a corrective phase last week, dropping to $3,200 now. This decline is considered a natural correction, with recent weekly candlesticks indicating weakening upward momentum and potential for further selling pressure.
From a technical perspective:
The $3,220 region is the first support level, which was previously noted in analysis and reacted to by the market.
If prices stabilize below this level, the next key support near $3,055 could be the next correction target.
On the daily timeframe, the significant distance from the 200-day moving average and today’s (May 12) candlestick near the previous low may increase the likelihood of breaking this support.
From a psychological point of view, easing tensions between India and Pakistan or progress in U.S. trade agreements could exert additional downward pressure on gold prices.
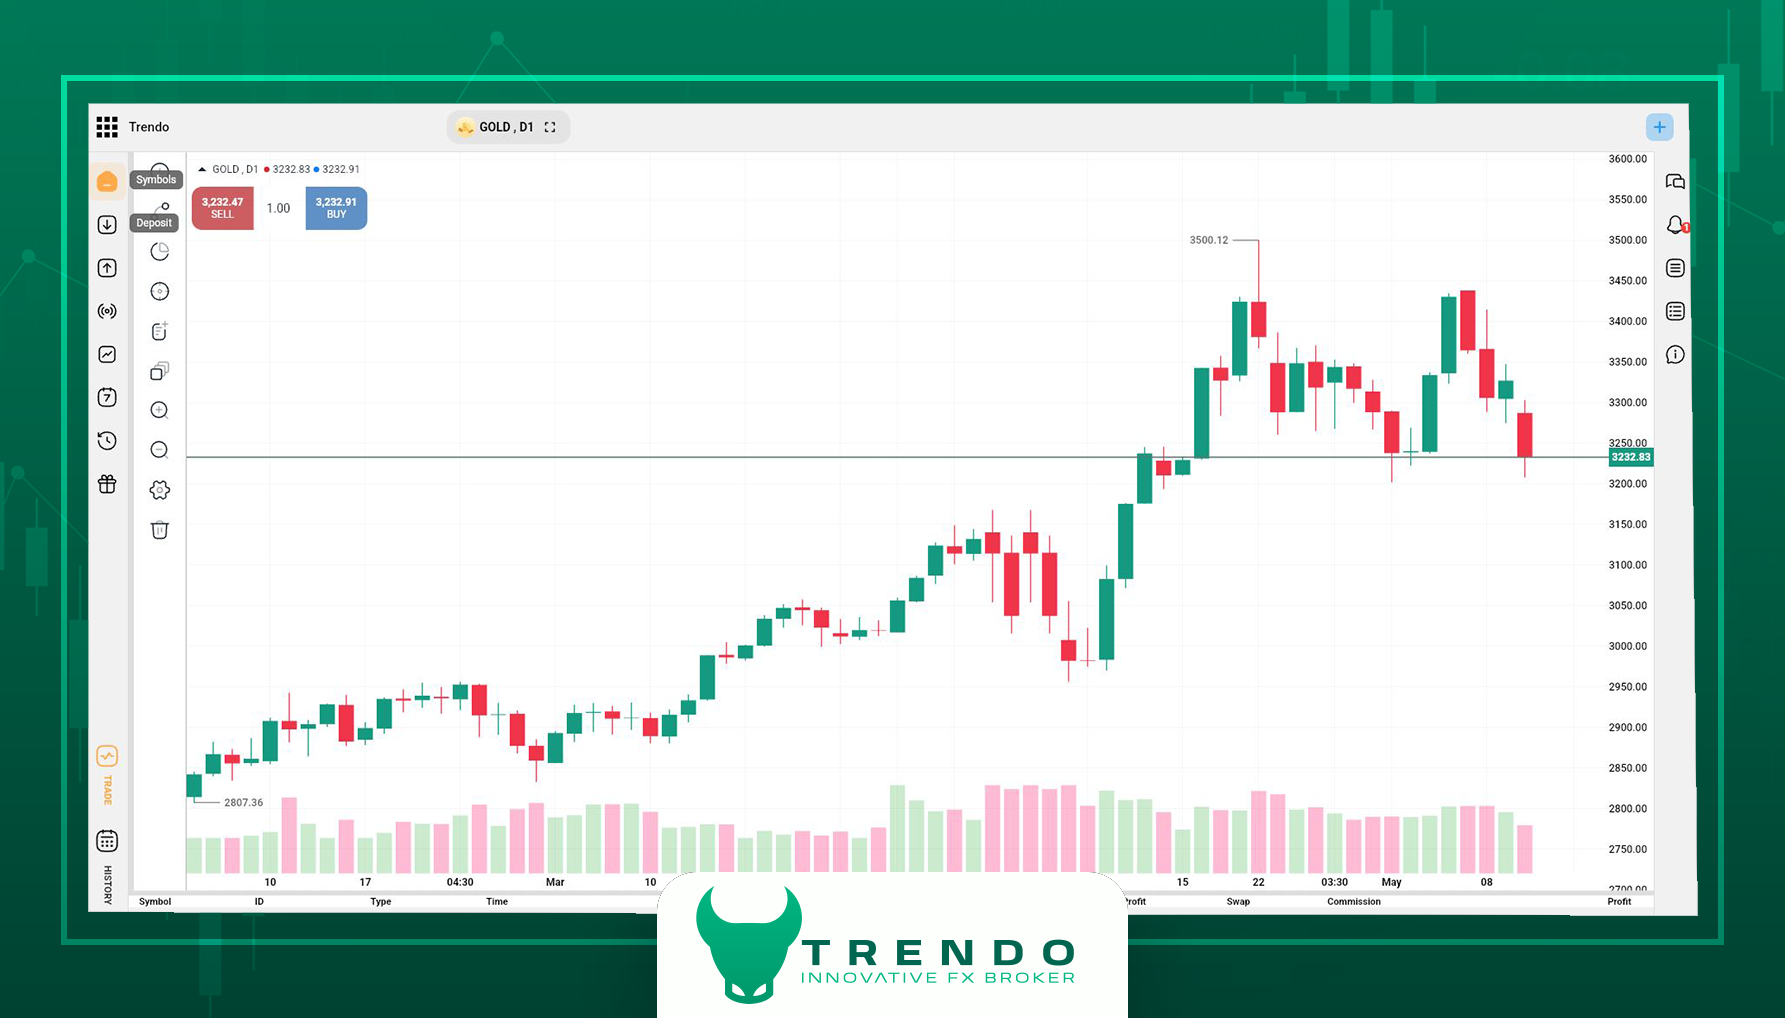
Technical Analysis of Gold in Trendo
EUR/USD | Broad Correction Approaching Critical Level
After weeks of limited volatility, the EUR/USD pair experienced a roughly 2.5% decline last week, reaching around 1.1100.
Key points:
The 1.1010 level is a significant support, validated by both the 61.8% Fibonacci retracement of the prior upward move and price structure.
Selling pressure was evident in the May 12 daily candle. If this candle closes below 1.11, the probability of testing 1.10 support increases.
Breaking this zone could open the path toward the psychological 1.0950 level.
The euro’s next move will depend heavily on ECB monetary decisions and the outcome of Europe-U.S. trade negotiations.
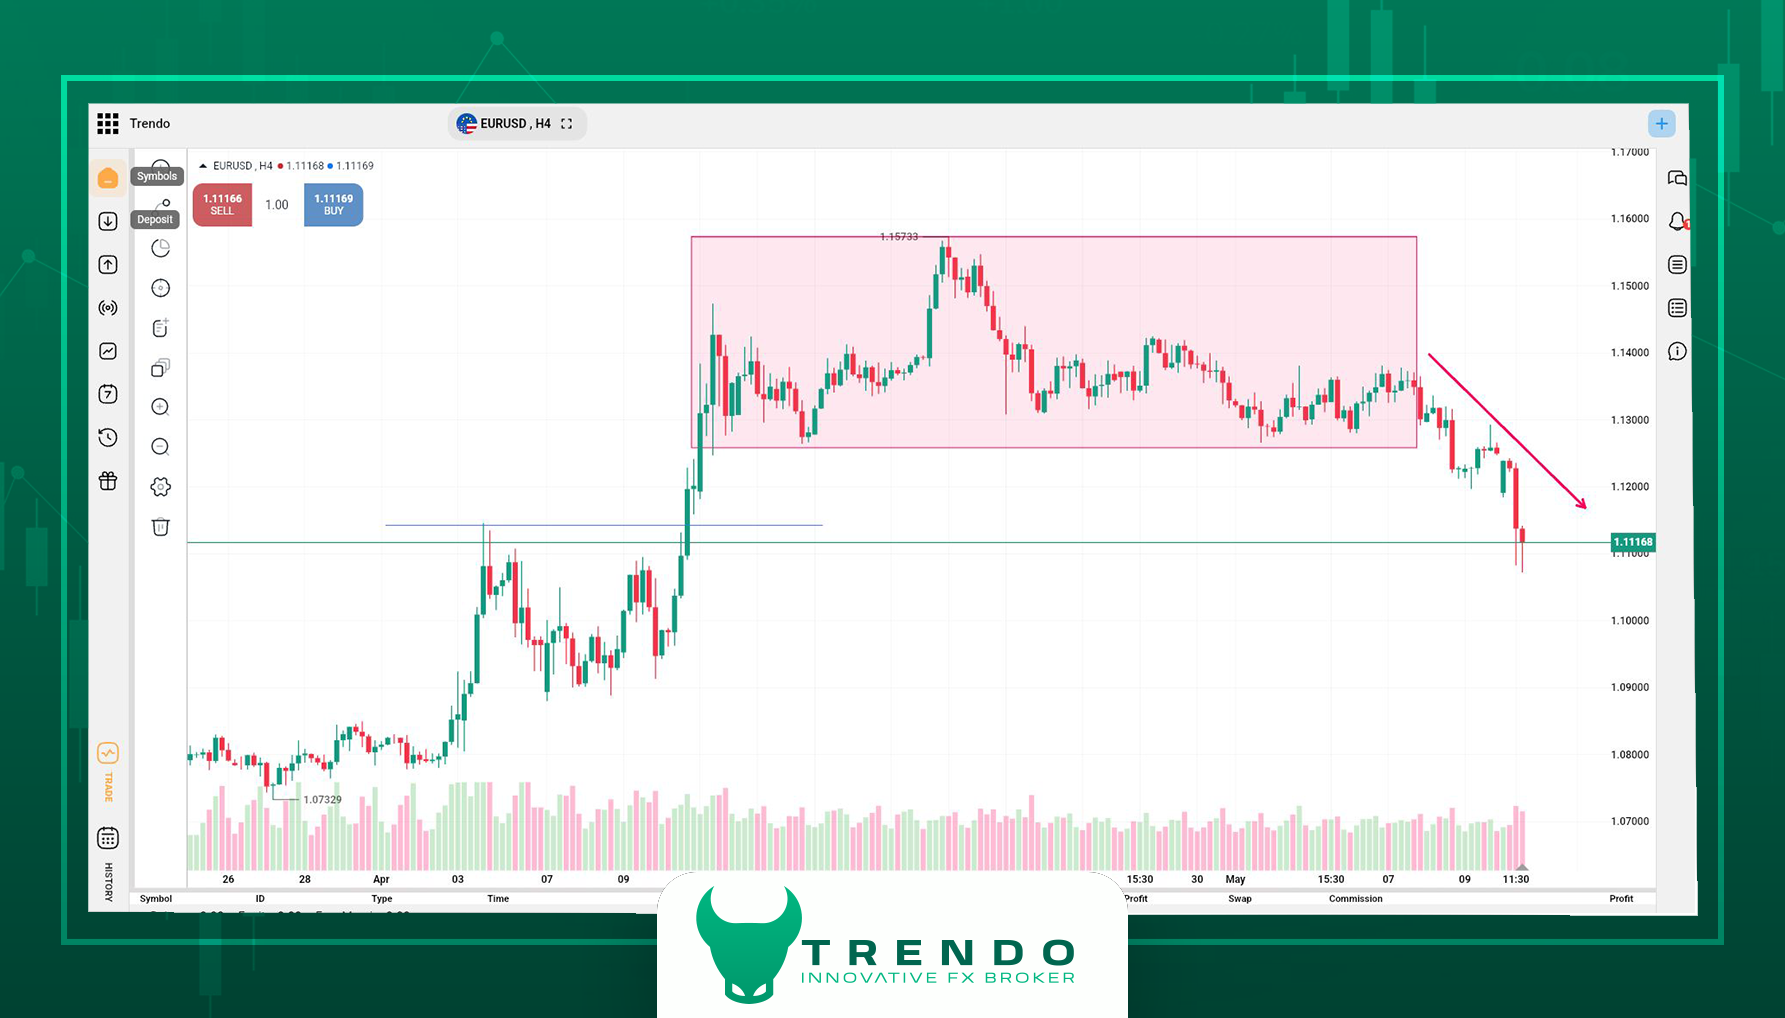
Technical analysis of EUR/USD in the Trendo Trading Platform
Bitcoin | Breaking Above $104,000 or Short-Term Correction?
Bitcoin broke out of its 10-day range between $90,000 and $94,000 last week, advancing to $104,000 amid a relatively calmer political and tariff environment.
On the daily timeframe, RSI indicator has entered overbought territory, with divergence signs on the 1-hour chart.
First and second supports are at $101,500 and $96,900, respectively.
If trading volume continues to decline, a temporary correction is plausible, though the upward structure remains intact.
The next psychological and technical resistance lies between $108,000 and $110,000.
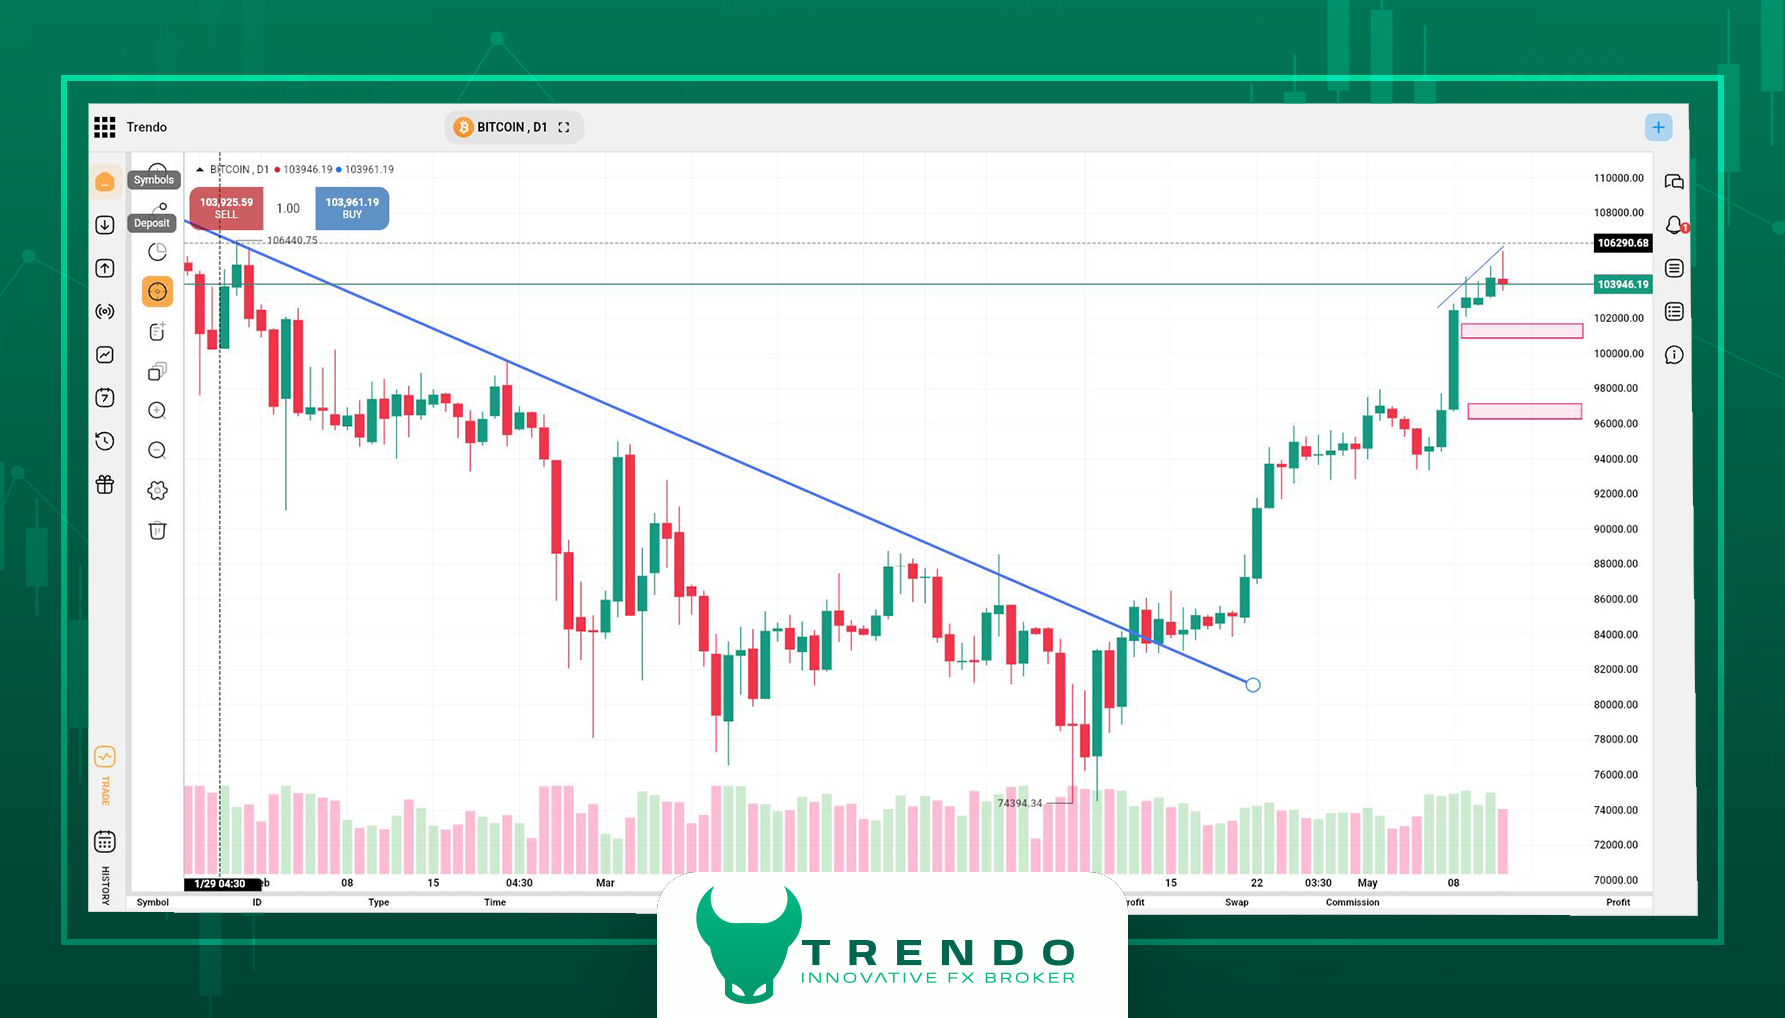
Weekly Bitcoin analysis in Trendo broker
U.S. Stock Indices | Breaking Out of the Range, Eyes on Resistance
In last week’s analysis, we accurately warned that the NASDAQ and S&P 500 indices were on the verge of breaking out of their consolidation range. This week, that scenario played out exactly as expected.
The NASDAQ index has approached the critical resistance level near 21,300 points.
The recent price action is strong, indicating fresh capital inflows into the Socks market.
If the political climate remains stable and trade deals progress, surpassing this resistance is likely; otherwise, a downward reaction could occur.
Stock market traders should closely monitor President Trump’s positions and related policy implications, which will influence the market’s direction.
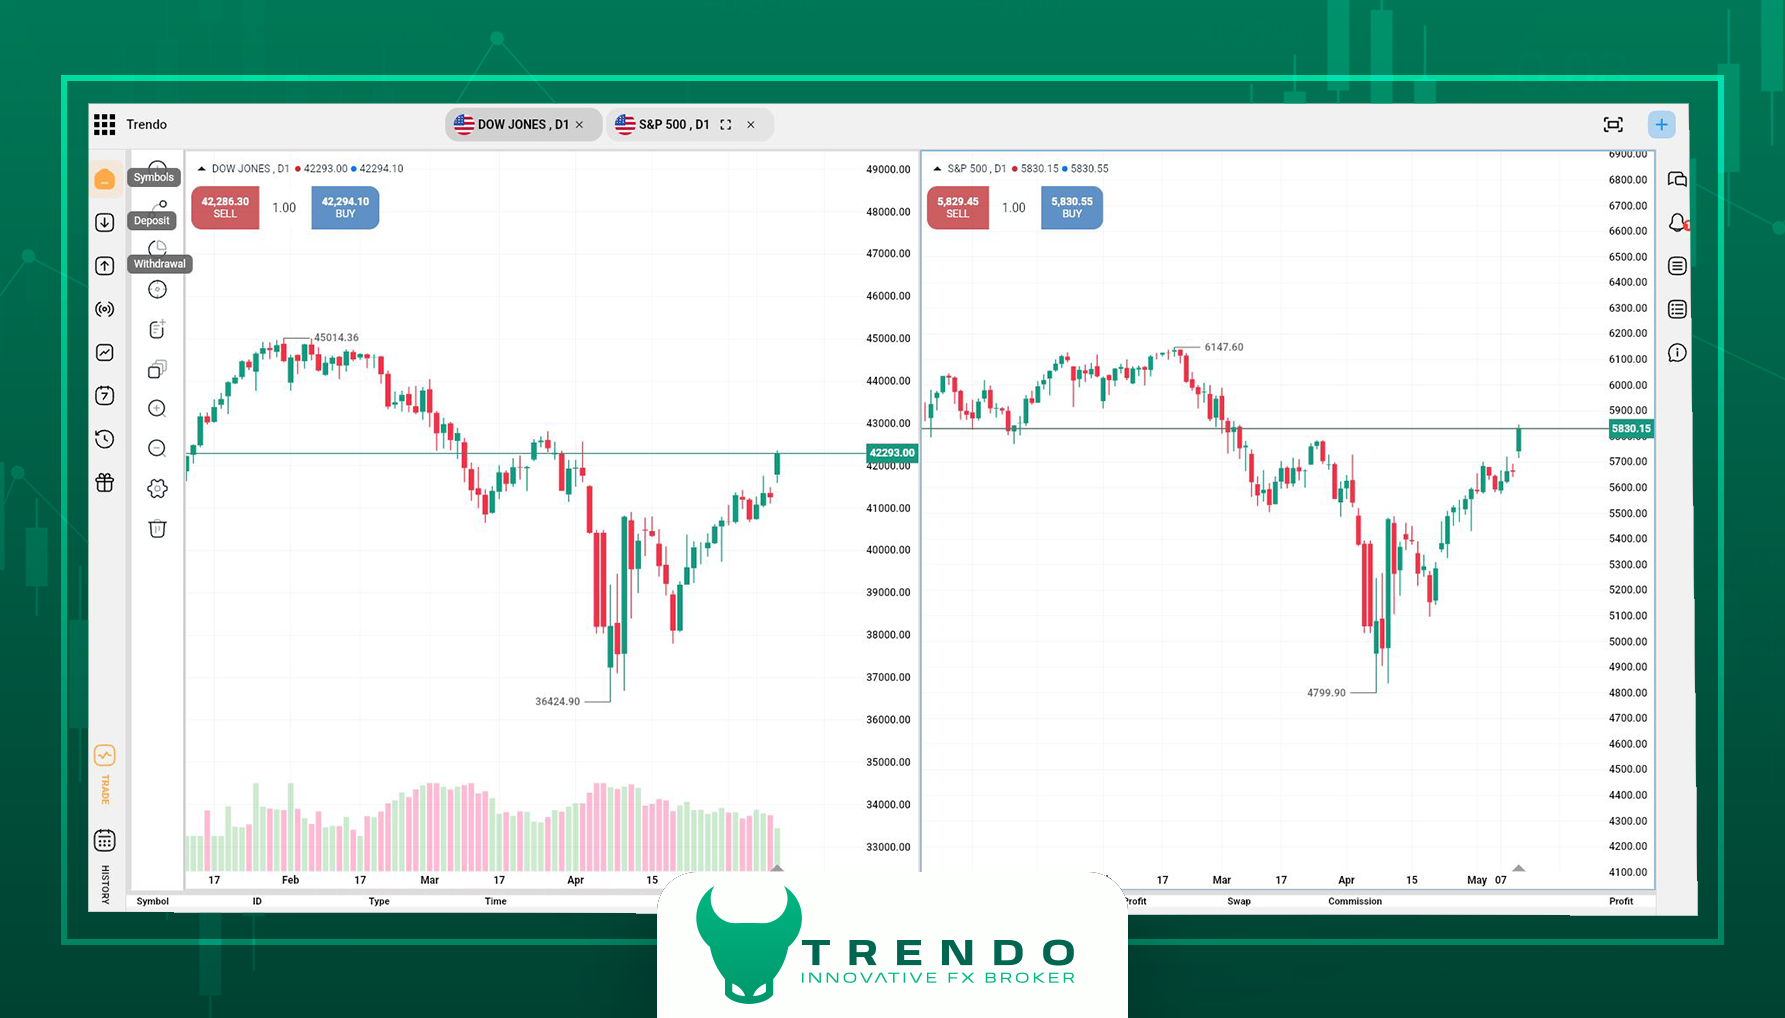
Technical analysis of stock indices
Final Note on Weekly Financial Markets Analysis
As financial markets contend with a complex mix of political, economic, and trade developments, traders must pay heightened attention to risks, key price levels, and fundamental signals. The corrective trend in gold, Bitcoin’s potential to surpass its historical high, selling pressure on EUR/USD, and rising stock indices all indicate a reallocation of liquidity flows.
In the upcoming week, any developments in tariff negotiations, interest rate decisions, or statements from economic leaders could trigger new market waves. It is advisable to use theTrendo trading platform to closely monitor market developments and take advantage of advanced trading tools. At the same time, follow Trendo’s official Telegram and Instagram channels for real-time updates and insights.
Forex Weekly Analysis - May 5, 2025
Following the previous weekly analysis, which highlighted the relative stability of currency pairs, investor risk aversion, and the unprecedented rise of gold, the financial markets have remained engulfed in an atmosphere of uncertainty driven by economic and political developments this week. From ongoing tariff tensions between the U.S. and China to conflicting statements about negotiations and interest rate cuts, everything suggests uncertainty and anticipation.
In this weekly forex analysis, we aim to provide a clear outlook on the trajectory of key assets such as gold, Bitcoin, major currency pairs, and stock indices by integrating fundamental and technical data. Whether you trade forex, cryptocurrencies, or commodities, this report from the Trendo analysis team will equip you with sharper insights for your trading decisions.
Fundamental Analysis of Financial Markets | Update May 5, 2025
Based on recent data releases, we have witnessed the emergence of a complex narrative stemming from the confrontation of economic data, monetary policies, and political tensions. Trading environment remains overshadowed by geopolitical instability, tariff disputes, and fluctuating interest rate expectations - all directly influencing the direction of major financial assets.
U.S. Labor Market and Mixed Employment Data
Last week, the U.S. non-farm payrolls (NFP) report was released, showing an increase of +177,000 jobs, exceeding market expectations. The unemployment rate stabilized at 4.2%, and although wage growth slightly slowed, the data still points to a relatively healthy economy. Analysts interpret this as a sign that the Federal Reserve is unlikely to cut interest rates immediately.
Its impact on the market
This has strengthened the U.S. dollar index, exerting mild pressure on assets like gold and major currencies (notably EUR/USD, GBP/USD, and USD/CAD). Meanwhile, teh U.S. stock market reacted to this data with limited volatility.
Ongoing Psychological Tariff War Between China and the U.S.
Contradictory statements from President Trump about possible talks with China’s president, alongside China’s denial of any formal negotiations, indicate that the trade war remains at an impasse. In this context, Washington seeks to initiate talks, but Beijing demands tariff rollbacks or modifications as preconditions.
This mutual distrust weighs heavily on global stock markets and boosts demand for gold as a safe-haven asset. The U.S. dollar has strengthened short-term, yet geopolitical risks continue to hinder sustained growth.
South Asia Tensions; Risk of India-Pakistan Military Conflict
Threatening remarks from Pakistan’s Defense Minister about a potential imminent Indian military strike have introduced a new source of tension on the global stage. Given the nuclear capabilities of both nations, global investors have shifted toward safe-haven assets such as gold and the Japanese yen.
Its impact on the market
This has led to a notable increase in gold demand and potential volatility in Asian and regional currency pairs. This risk-averse environment may also impact commodity-linked currencies.
Disappointing U.S. Manufacturing Data and Soft Recession Signs
The ISM and PMI manufacturing indices reveal continued contraction in the U.S. manufacturing sector. Despite a relative improvement in new orders, soaring costs and declining business confidence raise structural concerns within the U.S. economy.
Its impact on the market
The likelihood of interest rate stabilization or cuts in coming months has diminished; however, pressure on manufacturing and export-oriented firms is mounting. If this situation persists, it could lead to a weakness in the U.S. stock market and reduced industrial demand.
Cautious European Policy and Euro Outlook
Comments from ECB officials Lagarde and De Guindos suggest the European Central Bank remains data-dependent. Although inflation is trending down, slowing economic growth and reduced investment in the Eurozone keep the possibility of near-term rate cuts alive.
The euro remains under pressure, with markets awaiting concrete ECB action. European stock indices face instability amid domestic and global concerns.
Canada’s Policies: Walking a Tightrope
With Mark Carney as Canada’s new Prime Minister emphasizing economic independence from the U.S., attention is on bilateral relations. Meanwhile, the Canadian CPI and interest rate expectations are also at the forefront of market attention.
The USD/CAD has remained in a fluctuating range, and upcoming data, including CPI and fiscal policies from the new government, will determine the future trajectory of USD/CAD.
Summary of This Week's Fundamental Analysis
This week’s fundamental analysis depicts a fragile market environment where any data release or statement can trigger significant volatility. Tariff wars, regional political tensions, and slowing growth in key global economies highlight a market landscape fraught with risk and news dependency.
Traders in the upcoming week should closely monitor economic data and political developments, employing professional tools available on the Trendo trading platform for effective risk management.
Technical Analysis of Financial Markets | Price Consolidation Week
Continuing the trend noted in the previous weekly analysis, financial markets remain in a consolidation phase. Major currency pairs, cryptocurrencies, and stock indices are trading within critical ranges where reactions to this week’s key data will likely clarify market direction.
Gold | Correction Halt at a Key Level; Awaiting Fresh News
After reaching a historic high of $3500, gold corrected mildly last week, oscillating around $3300 level. The positive price reaction at the important $3220 support level indicates its strength. However, the market remains in a wait-and-see mode without clear signs of a bullish reversal.
On the daily timeframe, the trend remains corrective, while hourly timeframe reveal a range-bound structure. Gold must break decisively in one direction this week, potentially triggering a volatile move.
Geopolitical tensions between India and Pakistan, unresolved U.S.-China trade disputes, and uncertain negotiations maintain the potential for gold to surge again. Should news intensify, a rally toward the psychological resistance at $3400 is plausible.
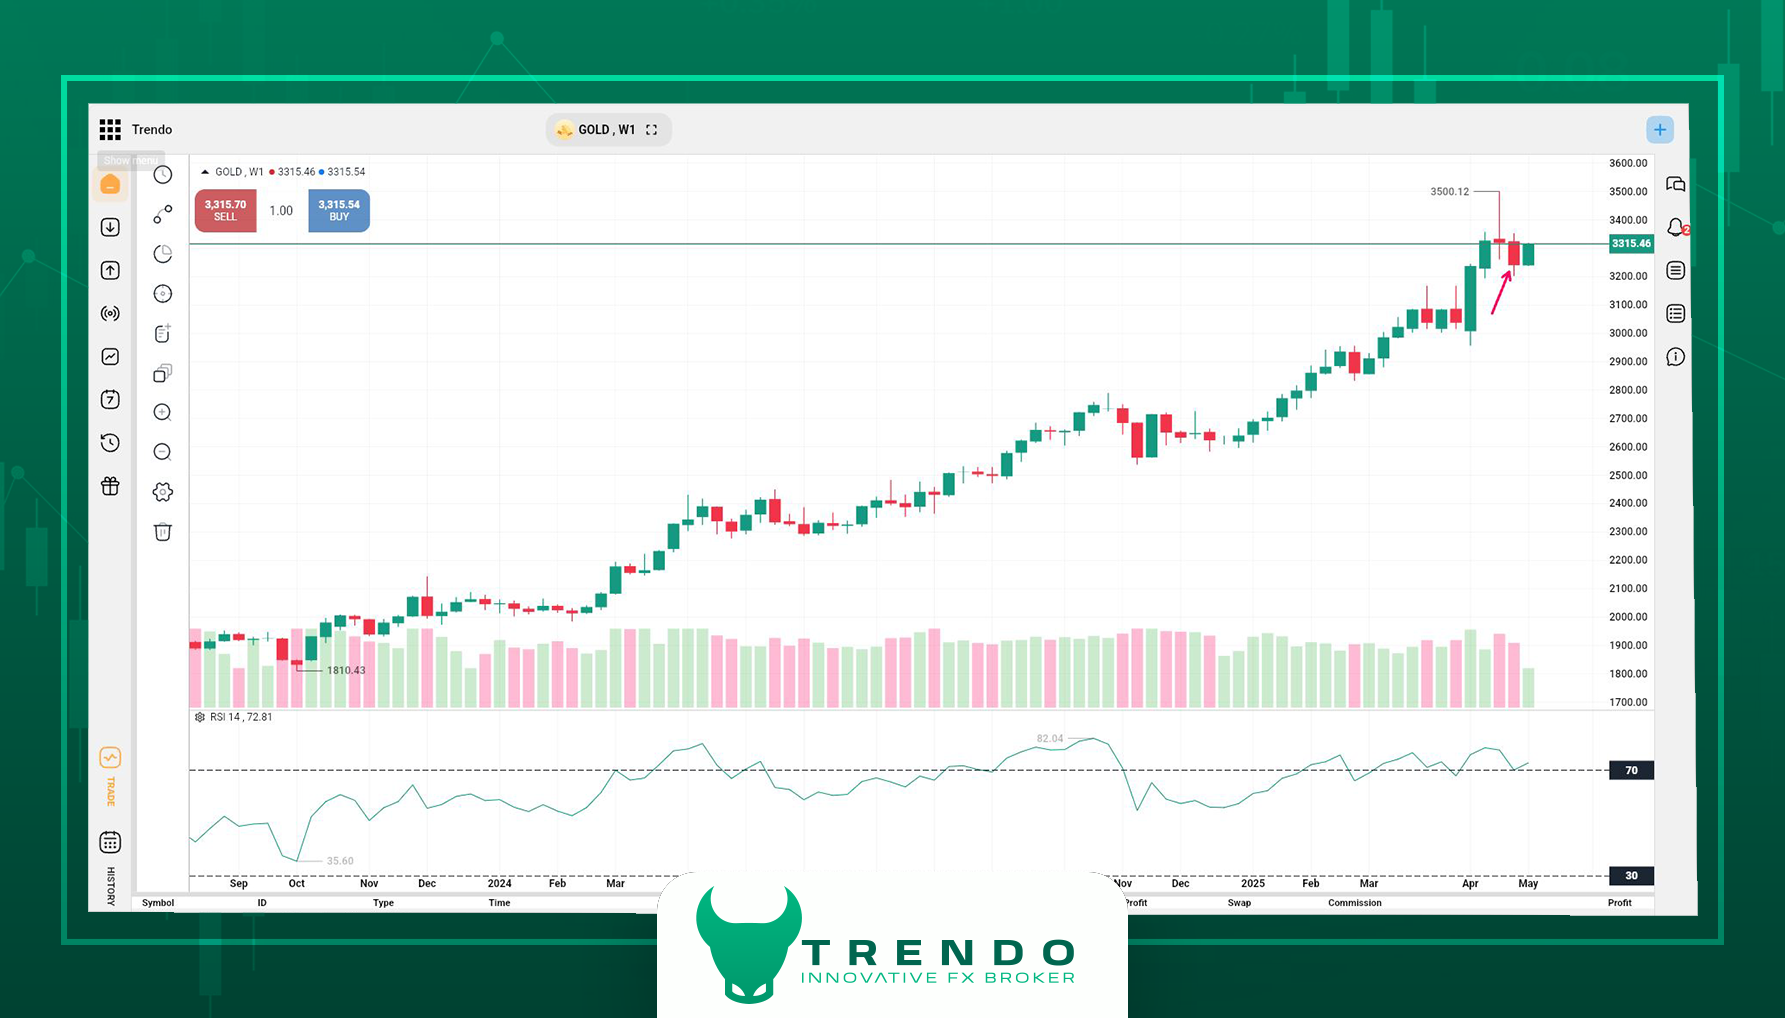
Comprehensive analysis of gold in Trendo
Bitcoin | Volatility in a Critical Range; Divergence and Volume Drop, Signal Possible Correction?
Bitcoin exhibited calm price action last week, failing to break above the key resistance near $98,000. Currently, it fluctuates around $94,000, close to last week’s level.
On the 4-hour timeframe, the decrease in trading volume and a bearish RSI divergence, suggesting weakening upward momentum and a possible short-term correction. Key supports lie at $91,000 level and then at $89,100.
Nonetheless, the overall market structure remains bullish. Heightened geopolitical or financial instability could renew Bitcoin’s appeal as a safe-haven asset.
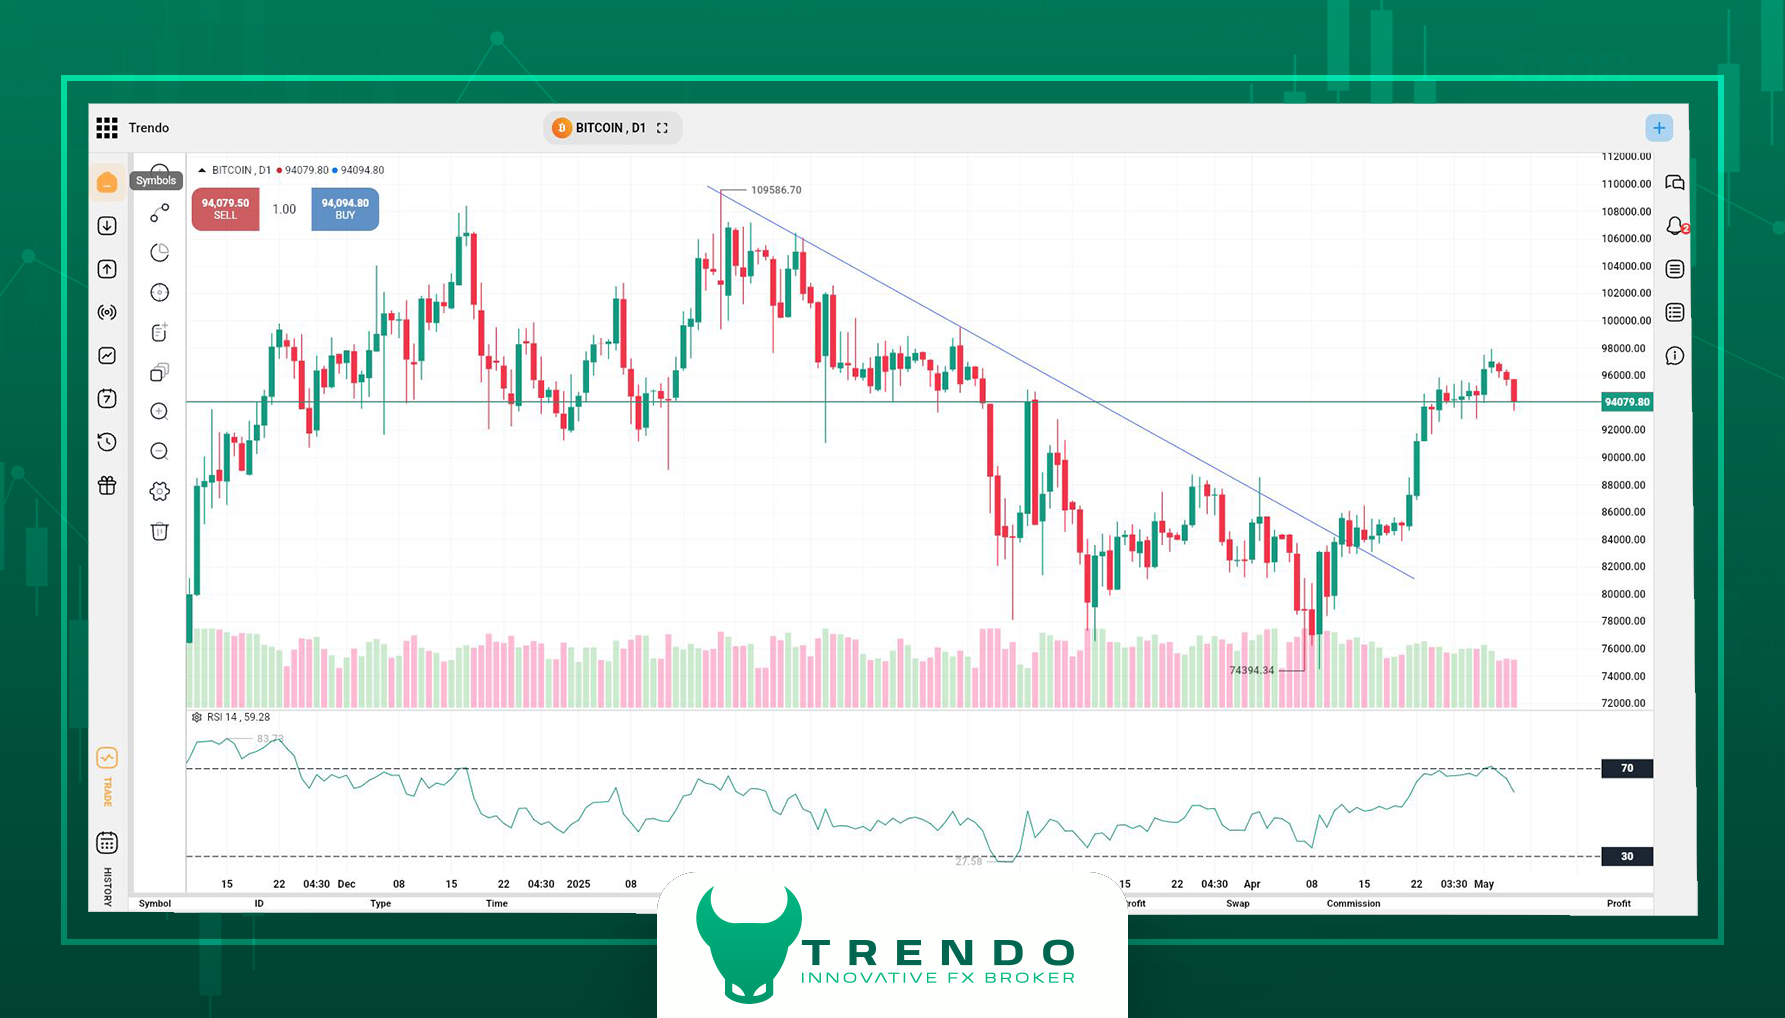
Technical analysis of Bitcoin in Trendo
Evident Stability in Currency Pairs and Indices; Market Awaits Major Decisions
As emphasized in the previous weekly analysis, major pairs such as EUR/USD, GBP/USD, USD/CHF, and USD/CAD continue to trade within established ranges without significant breakouts or reversal patterns.
Additionally, major U.S. stock indices, including NASDAQ and Dow Jones, have remained in a consolidation phase near their key resistances following recent gains.
Considering the important economic events on the horizon, such as the Federal Reserve’s interest rate, UK interest rate, and CPI releases for the U.S. and Switzerland, this neutral stance may soon give way to sharp, volatile moves.
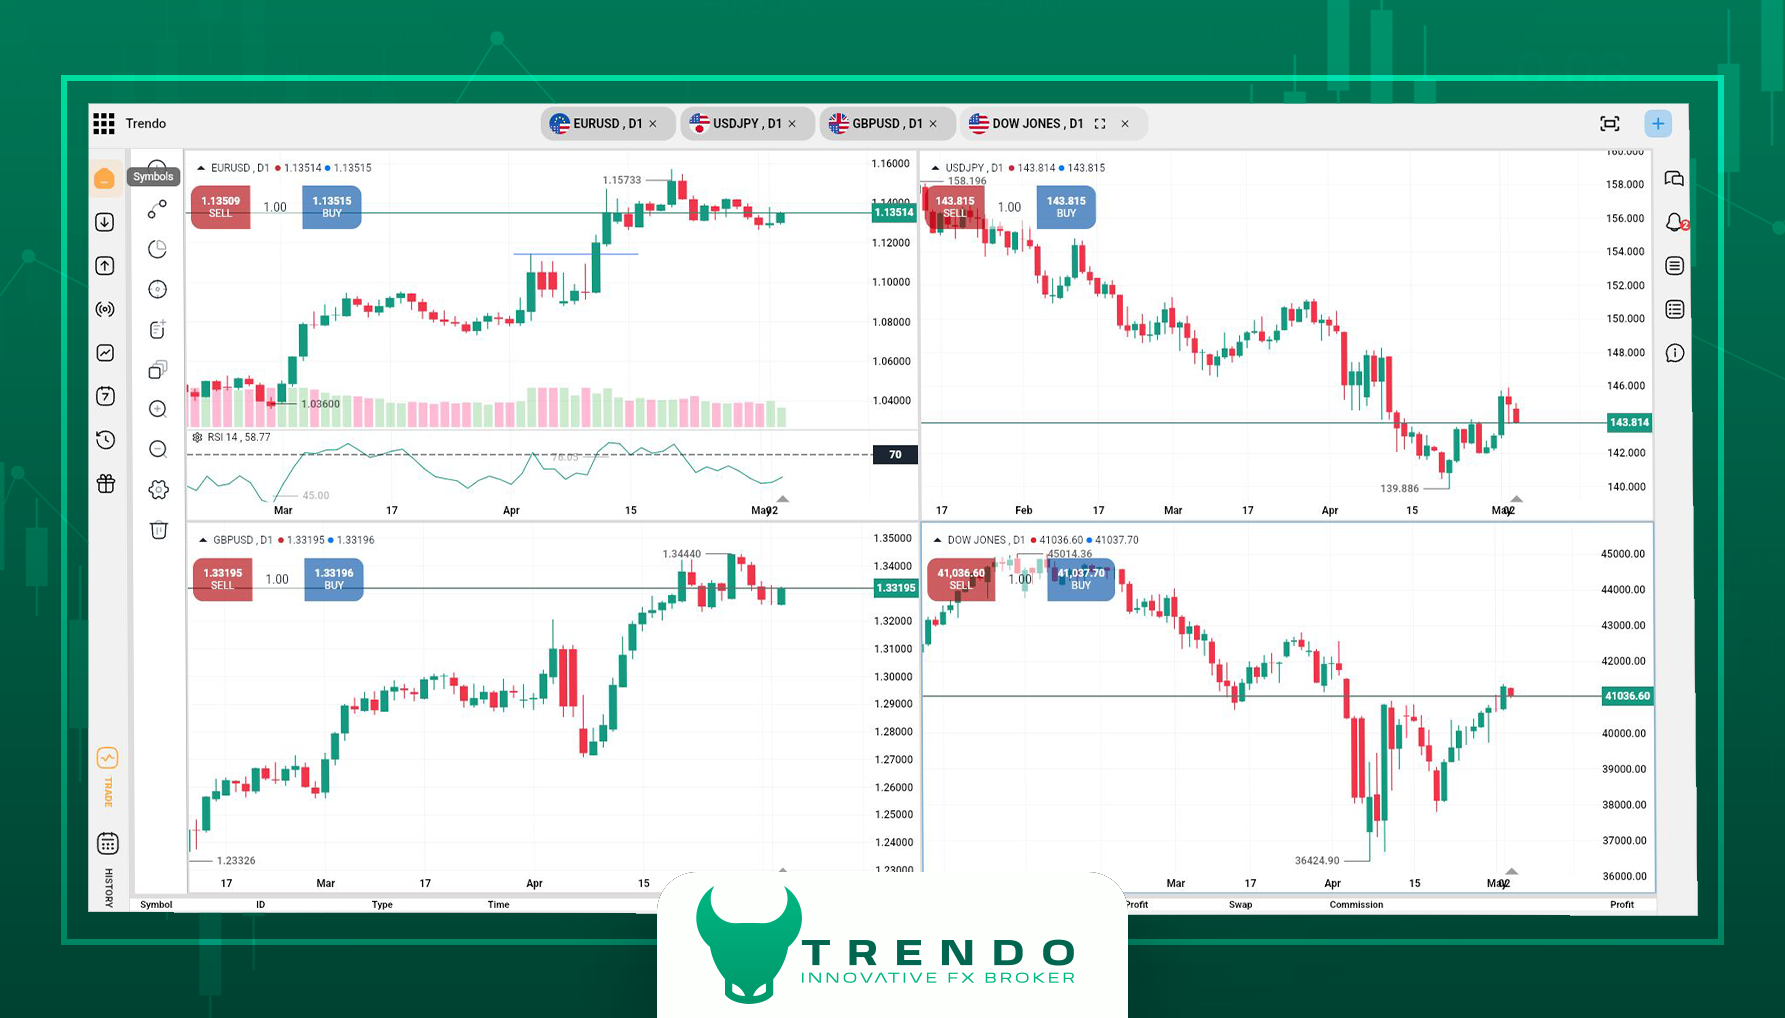
Forex market analysis in Trendo trading platform
Summary and Final Recommendations
In the week ahead, markets stand at a critical juncture, balanced between apparent stability and the potential for sudden shifts. The release of key economic data such as the Federal Reserve’s interest rate, the Bank of England’s interest rate, and inflation indices from the United States and Switzerland could directly alter the trajectory of numerous currency pairs and popular assets. Meanwhile, geopolitical developments and trade negotiations, especially between the U.S. and China, continue to fuel psychological market volatility.
In such an environment, traders must prioritize risk management and comprehensive analysis. It is recommended to utilize the analytical tools of the Trendo trading platform for live data monitoring, economic calendars, and key technical levels. Follow Trendo’s Telegram channel for instant updates, analytical alerts, and trading opportunities. The coming week could shape market trajectories for an extended period.
Forex Weekly Analysis - April 27, 2025
In the latest Weekly Trendo Analysis, we take an in-depth look at last week’s most significant fundamental and technical developments, a week influenced by US-China trade negotiations, bond market volatility, and statements from economic policymakers. This week’s forex analysis shows that many currency pairs are trading at critical levels, while gold has reached unprecedented highs and Bitcoin has climbed to historic levels, capturing considerable attention from investors.
If you’re looking to better identify trading opportunities in financial markets and wish to make more informed steps by closely examining economic trends and price flows, this market analysis offers you a reliable roadmap. Join the Trendo analysis team as we review the week’s major events and the outlook for major assets.
Fundamental Analysis of Financial Markets
In the fundamental part of weekly Trendo analysis, global markets were influenced by news surrounding US-China tariff negotiations, central bank monetary policies, and geopolitical developments. The pressure from the US budget deficit, a sharp rise in Treasury yields, and the cautious stance of Federal Reserve officials contributed to heightened market volatility.
In Europe, the statements from Christine Lagarde and officials of the European Central Bank indicated that the anti-inflationary path continues, though any final decision on rate cuts remains dependent on upcoming economic data. Meanwhile, China has taken a hardline stance in tariff negotiations, emphasizing that discussions will not commence unless the US changes its approach. The official announcement of a Trump-Xi Jinping meeting in early May has somewhat revived hopes for easing trade tensions.
In the commodities and cryptocurrencies markets, gold surged to a new all-time high of $3,500, and the rally of Bitcoin toward the $95,000 range signaled heightened uncertainty and a flight of capital towards safe-haven assets. In such conditions, traders must be more cautious in Forex and other Financial markets’ analysis and consider potential scenarios.
Technical Analysis of Markets
Following the weekly Trendo analysis, we turn to a detailed technical review of key assets. Given this week’s turbulent fundamental developments and significant financial markets shifts, critical price levels and behavioral patterns are playing a major role in shaping traders’ decisions.
In this section of the financial market analysis, we closely examine the trends of assets such as gold, Bitcoin, stock indices, and key currency pairs.
Gold Technical Analysis
As forecasted in previousweekly Trendo analyzes , which had predicted a strong rise in gold prices and a breach of key levels, gold has once again broken its historical highs, reaching $3500. However, as previously warned, signs of overbought conditions on higher timeframes and a significant gap from the 200-day moving average set the stage for a potential correction.
Last week, after hitting its record peak, gold entered a corrective phase and is now trading around $3320. The first support level is at $3230 (the 50% Fibonacci retracement of the latest daily wave), with the next support at $3055.
From a technical perspective on the weekly timeframe, the closing of a candle resembling an inverted hammer at the price top is a strong warning of further correction. On the daily timeframe, negative divergences in the RSI and the significant distance from the average price indicate that the market is in need of either a balancing phase or a correction.
Additionally, on the one-hour chart, gold is currently trading in a range between $3,270 and $3370. A breakout from this range, in either direction, could determine the trend for the coming week.
Gold Outlook
Despite technical signals pointing to a possible correction, the fundamental market environment remains tense. Ongoing US-China trade tensions, geopolitical conflicts, and economic uncertainty continue to support demand for safe-haven assets like gold.
Should trade tensions persist or negotiations fail, gold could once again move toward higher highs. Conversely, positive progress in talks or reduced political risks could trigger a deeper correction toward the identified support levels.
Traders should closely monitor news related to trade agreements and geopolitical developments via the Trendo trading platform in the upcoming week, and prioritize risk management in their decisions.
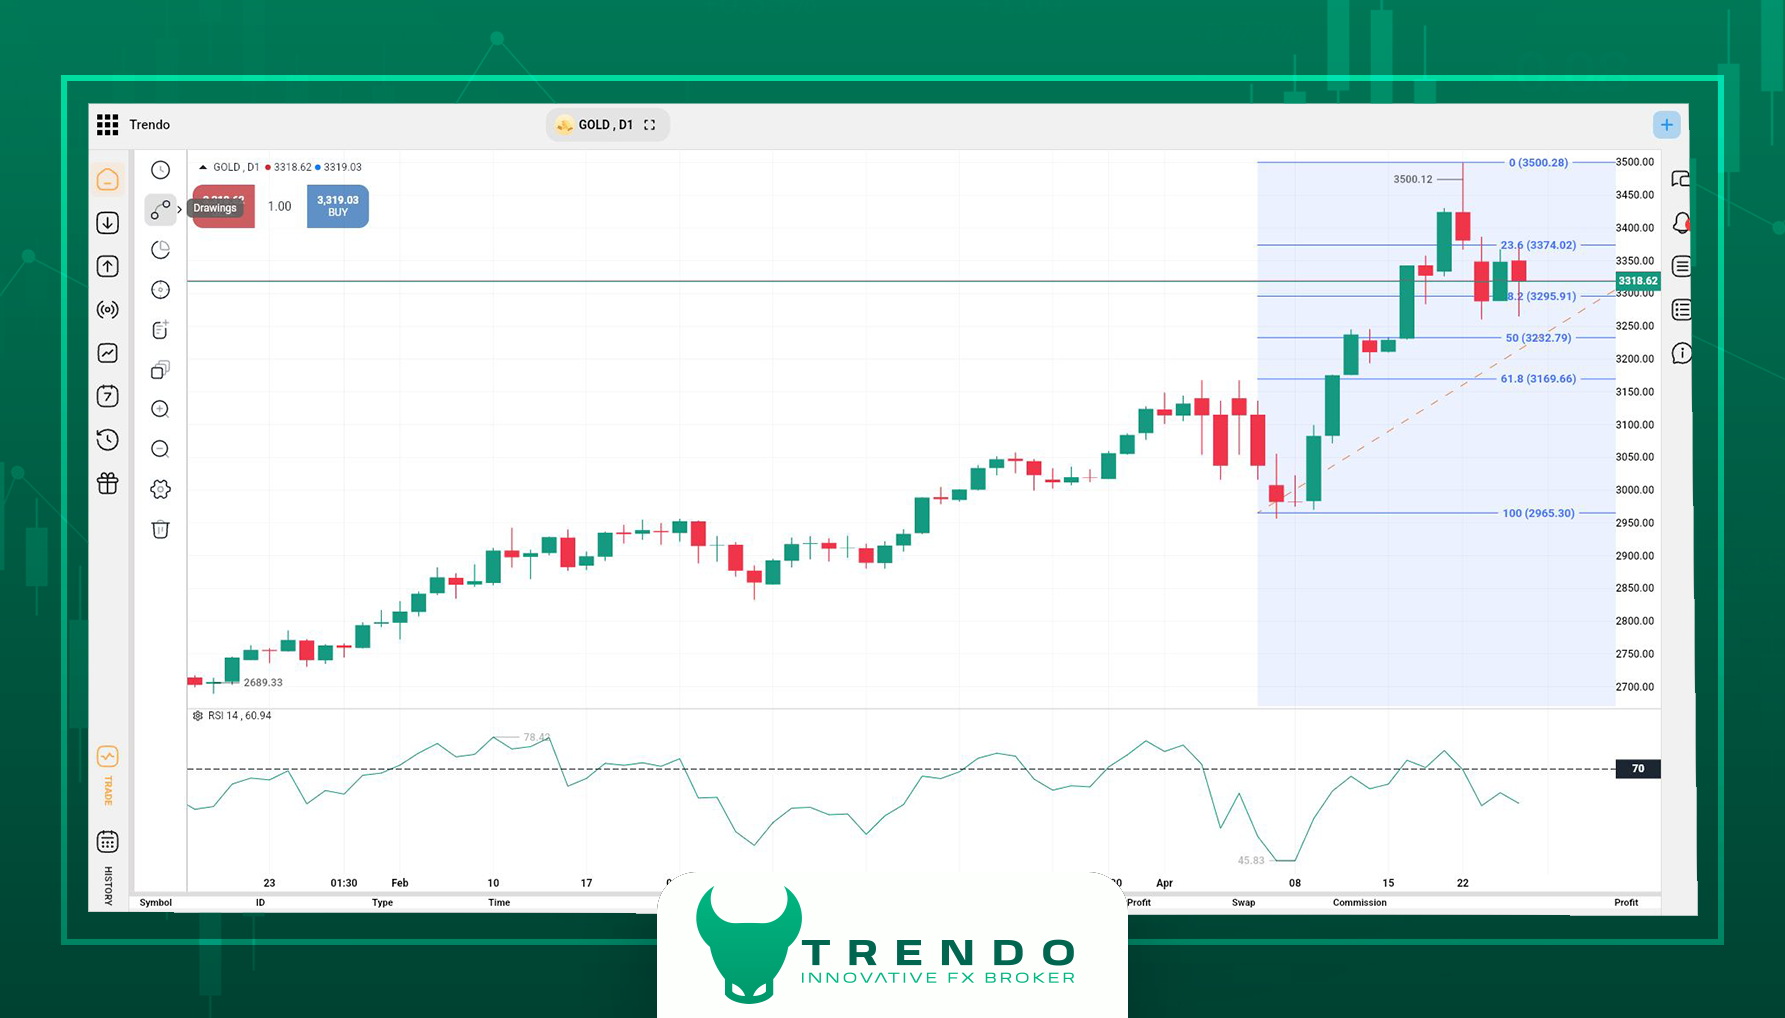
Technical and Fundamental Analysis of Gold in Trendo
Bitcoin Technical Analysis
Over the past week, Bitcoin broke out of weeks-long consolidation, surging to test two key resistance levels at $90,000 and $95,000. The price is currently hovering around $94,000, with the uptrend still showing signs of strength.
From a technical standpoint, the first major support is at $91,000, with a secondary support near $89,100. The recent rally has occurred without a significant pullback, increasing the likelihood of a short-term correction in the coming days.
On the four-hour timeframe, a negative divergence between price and the RSI indicator confirms that bullish momentum has weakened somewhat, suggesting a need for short-term consolidation or a pullback.
Bitcoin Outlook
From a fundamental perspective, the overall crypto market remains positive amid geopolitical uncertainties, tariff wars, and the potential weakening of the US dollar. The ongoing US-China trade disputes have increased the appeal of alternative assets like Bitcoin, serving as a key driver of the recent rally.
However, the continuation or halt of Bitcoin’s bullish trend depends on two key factors:
- The performance of US stock markets, which have recently shown positive correlation with cryptocurrencies.
- The progress of trade negotiations and related tariff news.
Traders should remain vigilant regarding key support levels and stay updated on global news via the Trendo trading platform. Conservative risk management and disciplined trading strategies are crucial at this stage.
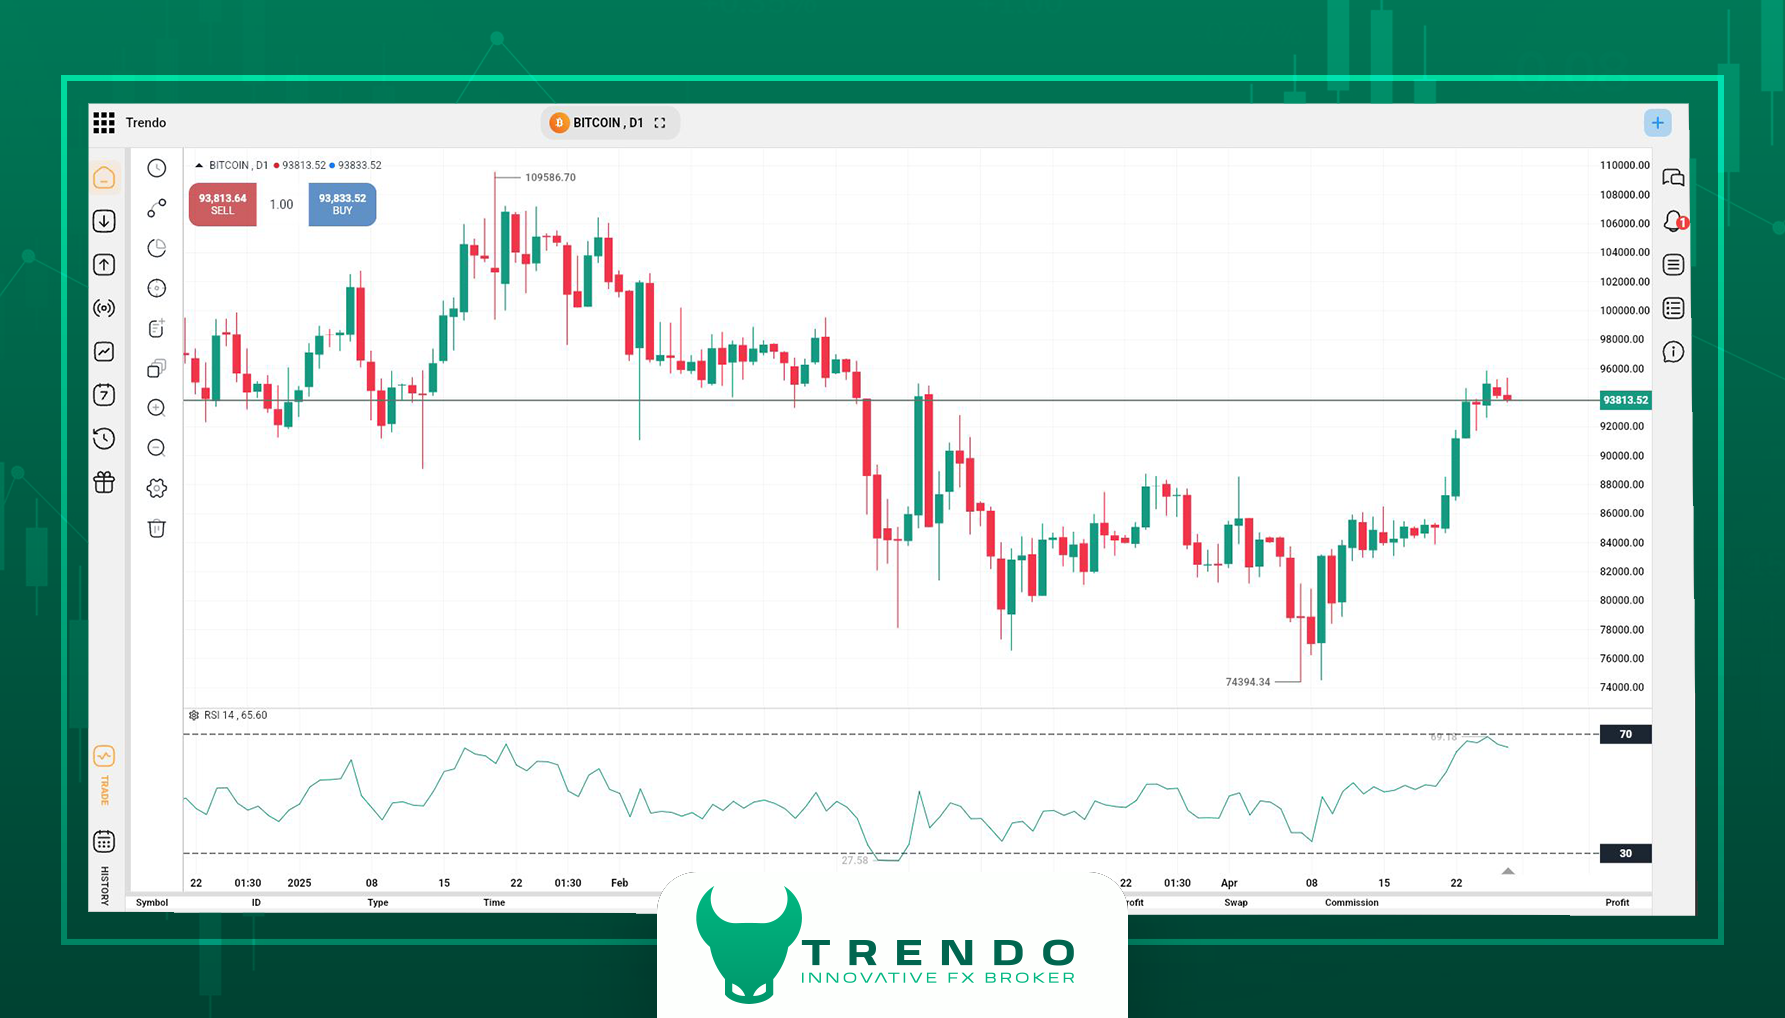
Comprehensive Bitcoin Analysis on Trendo
Relative Stability in Major Currency Pairs and Indices
This week’s analysis shows that major currency pairs like EUR/USD and GBP/USD, after recent rallies, have consolidated within last week’s price ranges with no significant trend changes. Likewise, major US stock indices such as the Dow Jones and Nasdaq, have also entered a consolidation phase following robust growth and continue to fluctuate near previous resistance levels.
This suggests that markets are adopting a cautious stance ahead of key economic data releases and political developments. Traders should continue to monitor fundamental data and updated news closely to be prepared for any sudden market shifts.
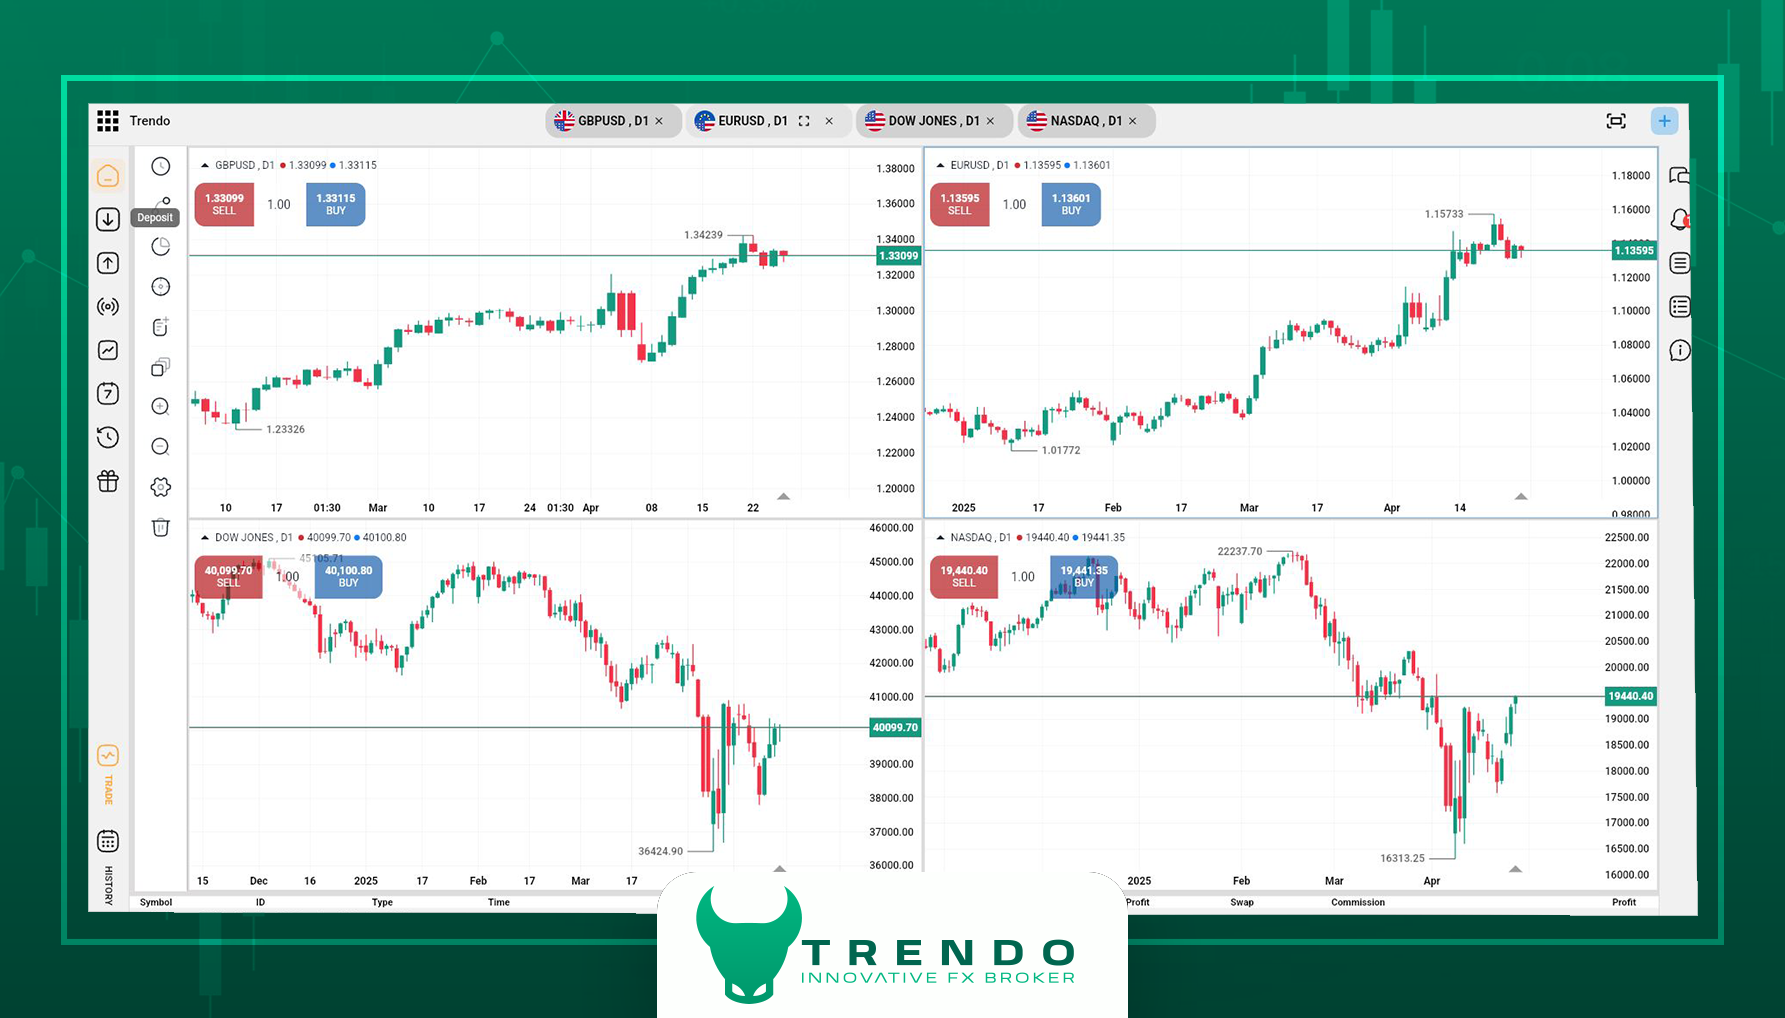
Analysis of Major Currency Pairs and Stock Indices
Conclusion and Final Recommendations in Weekly Trendo Analysis
The past week has been marked by significant volatility in gold and Bitcoin, while many currency pairs and stock indices remained within their previous ranges. With US-China tariff negotiations ongoing and global economic uncertainty persisting, expect that the upcoming week will also witness high-risk markets and unforeseen volatility. This situation underscores the importance of thorough analysis and effective risk management.
We recommend traders to closely follow economic and political developments and make trading decisions based on up-to-date analyses. For instant access to breaking news, expert analysis, and key market signals, be sure to use the Trendo trading platform and follow Trendo’s social media pages.
Forex Weekly Analysis - April 20, 2025
Over the past week, financial markets were swept up in a wave of political developments, central bank decisions, and fluctuating inflation expectations. Notably, the European Central Bank finally approved an interest rate cut—a move that the markets had already reacted to, which kept the EUR/USD reaction limited. This weekly Forex analysis aims to provide an in-depth look at the behavior of major assets such as gold, Bitcoin, currency pairs, and key indices, helping you gain a clearer outlook for the week ahead.
If you trade markets like gold, forex pairs such as EUR/USD and GBP/USD, or even cryptocurrencies, this weekly Forex analysis by Trendo will help you make more informed decisions by understanding both the fundamental backdrop and technical conditions. Keep up with Trendo as we explore all aspects of this turbulent week.
Fundamental Review in the Weekly Forex Analysis
The most significant factor influencing major currency pairs this week was the conflicting signals from global central banks and international political developments. U.S. Federal Reserve officials, including Mary Daly, emphasized that rate cuts are not yet on the agenda and that monetary policy remains data-dependent, even as markets have largely reacted to a rate cut for June.
In Europe, ECB member Villeroy’s remarks suggested easing inflationary pressures, opening the door for potential expansionary monetary policies in the coming months. Meanwhile, Canada’s pre-election climate has introduced new perspectives on tariff wars, which could impact USD/CAD. The Bank of Japan remains cautious, but if core inflation approaches the 2 % target, a rate hike will be considered—putting the spotlight on the USD/JPY pair.
Technical Market Analysis | Price Outlook in the Weekly Forex Analysis
In this section, we take a deeper technical look at key market assets. Gold is on an uninterrupted path toward new highs, Bitcoin has entered a consolidation phase, and major pairs like GBP/USD and USD/CAD are at critical price levels. A close examination of these levels can help traders make more informed decisions for the coming week.
Gold | Historic Highs, Investor Inflows, and Potential for a Pullback
In a volatile week, gold surged past previous highs, reaching—a level unprecedented in gold market history. With over 12% growth in just six trading days, high trading volumes, and significant investor inflows, gold has once again cemented its status as a safe haven. This rapid rally is directly tied to escalating economic and tariff tensions between the U.S. and China and a generally unstable geopolitical environment, which drove liquidity into gold markets last week.
At the same time, overbought signals by RSI across all timeframes—especially on the daily and 4-hour—suggest a possible short-term correction in the coming days. However, there are currently no signs of a trend reversal, and the main trajectory remains upward. The next psychological resistance is around 3400 $, while the first key support in the event of a pullback lies at 3220 $. Traders should proceed with caution at these critical levels and consider various scenarios, especially if political developments or potential trade agreements between China and the U.S. reduce gold demand.
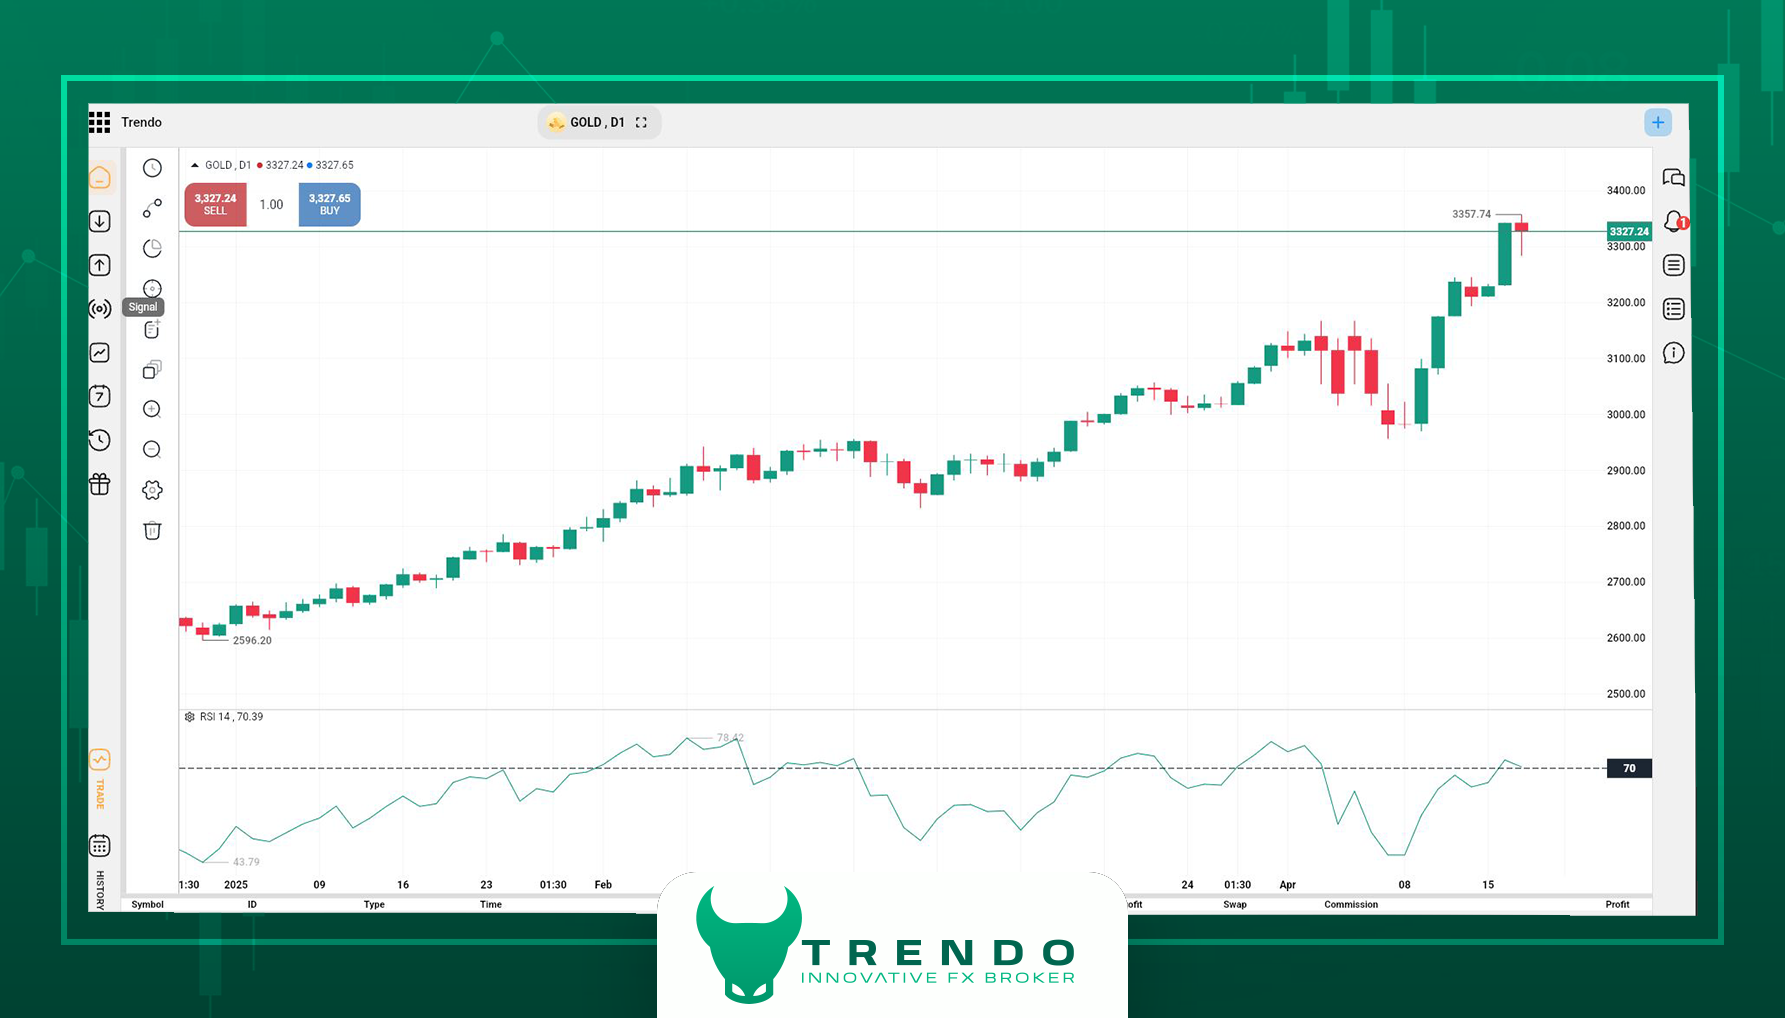
Weekly Analysis of Gold in Trendo
Bitcoin | Consolidation at a Turning Point
After a notable surge last week to 84,500 $, Bitcoin remained unchanged this week, trading within a tight range. The range phase is occurring near key resistance levels at 90,000 $ and 95,827 $ suggests a breakout could trigger a new wave of demand.
Currently, the crypto market is in a wait-and-see mode, and any changes in U.S. economic indicators or global risk sentiment could quickly shift liquidity toward or away from Bitcoin. This price range is a critical decision point for investors.
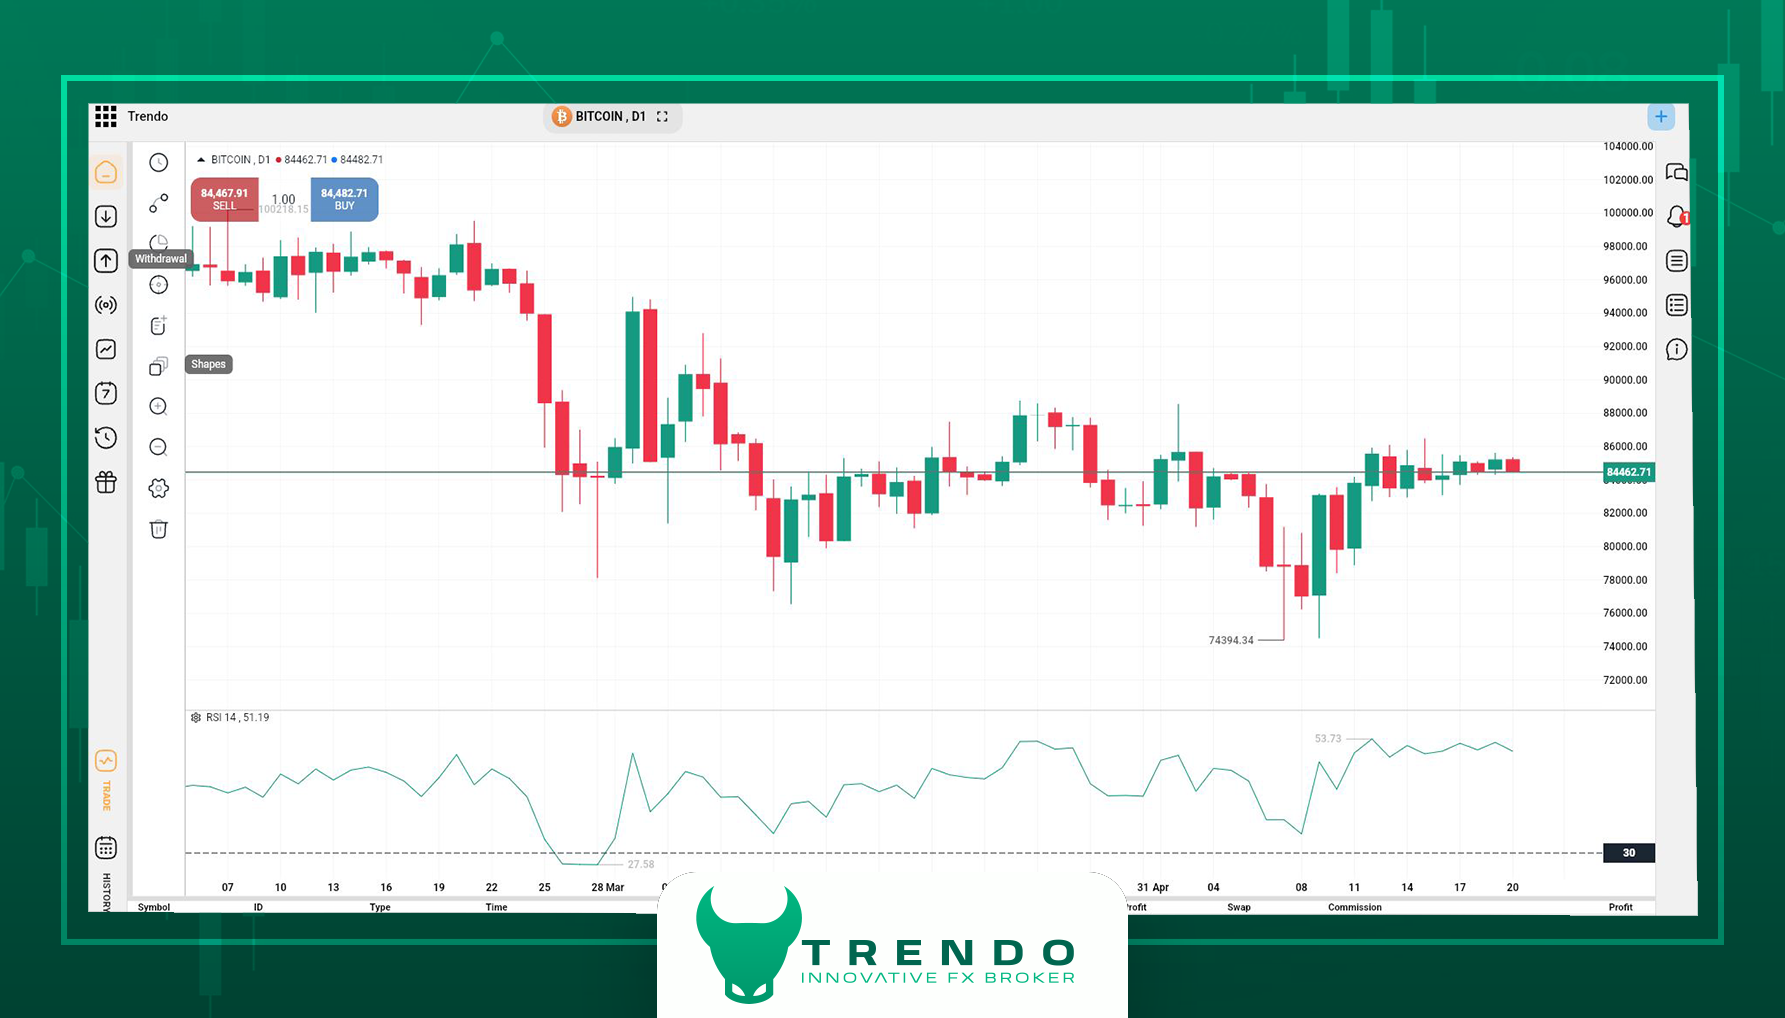
Technical Analysis of Bitcoin in Trendo
GBP/USD | Pound Faces Strong Resistance
Like the euro, GBP/USD has followed a steady uptrend, now testing a major resistance zone between 1.3300 and 1.3350. While the last ten daily candles have been bullish, slowing momentum and upper wicks on recent candles indicate hesitation.
Simultaneously, the RSI entering overbought territory increases the likelihood of a short-term correction. Still, the strength of the uptrend and the lack of a clear reversal signal mean traders should remain cautious.

Weekly Analysis of GBP/USD in Trendo
USD/CAD | Pausing at the Low, Awaiting Key Data
After a sharp drop last week, USD/CAD traded sideways this week, hovering near its lows. The pair remains under downward pressure, but the formation of tight candles and oversold daily RSI readings suggest sellers may be taking a breather.
Upcoming economic data and news from Canada and the U.S. could determine the next move for USD/CAD. If the Canadian dollar strengthens, the downward trend is likely to continue; otherwise, a limited rebound cannot be ruled out.
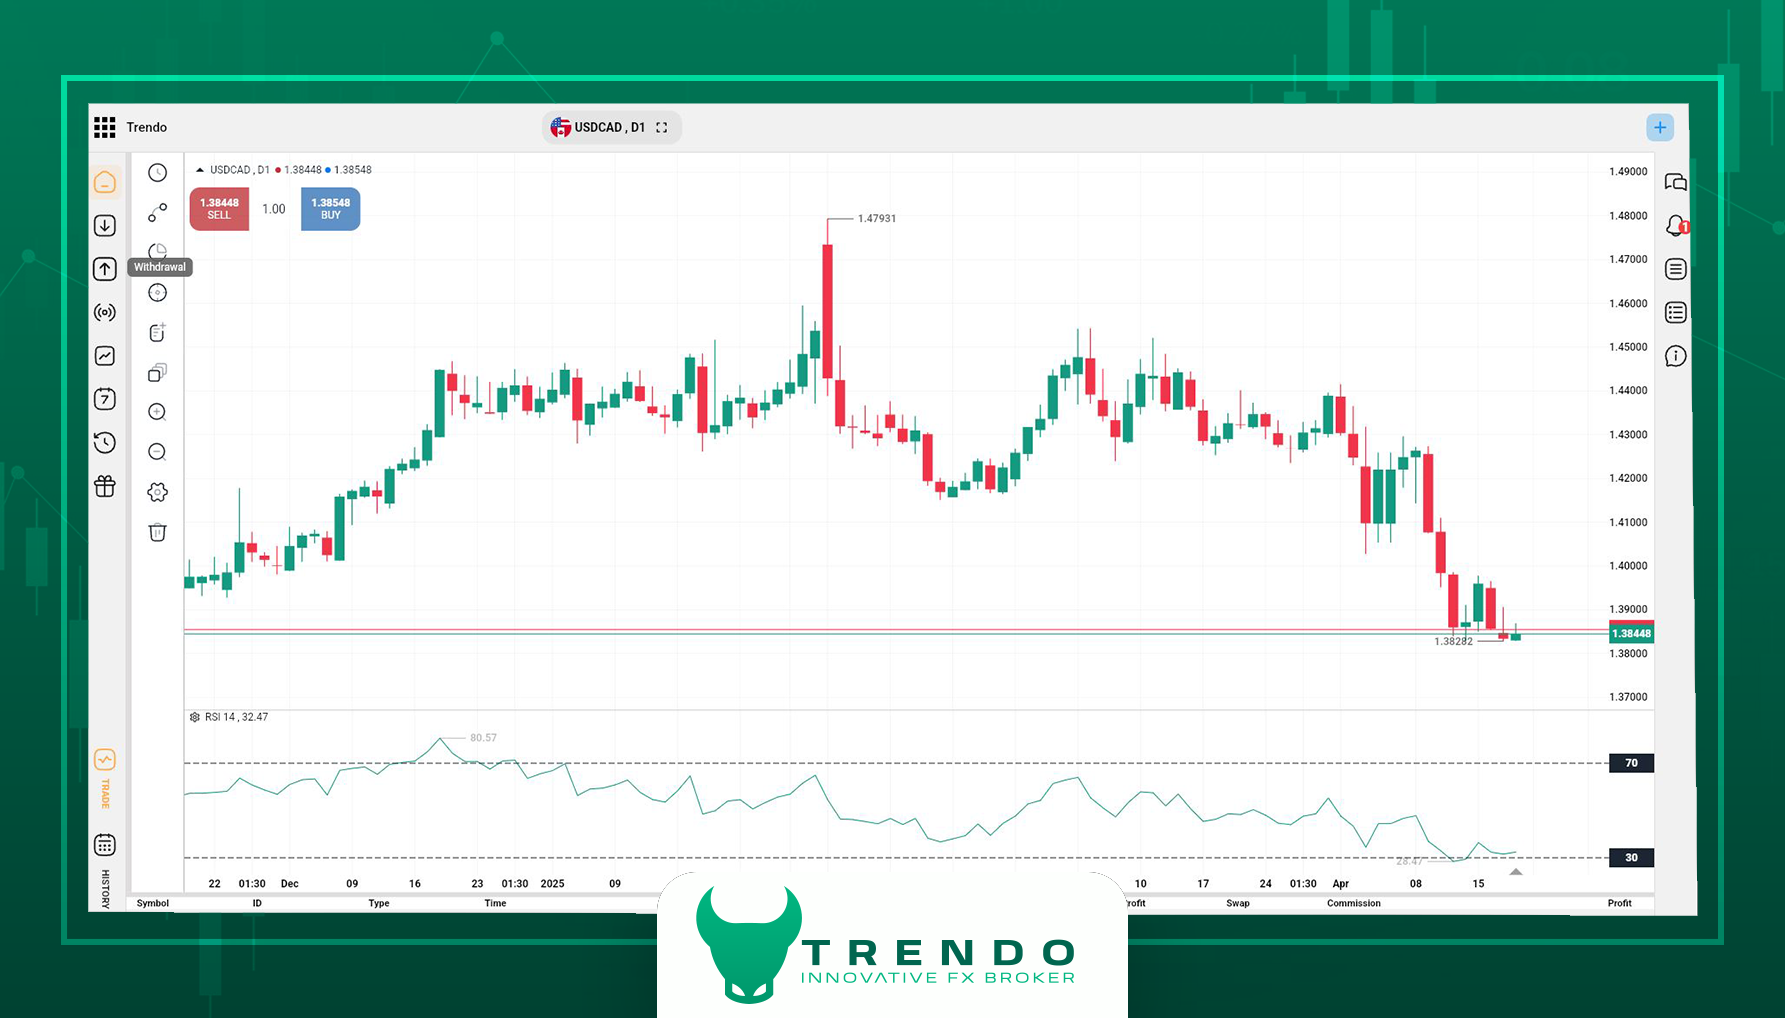
Technical Analysis of USD/CAD in Trendo
Final Takeaways from the Weekly Forex Analysis
Financial markets are heading into a week that could potentially alter the many assets’ trajectories. On one hand, possible trade agreements or easing tariff tensions between the U.S. and China could reduce pressure on gold and redirect capital toward riskier assets like Bitcoin or stocks. On the other, a series of crucial economic releases—including Canada’s interest rate decision and inflation data from the U.S. and Europe—will impact the trajectory of major currency pairs.
In such conditions, effective risk management and mastery of analytical and trading tools matter more than simply predicting trends. TheTrendo trading platform, with its live charts, economic calendar, daily analysis, and advanced trading tools, is a reliable partner for decision-making in volatile markets. For instant updates, supplementary analysis, and key signals, be sure to follow Trenddo’s Telegram channel and Instagram page.
Forex Weekly Analysis - Apr 13, 2025
In a report by the Trendo analytical team, this week must be regarded as one of the most unstable periods in recent global markets. It began with increasing the trade tensions between the U.S. and China, continued with key economic data releases, conflicting signals from the Federal Reserve, and significant fluctuations in major assets.
The sudden decision of president Trump to impose heavy tariffs on Chinese goods (up to 145 %) alongside a 90-day suspension for other countries plunged the markets into a phase of distrust. However, partial restoration of confidence following the announcement of potential negotiations temporarily changed the trend for some assets. U.S. inflation data (CPI and PPI), statements from Federal Reserve officials, and monetary policy decisions from Europe and Canada were also critical points of this week’s analysis.
Gold | Relentless Rise Toward Crisis
In the past week, gold broke through the key support level of 3000 $ and reached 2950 $. It then rebounded strongly, surpassing previous highs to reach 3245 $. This ascent was accompanied by three powerful bullish candles on the daily timeframe, indicating the market's current reluctance to undergo a deep correction. Despite the clear divergence between price and RSI indicator, which could signal potential corrections, buying pressure remains dominant, and the technical structure does not provide definitive signs of a trend reversal.
From a fundamental perspective, the high-risk environment stemming from the tariff war between the U.S. and China continues to support gold price. However, a political development regarding Trump's cancellation of tariffs on certain electronic imports might lead to a price gap on Monday. Gold is expected to open with a negative gap due to temporary easing of risk pressure, while the U.S. stock market is likely to start with a positive gap. Gold's price behavior on the first trading day will provide crucial signals about the continuation of its weekly trend.
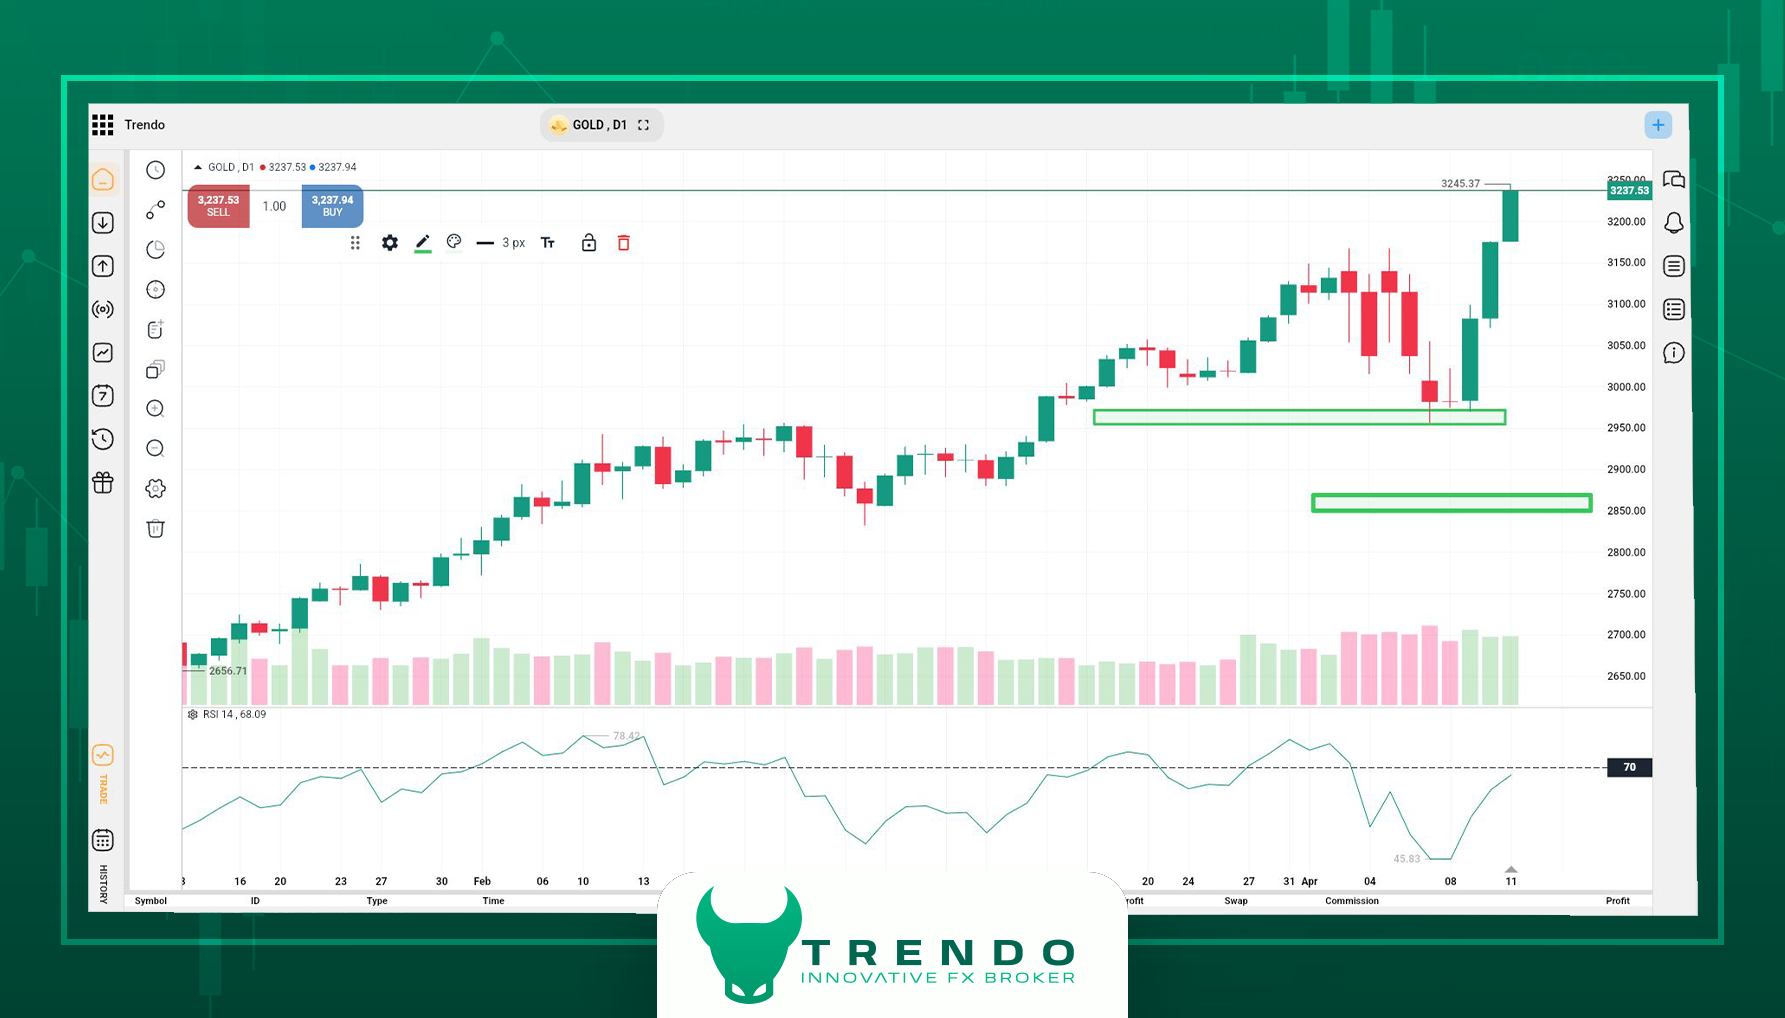
Weekly analysis of XAU/USD by Trendo
Bitcoin | Retesting Resistance Levels
At the beginning of last week, Bitcoin experienced a correction to around 74000 $, influenced by the tense environment from the tariff war. However, with Trump's temporary retreat from some tariffs and a relative return of risk appetite, the price quickly soared to 84500 $. The overall price trend on the daily timeframe remains bearish, but signs of seller weakness are visible, including stronger bullish candles, a slowdown in the downtrend, and formation of a liquidity zone behind the trend line, which increases the likelihood of a breakout.
Currently, the first resistance of the market is in the vicinity of 90000 $, and the next stands around 95827 $. If this structure is broken, Bitcoin might enter a new bullish phase. Given that cryptocurrencies trade 24/7, the market reacted to the tariff cancellations before the official opening of global exchanges, which can explain Bitcoin's recent rise. Nonetheless, to sustain the movement, it's crucial to observe how U.S. stocks and the dollar react to political developments in the early trading hours and whether investors continue to favor high-risk assets.
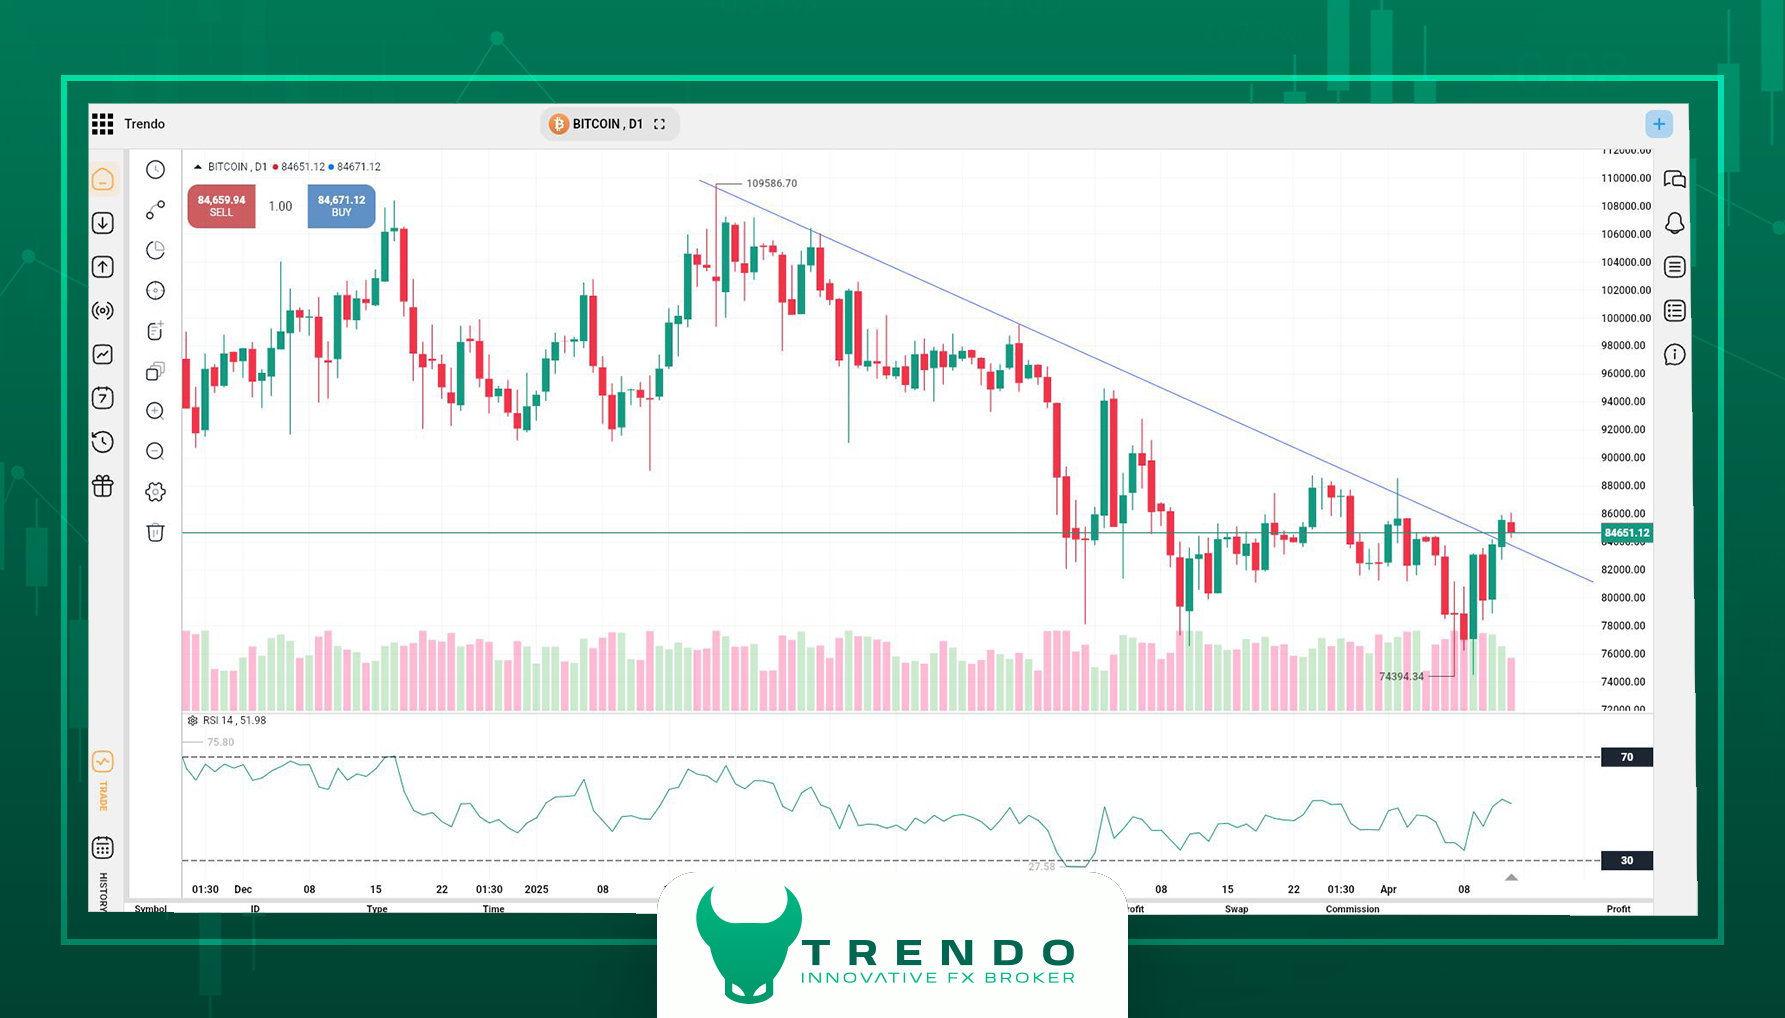
Technical Analysis of Bitcoin at Trendo Broker
EUR/USD | Crossing the 6-Month High with Strong Volume
The EUR/USD pair made a sharp and powerful move, breaking through its 6-month high and reaching the level of 1.14736. This rise occurred within just two daily candlesticks with heavy trading volume, clearly indicating strong liquidity flowing into the euro. Although divergence with RSI is observed in the four-hour timeframe, the strength of the trend suggests no serious signs of weakness or deep correction yet. The breakout of significant resistance, coupled with an accelerated candlestick pattern, indicates the market is likely seeking higher prices unless major data contradicts this trend.
From a fundamental perspective, increased trade tensions between the European Union and the United States over tariffs, combined with the temporary suspension of retaliatory actions by Europe, have created a cautious yet hopeful environment. Trump reduced tariffs for many countries but has not taken a clear stance on Europe, which could pressure the euro if negotiations fail. The European Central Bank maintained interest rates unchanged in its recent meeting, emphasizing the need for monetary policy stability against external shocks. In this context, the EUR/USD trend in the coming days will heavily depend on trade negotiation outcomes and upcoming economic data.
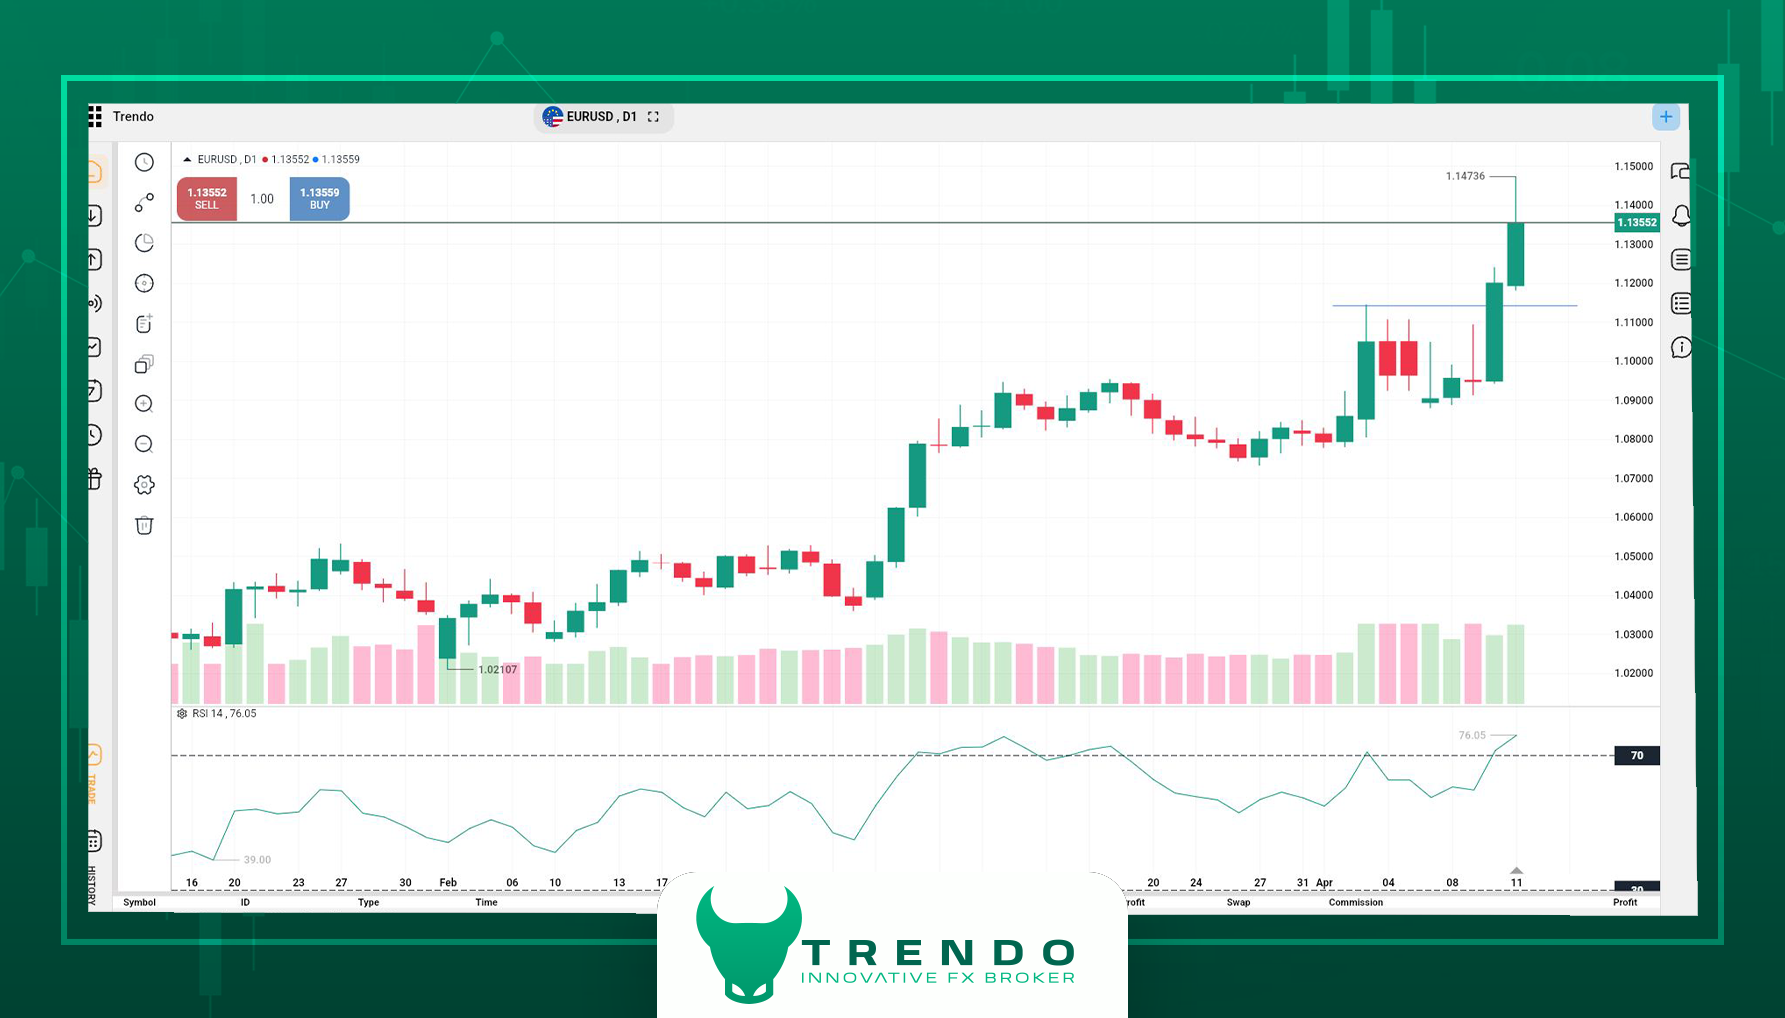
Weekly Technical analysis of EUR/USD on Trendo
USD/CAD | Intense Selling Pressure Ahead of Key Data
The USD/CAD pair has entered a strong corrective phase, marked by three consecutive bearish Marubozu candles. RSI on the daily timeframe reached the oversold territory. Traders are now awaiting the release of Canada's central bank interest rate and CPI inflation data, which could determine the pair's future direction.
It is recommended to manage positions carefully during data releases and using professional tools at Trendo trading platform.
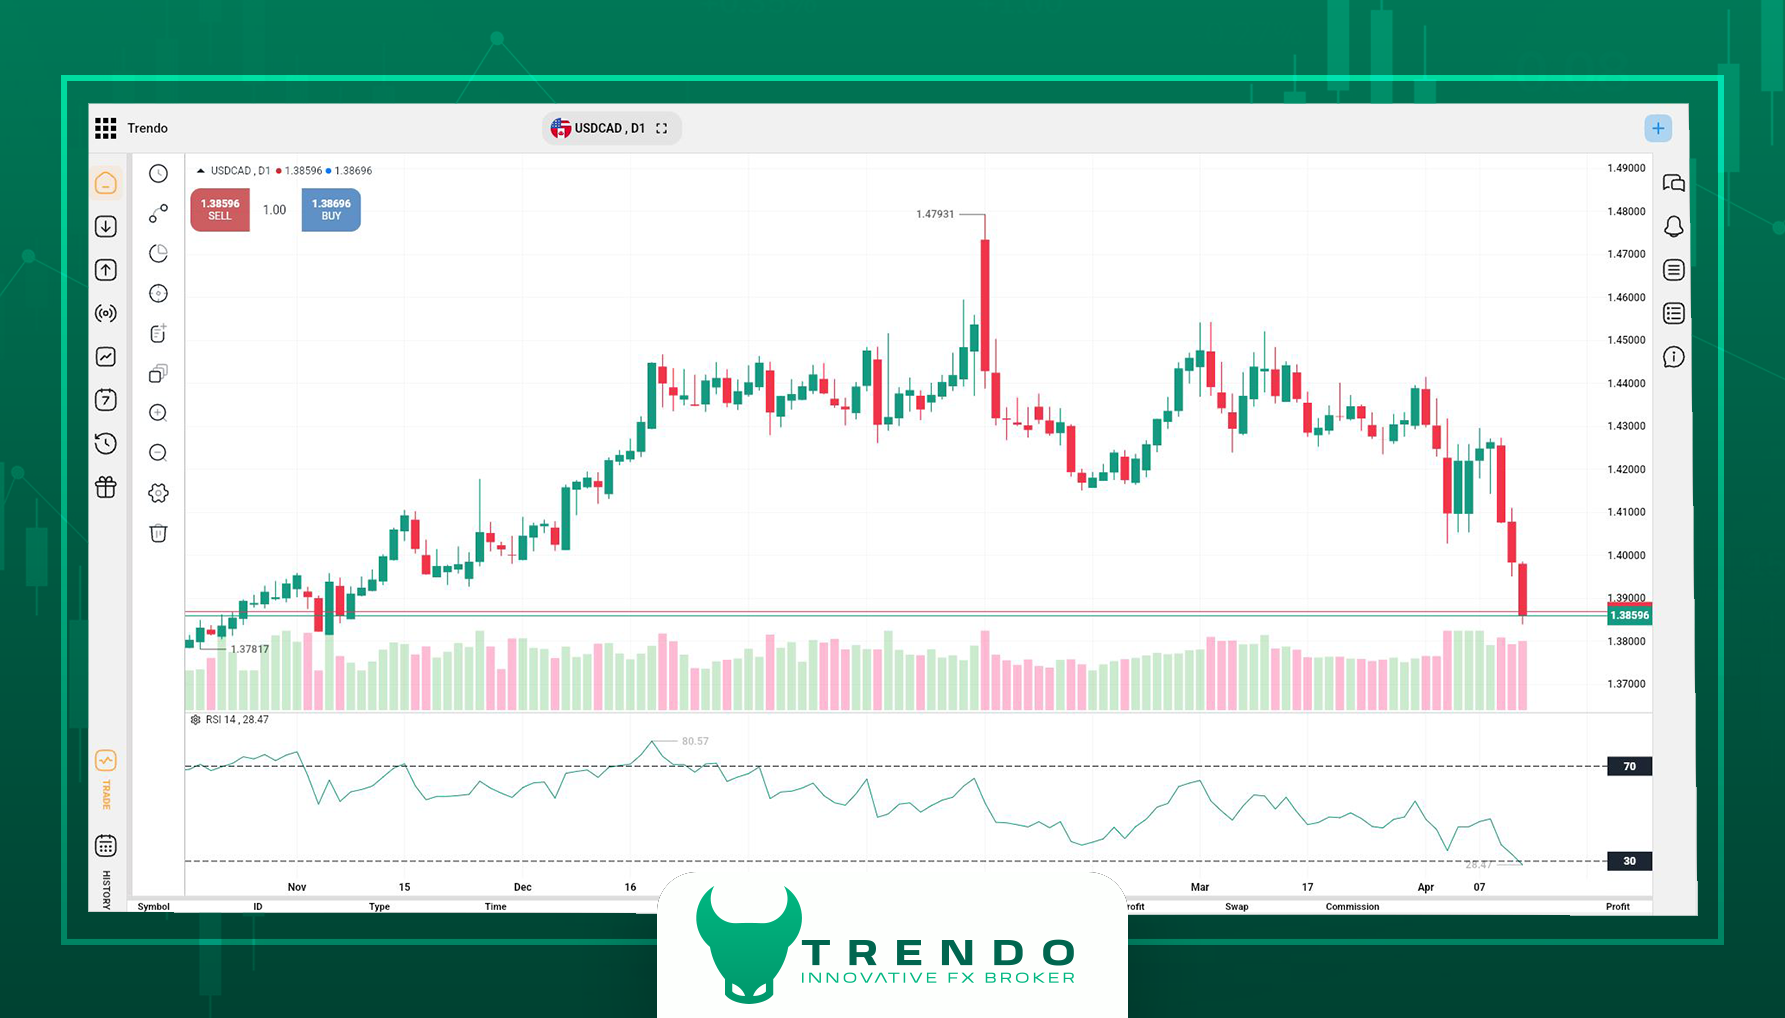
Weekly Technical Analysis of USD/CAD on the Trendo Trading Platform
Summary
Currently, markets are at the intersection of three major axes:
1. The Tariff war between the United States and China escalation that has widespread implications for the global supply chain.
2. Key economic data, including Europe’s interest rates, U.S. inflation figures, and upcoming monetary policy decisions by Canada’s central bank.
3. Contradictory political signals from Trump, China, and the European Union which have deepened market ambiguity.
In such an environment, every price fluctuation could signal deeper shifts in market behavior. Professional traders should combine technical and fundamental analysis while closely monitoring news to navigate these dynamics effectively.
The Trendo analysis team, by providing up-to-date insights and advanced trading tools, supports you for precise risk management and smart decision-making amid market volatility. During this trading week, it is advisable to take full advantage of market fluctuations and consider capital management in your trades using the Trendo trading platform, which integrates an economic calendar and price charts.
Forex Weekly Analysis - Apr 6, 2025
Global financial markets have entered a tense week. The announcement of new tariffs by Trump and China's reciprocal response have intensified the risk-averse environment in the markets. US stock indices experienced a significant drop, and risky assets’ value sharply decreased. The cautious remarks of Jerome Powell, the Chairman of the Federal Reserve, also indicate politicians’ concerns about the effects of this trade war on economic growth and inflation.
Meanwhile, Bitcoin has shown a moderate reaction compared to the stock market, where some analysts believe this asset is separating its path from traditional markets. In such circumstances, a precise analysis of market behavior and a simultaneous understanding of technical and fundamental factors are more essential than ever for making smart decisions. In the following, we will examine the performance of key assets including Gold, AUD/USD, Bitcoin, and the NASDAQ index.
Gold Analysis (XAU/USD); Is the Uptrend on the Verge of Stopping?
Gold, after a powerful rise to the 3168 $ range, has entered a volatility phase. This growth was influenced by the intensification of the global risk-averse environment and Trump's tariff policies, which increased demand for safe assets. However, technical analysis data show signs of weakness in the continuation of the upward trend.
In the daily timeframe, the first support level located between 3000 $ and 3030 $, which has so far prevented further decline. By surpassing this area, the next range is 2950 $ which will act as the next key support. Overall, gold is located in a sensitive range. The continuation or halt of the trend depends on the price's reaction to the support levels as well as news relevant to the trade war and Federal Reserve policies.
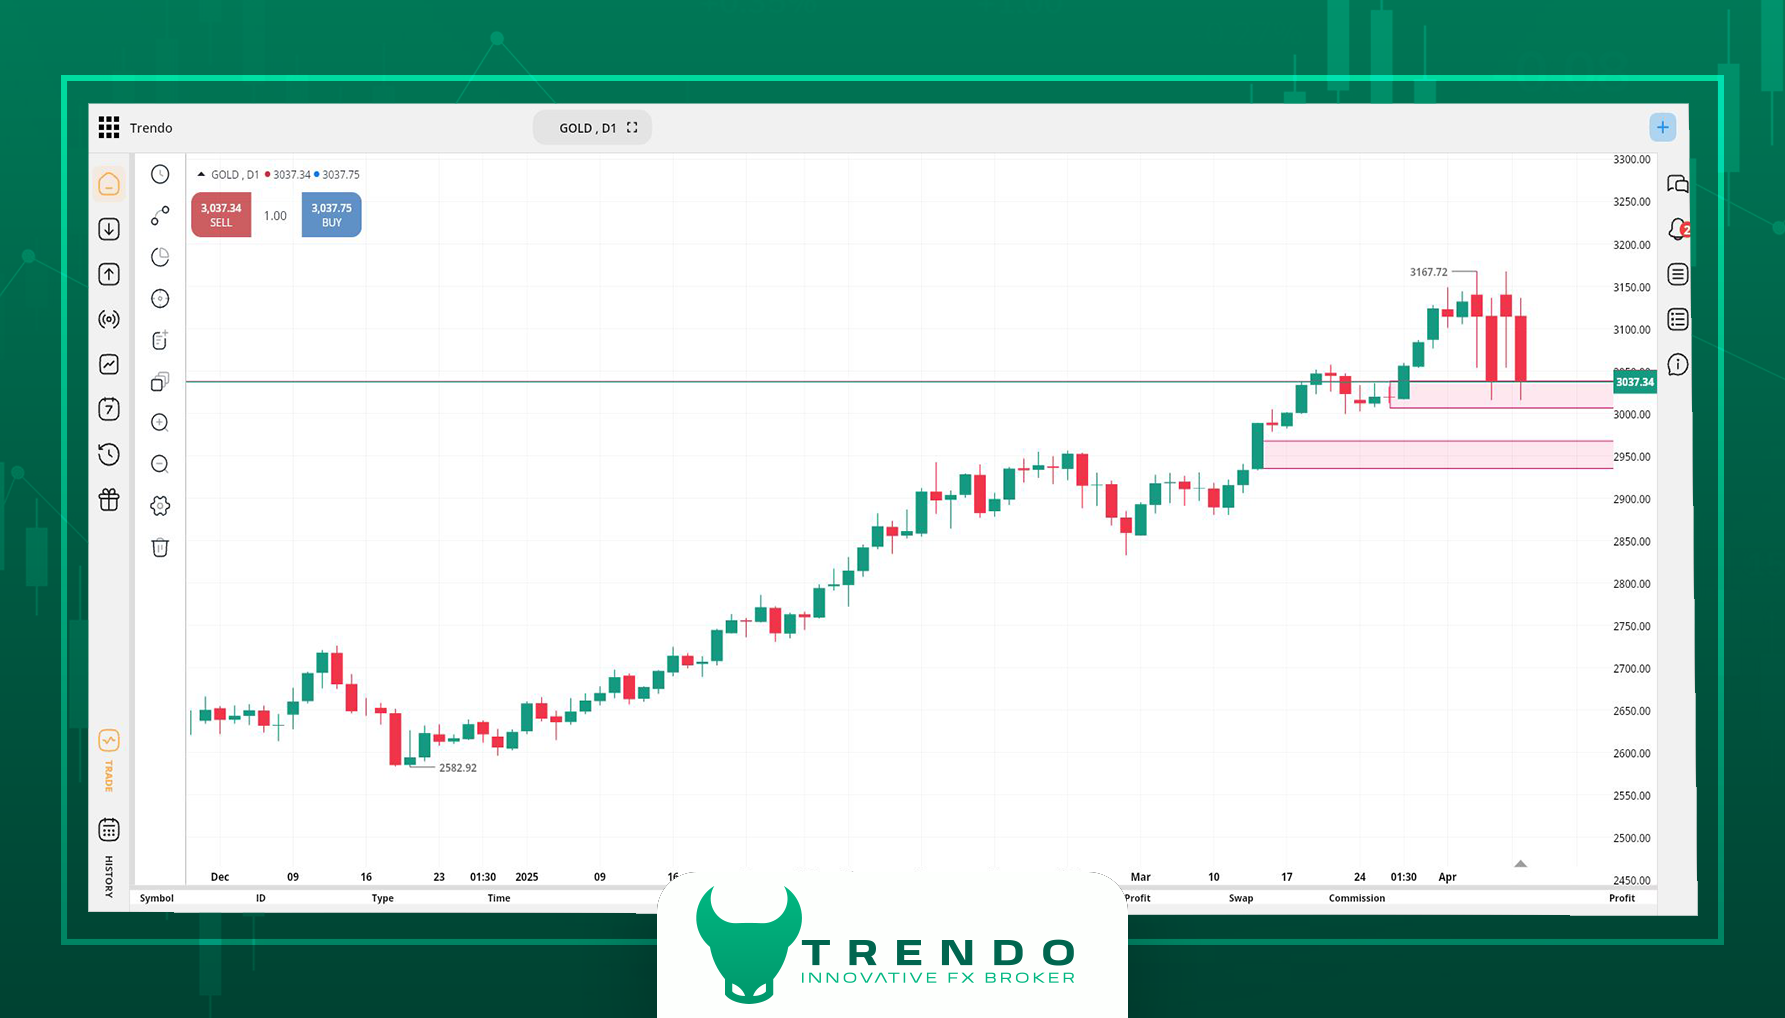
Analysis of AUD/USD; Sharp Drop and Convergence in a Critical Range
Following the imposition of heavy tariffs by the United States and the swift market reactions, the Australian dollar has been one of the most vulnerable currencies to trade shocks. The AUD/USD currency pair has recorded a strong bearish candle on the weekly timeframe, which is unprecedented in terms of trading volume among the recent candles.
Currently, the price has reached the important support range of 0.5935 to 0.6050. If the market does not react to this area positively, the next support around 0.5700 could be the next destination for sellers. Due to the significant dependence of Australia on trade with China, the intensification of tariff war between Beijing and Washington could put additional pressure on the Australian dollar. On the other hand, the market's reaction to political issues and economic data during this week will determine whether this downward trend will continue or not.
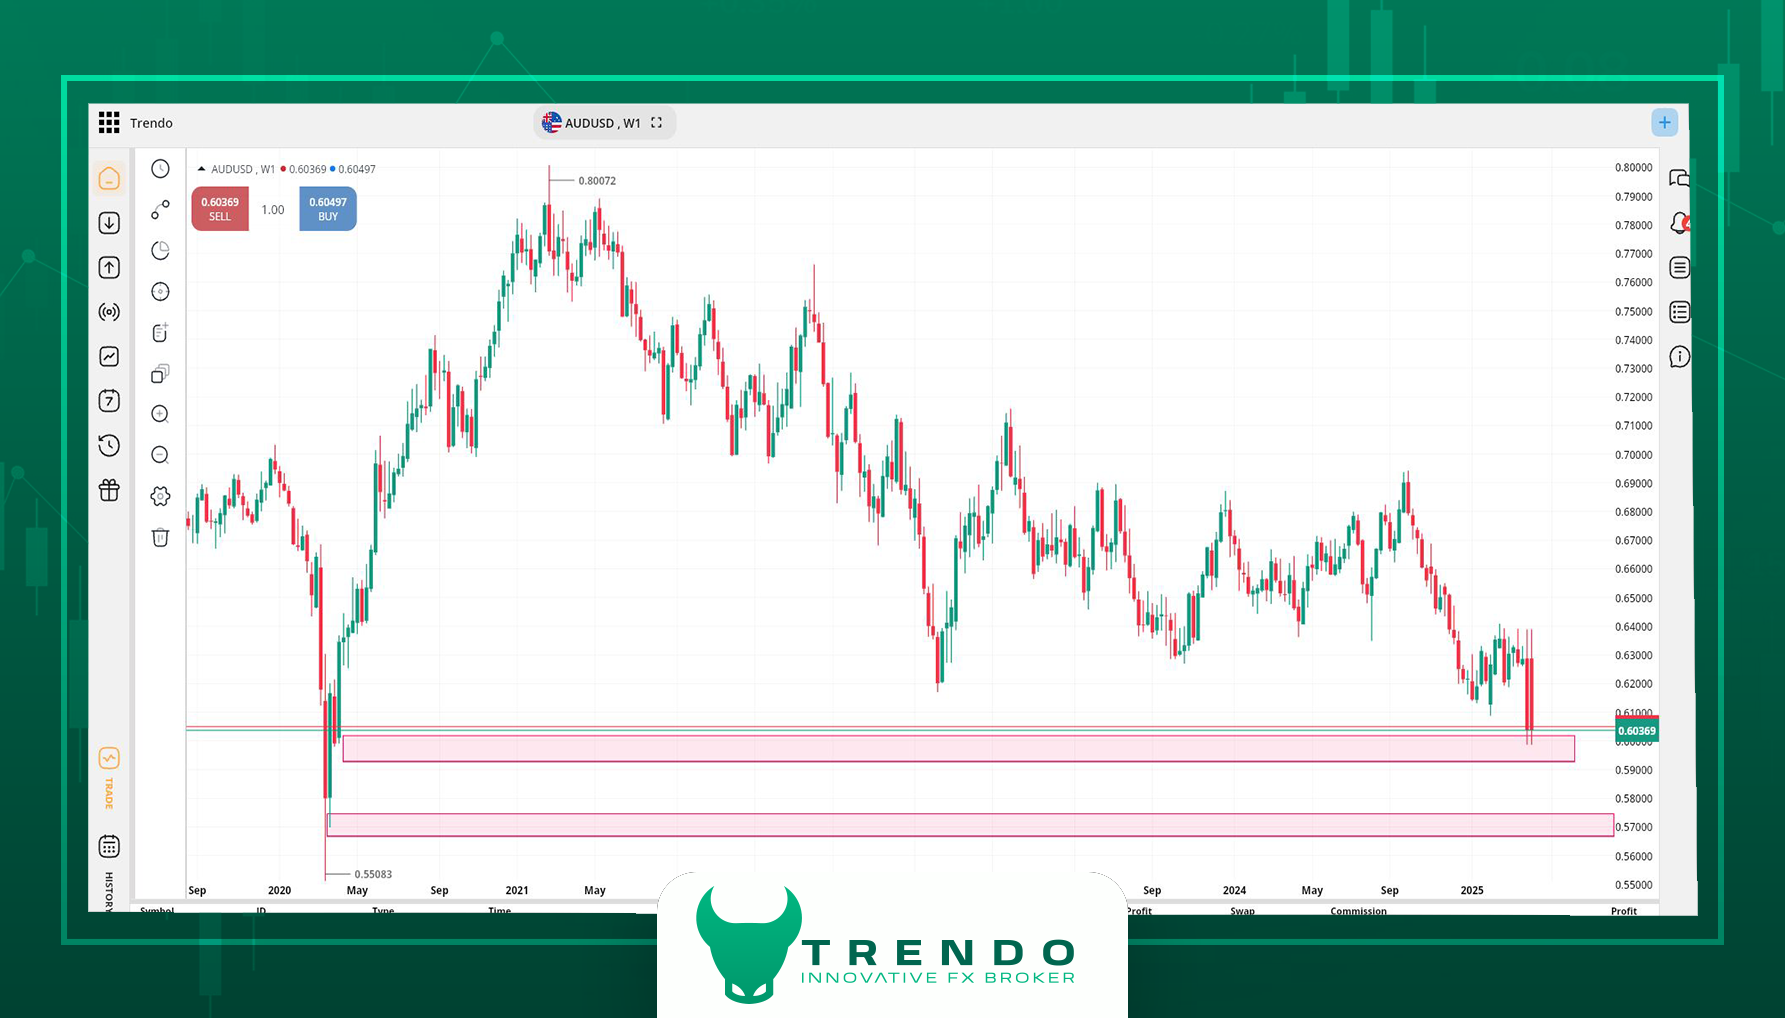
Bitcoin (BTC/USD) Analysis: Waiting for the Next Move
Bitcoin is fluctuating within the 82,000 $ range, while it has failed to compensate for its drop from ATH (All time high), over the past four weeks. This stagnation at the peak price could be a sign of buyer weakness and the possibility of further correction.
In the weekly timeframe, the first support zone is in the range of 70,000 $ to 72,000 $; a place where the price might react and Bitcoin takes a new path.
The interesting point in the current situation is that, contrary to the heavy fall of the U.S. stock market, Bitcoin has shown a limited reaction. This behavioral divergence could be a sign of divergence beginning between the crypto market and traditional assets.
Given the sensitivity of the global economic environment, Bitcoin's reaction in the coming days is of great importance and can determine investors' stance against systemic risks.
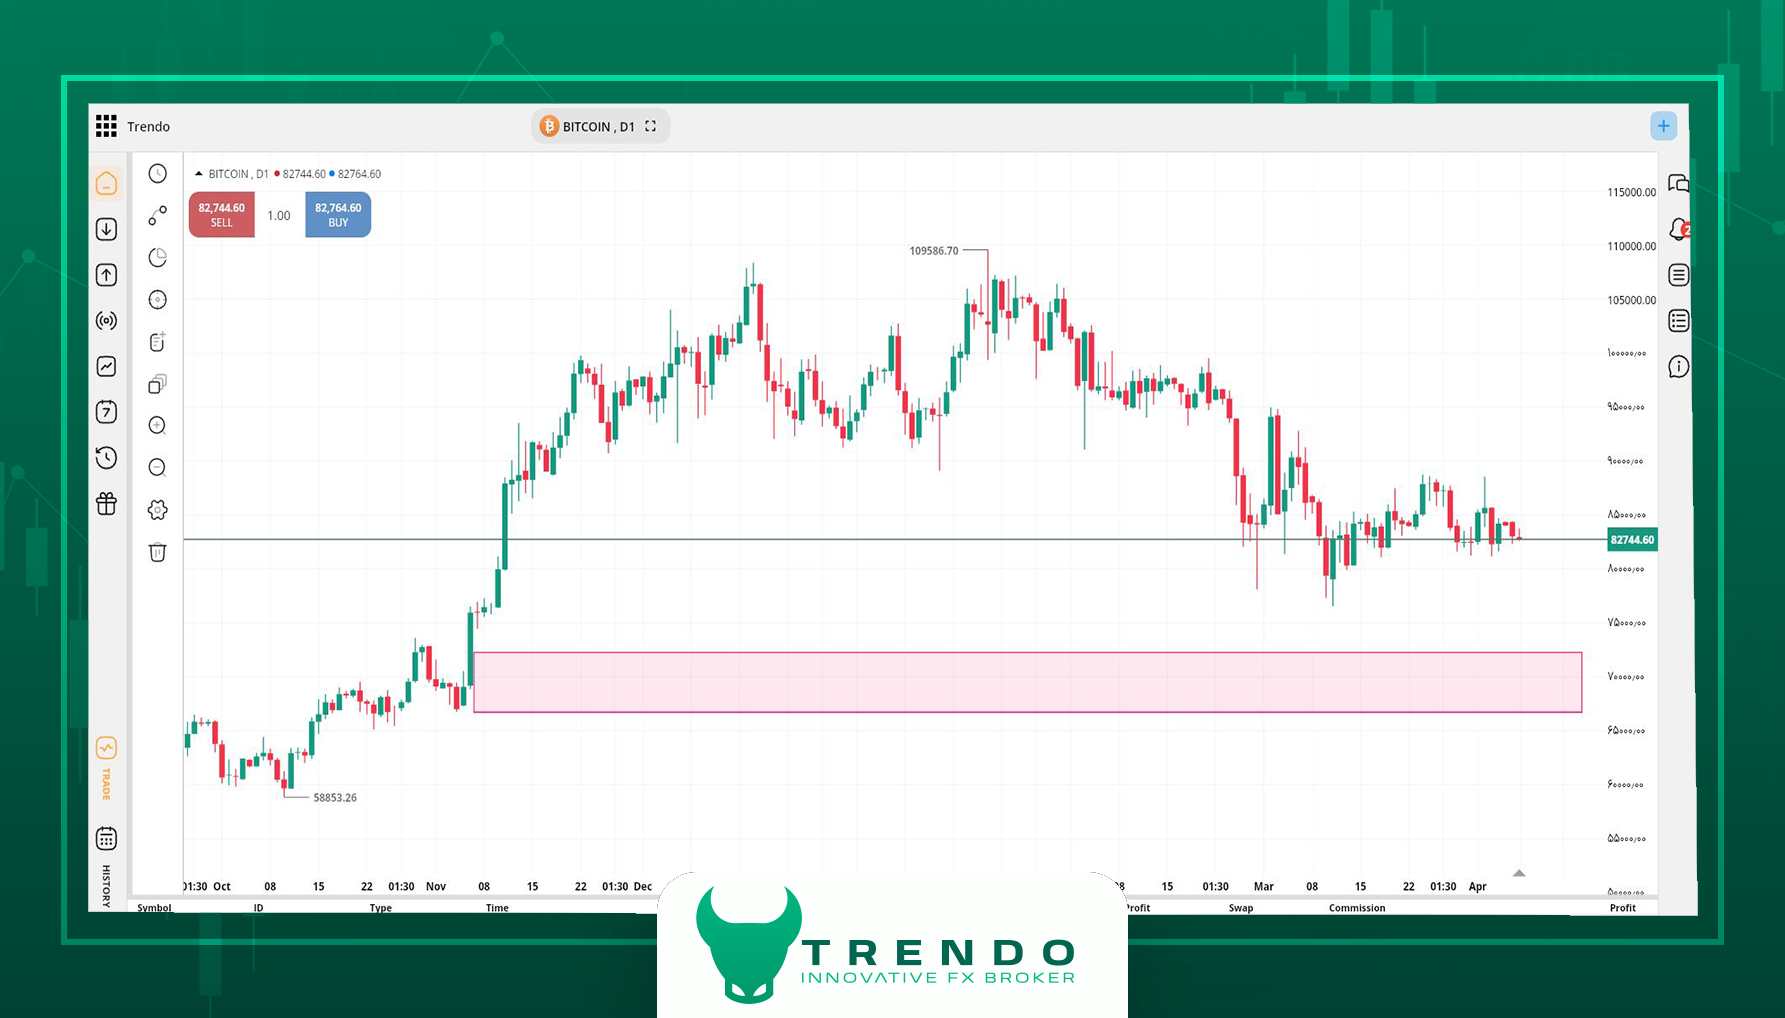
Analysis of the NASDAQ Index; Sharp Drop in an Ambiguous Environment
The NASDAQ index experienced one of its heaviest recent declines last week, with a drop of more than 13%. The weekly candle, with strong momentum and a substantial body, indicates a significant wave of capital leaving the American stock market. This decline may relate to the trade war intensification and increase in reciprocal tariffs between the United States and China.
In the weekly timeframe, the RSI indicator has entered the oversold zone and has dropped below 30; a situation that is usually accompanied by an increased likelihood of a price reaction in support areas. The first support range is between 16162 and 16747. If it breaks, the next key area is between 14900 and 14500.
The overall condition of the U.S. stock market is under severe pressure from inflation expectations and distrust in future policymaking. In such conditions, the reaction of NASDAQ to the current support zone could play a decisive role in the scenarios of the coming weeks.
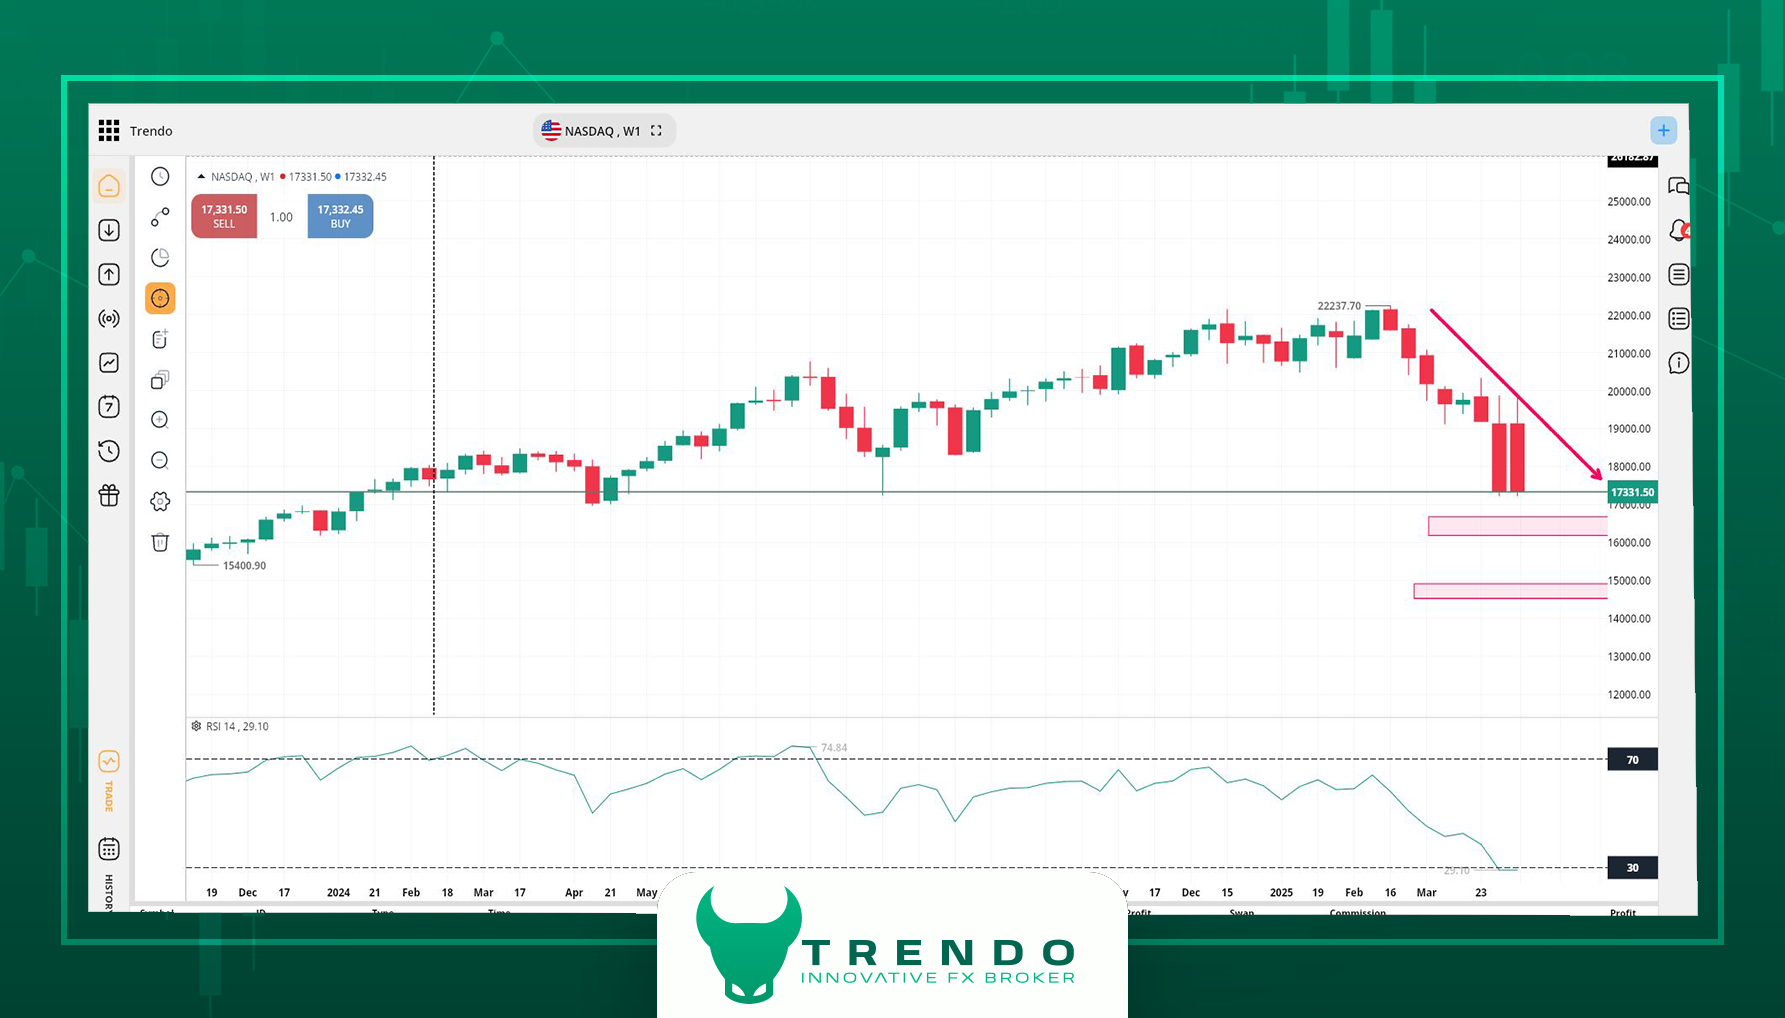
Summary: Markets at the intersection of political risks and inflation data
Global financial markets are starting the new week in a state of uncertainty. On one hand, Trump's tariff has delivered a serious shock to stocks, currencies, and commodities. On the other hand, the release of the U.S. The Consumer Price Index (CPI) this week could design a new path for assets, which will have a direct impact on inflation expectations and future Federal Reserve.
Meanwhile, countries' reactions to U.S. tariffs are taking shape. China has officially announced its response, but should be patient to see Europe and other major economies' reactions and how they will handle the situation. Elon Musk, as one of the influential figures in the U.S. economy, has also expressed his opposition to the tariffs and suggested that the U.S. and Europe should reach a bilateral agreement to eliminate tariffs. Taking this move could significantly alter political and economic equations.
In such an environment, traders need to pay more attention than ever to data, technical trends, and real-time news. The Trendo trading platform is equipped with tools like economic calendar and up-to-date analyses, which helps you make more informed decisions amidst the fluctuations. In the week ahead, flexibility, risk management, and readiness for quick reactions will be the keys to your success.
Related Post


Bitcoin Analysis (Will Bitcoin Break Through Weekly Resistance)
Technical, Fundamental, and Sentimental analysis of Bitcoin in Forex
most visited

")


 in Forex & How to Use it in Trading?")