2023-02-15 20:45
Technical analysis in forex and types of technical analysis


Technical analysis is one of the financial market analysis methods that analysts and traders use to determine the future of asset prices. Technical analysis is a general term that consists of various strategies. In all these strategies, analysts predict the price's future path based on the past price and price chart with technical tools. In this analysis, which has a long history, traders only use the price chart and its past behavior. They analyze the currency pair or asset and predict its future price.
Technical analysis in forex
If you ask traders in the Forex market, the largest financial market in the world, about the type of analysis they use for trading, most of them will mention technical analysis. Therefore, considering that most traders in the forex market use technical analysis for their trading purposes, this analysis is reliable in the forex market. Technical analysis cannot predict the future of prices with certainty, but since most traders use this analysis, the probability of its success is high.
Technical analysis is comprehensive because it only uses the forex market's currency pairs or other asset’s past price behavior and the chart. Technicalists believe that the price chart has the necessary tools and data to predict the price path in the future. Based on their trading strategy, traders and technical analysts analyze technical tools, charts, and the forex market's currency pairs and symbols' past and determine its price path in the future.
Technical analysis has three main principles: "Market action discounts everything" "prices move in trends" and "history repeats itself" all three of which we can see in the price chart.
- Market action discounts everything means that in some cases, despite the emphasis of fundamental analysis on the price's rise or fall, the chart and price act against them and follow the technical analysis rules.
- Prices move in trends, which expresses the concept that the price has the desire to maintain its previous trend, and if it wants to change direction, this change will not be sudden, the possibility of price direction change can be predicted gradually and through technical tools in the chart.
- The principle of "history repeats itself" is based on the belief that the situation that happened in the past can repeat itself. Meaning, if a commodity's price or stock has reached a certain level in the past and has gone down or up again from there, it is likely that the price will change again when it reaches that point again.
These three principles are the basis and generality of technical analysis, which has led to the creation of different methods and types of technical analysis. The technical analysis turns into different strategies according to the tools used to analyze the chart.
Paying attention to the following points about technical analysis is necessary.
- The chart is the main element of technical analysis and indicators, chart patterns and trading systems are the tools applied to charts.
- Technical analysts believe that even the fundamental data in the forex market charts are predictable with technical tools, and they are not attentive to the fundamental analysis.
- As for a better result in fundamental analysis, basic training in technical analysis is necessary for better performance and more success chances. One can combine basic fundamental analysis with technical analysis. Click here to learn about fundamental analysis.
- The difference between the fundamental and technical approaches lies in the first principle. In case the traders do not act emotionally and the surrounding environment is consistent and similar, fundamental analysis will always perform correctly.
Types of technical analysis in forex
Technical analysis has a long history. Therefore, many people have been analyzing price charts in the past and are trying to make a connection between the price chart and its prediction in the future by using their analytical tools. Based on this, various technical analysis methods have been created over time. The methods predict the price's future by analyzing the chart and the past price and using tools such as mathematics, Fibonacci, geometry, price behavior (price action), etc. Further, we will introduce the most important technical analysis methods.
Classic technical analysis
In classic technical analysis, analysts use straight and diagonal lines and curves to analyze the forex market's currency pairs and assets' price chart. With the lines' assistance in this method, the price's support and resistance levels and its upward and downward trend (trend line) are determined. Therefore, the basis of traders' buy and sell trading in classic technical analysis is the resistance and support levels.
The price pattern in technical analysis
In technical analysis, it is possible to discuss the future price of assets using geometric forms of mathematics, which are called price patterns. When the price patterns confirm the ascend or descend trend's continuance, it is called a trend continuation pattern (like a triangle or a flag), but when these patterns indicate a warning for the price to return and turn the ascending trend into a descending trend or vice versa, they are called reversal patterns (like head and shoulders).
Price action
Price action is one of the most popular and simplest technical analysis methods that have many supporters. The price action's basis in the forex market is supply and demand. In price action, with the data in the chart and the past price, the currency pair or asset's supply and demand areas are determined, which are called resistance and support levels. Traders whose analysis method is price action use their trading strategy and the resistance and support levels to trade and earn profit.
To learn price action, you can use different methods, and there are many educational books and courses available online. The most important price action methods are as follows.
• Chart patterns
• Lance Beggs price action analysis strategy
• Niall Fuller price action analysis strategy
• Supply and demand price action strategy
• Alfonso Moreno price action strategy
• Sam Seiden price action strategy
• RTM Price action
• ICT price action
• Richard Wyckoff price action
• Al Brooks price action
• Smart Money price action
Users should note that learning all the above methods is time-consuming and difficult, and learning all the strategies are not required. Learning one or two price action strategies for trading in forex is enough for users to trade in this method, and they can make efficient analyses.
Fibonacci numbers and harmonic patterns
Fibonacci numbers are one of the most used topics in the world as the creation structure and technical analysis. These numbers are known as Fibonacci levels. Fibonacci numbers are used in technical analysis to find support and resistance levels.
Fibonacci numbers are used widely in harmonic patterns. Harmonic patterns are price patterns with a specific geometric shape, and the basis of these patterns is Fibonacci numbers. With practice, and based on that, you can find price patterns in the chart and predict the price's future direction. AB=CD pattern, Gartley pattern, and Butterfly pattern are the most important of these patterns.
Elliott waves
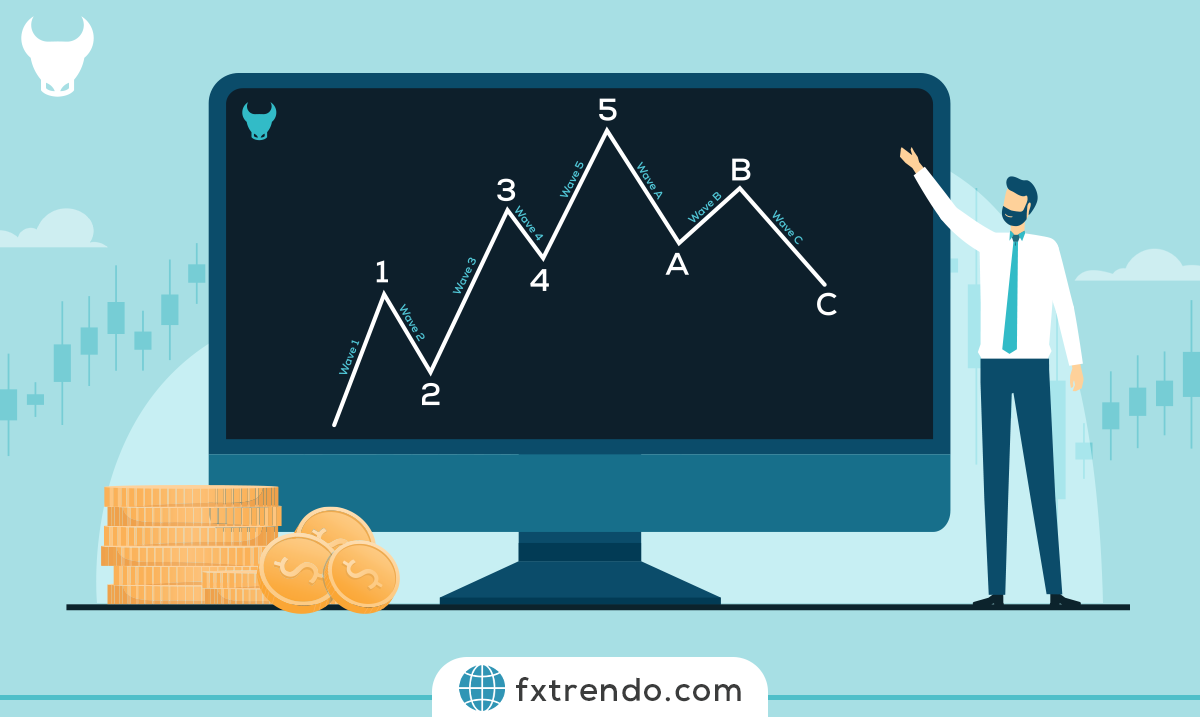
By analyzing the price's ascend and descend movements and its past, Ralph Nelson Elliott concluded that it is possible to predict the chart's future direction by counting the price waves. Elliot classified the waves into motive and corrective waves, and with mathematics' help and using Fibonacci numbers, geometry, and the price's repetitive behavior, he designed patterns and rules that one can use to predict the chart's movement path for the future by counting waves. Technically, this type of analysis is called the Elliott wave theory. Elliot's theory is one of the most complex topics in technical analysis, with many proponents.
Indicators
With the advancement of programming science, many analyses in the forex market and other financial markets are done with indicators. Indicators are tools that analyze the chart according to the instructions designed in its programming. The use of indicators in technical analysis has its supporters, but at the same time, indicators are often used as an auxiliary tool in other methods and to optimize trades. For example, some indicators are used to better find the resistance and support levels. One of the most important indicators is MACD and RSI.
Candlestick patterns
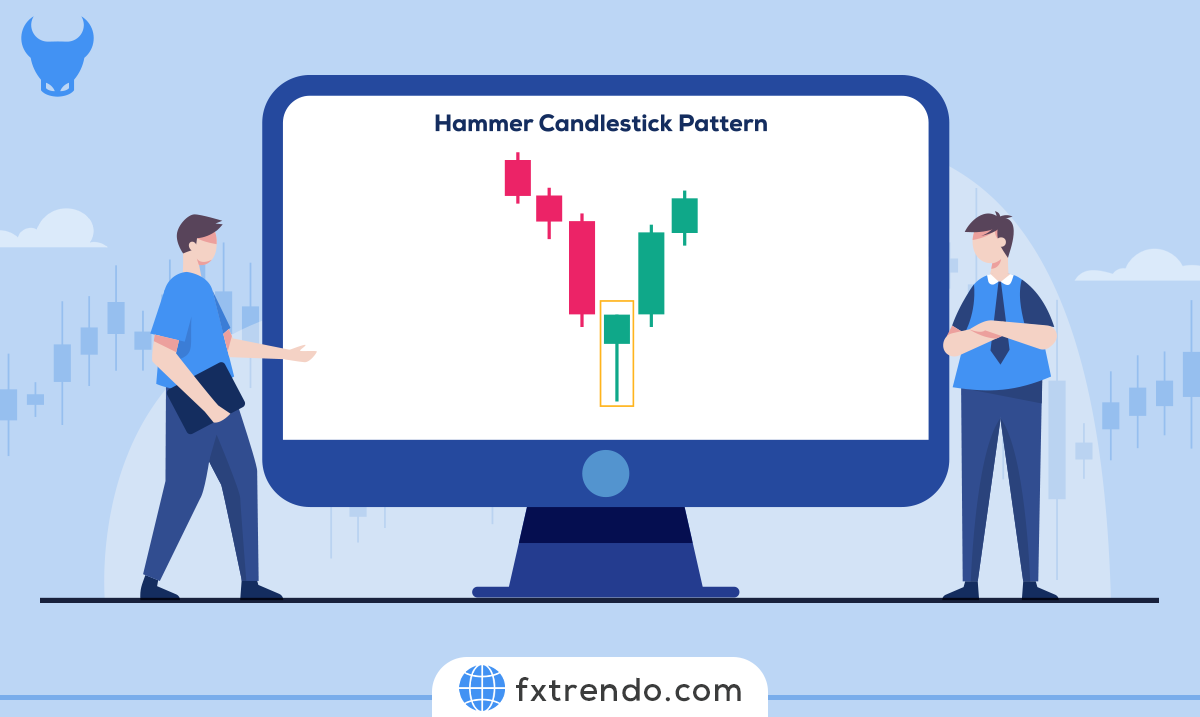
There are price charts in various forms, such as line charts, algorithmic charts, bar charts, etc. The candlestick chart is one of the most important and commonly used charts in technical analysis. In this chart, candles provide valuable data. The shape of the candles in the chart can determine price patterns, such as the trend continuance or the trend's reversal, so by reviewing the candles' behavior, one can analyze the chart and comment on the price future. The morning or evening star, hammer, and doji are among the most important candlestick patterns.
What is the best method of technical analysis in forex?
As stated in the reviews, there are several chart analysis methods in technical analysis. It is important to note that any of these methods can be sufficient for trading alone if capital management is followed and a specific trading strategy is in place. We can say that without capital management and trading strategy, long-term success in the forex market and other financial markets with any analytical method, including technical or fundamental, is impossible.
The second point that is important in choosing the technical analysis method is one's trading personality, psychology, and strategy in forex. For example, some traders have a high ability to find the correct supply and demand area, which has a trading method with a low loss limit and high risk to reward, so they choose price action as their trading method, or other traders are skilled in analyzing waves and like to profit from the trading movement, so they tend to analyze with the wave theory or Elliott method.
Another important point that traders should note is that technical analysis uses a chart, and the various methods use the past price to predict the future price. Therefore, technical analysis methods complement each other, and many methods reach the same results after analysis due to their common features. For example, a trader's analyzing method's basis is price action, and he determines the support level. After the analysis, this trader can check his support level with other methods, such as Fibonacci levels, and if they match, the probability that the analysis is correct increases.
Unlike fundamental analysis, learning all technical methods is not difficult, and you can learn all these methods for more success.
Technical analysis is suitable for which traders?
Technical analysis can be suitable for all traders with any trading strategy due to its comprehensiveness and the fact that it only uses the chart to check the chart and analyze the market. All traders, both scalpers and long-term traders, can do their analysis on price futures using only charts. The higher the trading time frame, the higher the success probability and the lower the technical analysis error percentage.
Fundamental analysis in high time frames can be used as an auxiliary tool for more success in technical analysis. Note that traders whose analysis basis is fundamental analysis need to use basic technical concepts and charts for better trading.
Although technical analysis is suitable for all traders, the important point is correct capital management and trading strategy. Consequently, it is not the analysis that guarantees the trader's success, but the analysis with the capital management and the written and correct trading strategy leads to success in trading.
Forex technical analysis advantages and disadvantages
Technical analysis in the forex market has its traits. Traders should be careful enough to choose the type of analysis and avoid bias toward an analysis' advantages and disadvantages. Many traders think that they should only analyze the forex market and that technical analysis is nothing more than a painting. Despite its advantages, the fundamental analysis also has disadvantages, which should not be exaggerated. Some traders believe that all fundamental events in the chart are predictable with technical tools. Further, we will review the advantages and disadvantages of technical analysis.
Advantages of technical analysis in forex
Easy and fast to learn and teach: Technical analysis learning and teaching are easy and accessible. The technical analysis sources are widespread and available in printed and online forms. Learning technical analysis is possible for everyone with any level of knowledge.
Technical analysis comprehensiveness: each symbol and asset's price chart can be analyzed using technical principles. One should only use the correct trading strategy to analyze different markets.
Variety of technical methods: in technical analysis, various methods can be combined to increase the analytical power, this way, errors are minimized.
Reviewing all aspects of the analysis: with technical analysis, you can determine all the necessary conditions for the trade, such as determining the trend, the entry point, and the profit and loss limit, but in fundamental analysis, it is only possible to check the probability of pinpointing the trend according to the available data.
Programming capability: nowadays, automated trading with programmed bots has become very popular in the forex world. Due to the existence of calculable parameters in technical analysis, it can be programmed and provided to bots, as a result of which bots can automatically perform chart analysis and trade.
High speed in analysis: in technical analysis, you can check the asset's price chart at any time and place with a smartphone and laptop.
Forex technical analysis disadvantages
Emotions' Influence on the analysis: sometimes, for various reasons, such as rumors or a lot of bias, a mistake may occur in the technical analysis, and as a result, the patterns and rules are not followed correctly.
Great variety and different interpretations: due to various methods in technical analysis, sometimes one may predict the price to rise, the second method may analyze the price to fall, and another may not issue a signal at all, which is why great variety may sometimes cause confusion.
Ignoring the fundamental news and economic calendar: technical analysis usually ignores the important economic news time that causes extreme volatility in the market.
Learning technical analysis in forex
Learning technical analysis is much easier than fundamental analysis. Because technical analysis is available in print and online sources and has specific learning chapters, therefore, it can be easily self-taught by anyone with any level of knowledge. An important point in learning technical analysis is to practice with the market's instant price chart. It means that a technicalist can analyze the price charts with ease after practicing with the chart for a while, but if the training is not enough, the technical analysis will cause confusion in the chart.
Related Post
most visited


