Financial markets, including the forex market, rarely move independently. A trend in one asset often correlates with several other assets, meaning that some prices rise as others fall. This is called the correlation effect of financial markets, and while it can be useful for spotting opportunities, it can increase your risk if you’re not careful. You can take an important step toward reducing your overall risk by understanding how correlation works in forex.
What Is Correlation In Financial Markets?
Correlations in financial markets, including forex, are a measure of how assets move in line with each other. Assets and currencies in the financial market affect each other for various reasons, such as the relationship between assets, and the relationship between countries, economically, industrially, and politically. You can measure the correlation of all assets and symbols in Forex. The correlation coefficient is between -1 and +1 and is usually described as a percentage. If two markets have 100% correlation, their movement will always be similar and it is called perfect correlation. At the same time, a 50% correlation means that the two markets are roughly moving in the same direction but may not always follow each other.
Types Of Correlation
There are three types of correlation:
- Positive correlation describes markets that mimic each other’s movements and move in line with each other.
- A negative correlation describes the markets with opposite movements and they move against each other.
- Zero correlation describes markets with no correlation.
Correlation Of Forex Currency Pairs
Below is a correlation coefficient table for the major forex currency pairs, which shows the degree and type of correlation of these currency pairs with each other in a period. For example, the EURUSD currency pair has the highest positive correlation of +77%. That means if the Euro/Dollar currency pair grows, there is a 77% probability that the Pound/Dollar currency pair will also rise and move in line with each other. EURUSD has a strong negative correlation with the USDCAD currency pair to a -79% extent. That is if the Euro/Dollar currency pair grows, there is a 79% chance that the USDCAD currency pair will decrease, and these two currency pairs will move in opposite directions.
Also, in the table above, you can see that the GBP/USD currency pair has a strong positive correlation with the GBP/JPY currency pair to the extent of +88%. In both of them, the first currency symbol is the British pound. It can be concluded that this strong positive correlation is due to the movements of the US dollar and the Japanese yen.
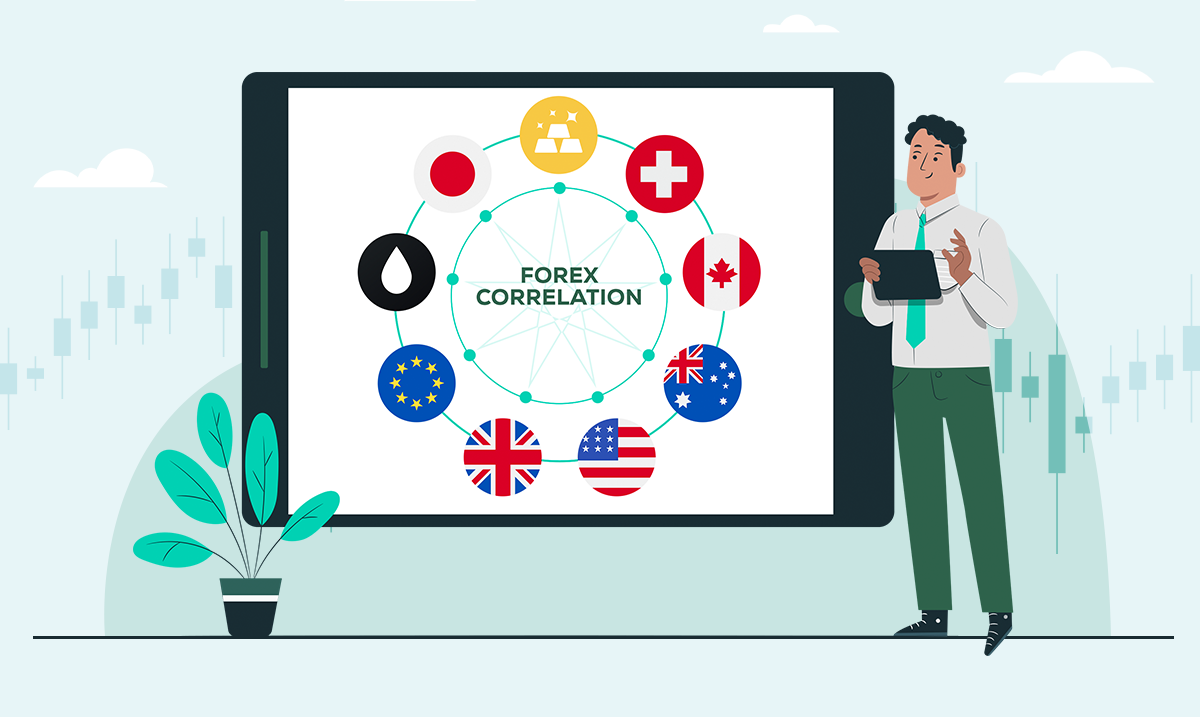
Which Currency Pairs Are More Correlated?
As shown in the image above, the key currency pairs with the highest correlation are EUR/USD and GBP/USD. They often have similar movements due to economic relations between European countries. In this case, GBP and EUR are closely related based on the shared geographical proximity of the Eurozone and the UK, as well as the reserve currency status. Also, the fact that both currency pairs share the dollar as a cross-currency means that any change in the dollar is reflected in both currency pairs simultaneously.
Other currency pairs that tend to show strong correlations are AUD/USD and NZD/USD currency pairs. Australia and New Zealand are also geographically, economically, and industrially very close to each other.
Currencies generally known as “Low-risk assets” (Swiss Franc and Japanese Yen) can also show a good correlation with each other.
Currencies generally known as “Commodity currencies” (Canadian, Australian, and New Zealand dollars) also show a good correlation with each other.
Why Correlations Are Important?
Correlations can have a significant impact on your overall risk level and final profit, and a market move against your analysis will affect your entire portfolio. For example, if you have open sell positions in two symbols with a positive correlation of 75%, a bearish trend in one will likely lead to a similar move in the other. If a position moves against your analysis, you risk losing the capital allocated to both positions. Therefore, your total risk from the trade can be higher than you originally planned.
Your overall risk in managing the account can be much higher than you think if you have multiple correlated positions. So it’s always worth checking which markets are correlated and which ones can add diversification to your portfolio.
Also, the correlation of the symbols can be helpful for technical analysis, for example, the EUR/USD currency pair crosses its main resistance in the technical analysis, but the GBP/USD currency pair is still involved with its resistance because these two currency pairs are strongly positively correlated. They can also act in the same direction in technical analysis, and this currency pair can overcome its resistance. Therefore, correlations can be used in technical analysis in addition to trading risk coverage.
Profiting From Correlations
You can also use correlations to make a profit. For example, a stock trading strategy is to find stocks of related companies and monitor their price performance.If one of the shares of these companies had an independent movement compared to the rest of the shares, you can assume that this movement is fake and take a position regarding its eventual return to normal. The same can be done in forex trading.
Commodity Correlations
Some correlations are only temporary, while others have lasted for years and are likely to continue. Here are some common examples to be aware of in your trading.
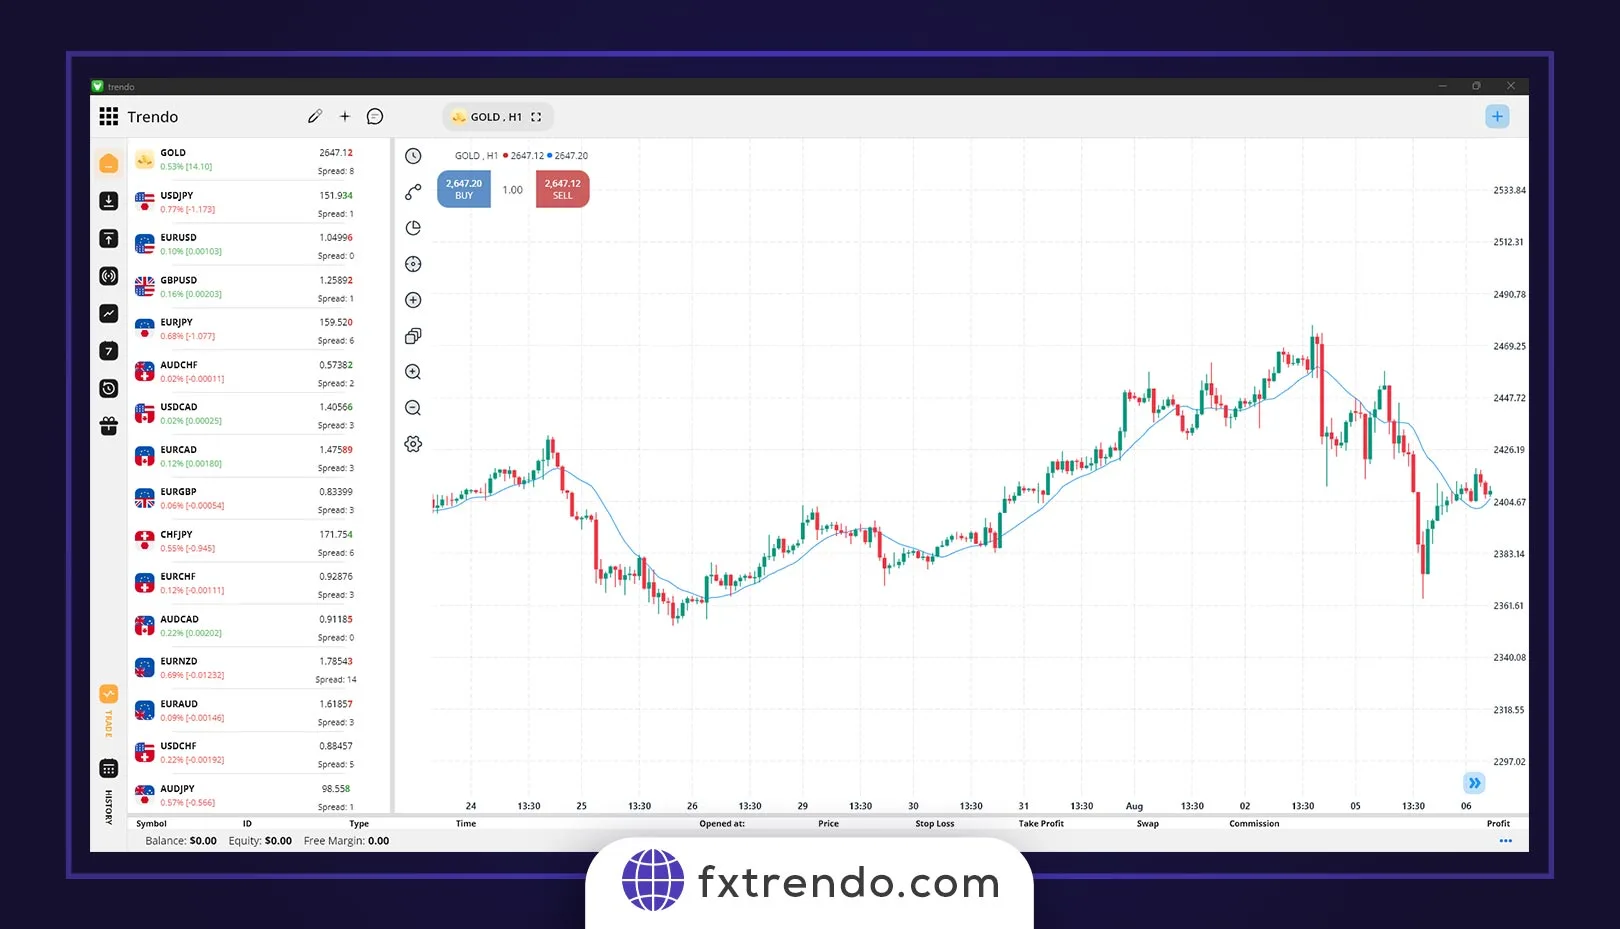
Dollar Correlation With Gold
Perhaps the most well-known financial market correlation is between the US dollar and gold. Gold is priced in US dollars, so its price is highly dependent on the currency’s strength, and there is a strong negative correlation between the two. When the dollar’s value rises, the gold’s price often falls. As a result, in gold transactions, you should pay attention to the data related to the US dollar in the economic calendar, such as the inflation rate, interest rate, etc.
AUD/USD Correlation With Copper & Gold
Many currency pairs are linked to commodities. That usually happens when a country’s economy depends on goods for growth. For example, Australia derives most of its wealth from metal mining. Therefore, the price of AUD/USD can positively correlate with the movement of copper and gold prices.
Canadian Dollar Correlation With Oil
Canada is known as one of the largest oil exporting countries in the world, therefore the Canadian economy is very dependent on the price of oil, and if the price of oil rises, the Canadian dollar will also become more valuable. Also, due to Canada’s geographical neighborhood and the good conditions it has with the United States, this country exports most of its exports to the United States. As a result, USD/CAD has a negative correlation with the price of oil. Therefore, with the rise of oil, this currency pair’s price will drop.
The CAD/JPY currency pair has the most positive correlation with the oil price. Due to the lack of oil resources, Japan must import all its energy and oil. If the oil price increases, the Canadian dollar will become stronger as an exporter, and the Japanese yen will weaken as an importer.
Gold & Safe Currencies Correlation
In the forex market, the currency of Japan and Switzerland is known as safe currency due to their stable economy and low-interest rate. In times of crisis such as war and diseases such as Corona and economic crises, investors are interested in safe assets such as gold and currencies such as the Japanese yen (JPY) and Swiss franc (CHF). Therefore, gold has a positive correlation with these currencies and a negative correlation with the USDJPY and USDCHF currency pairs.
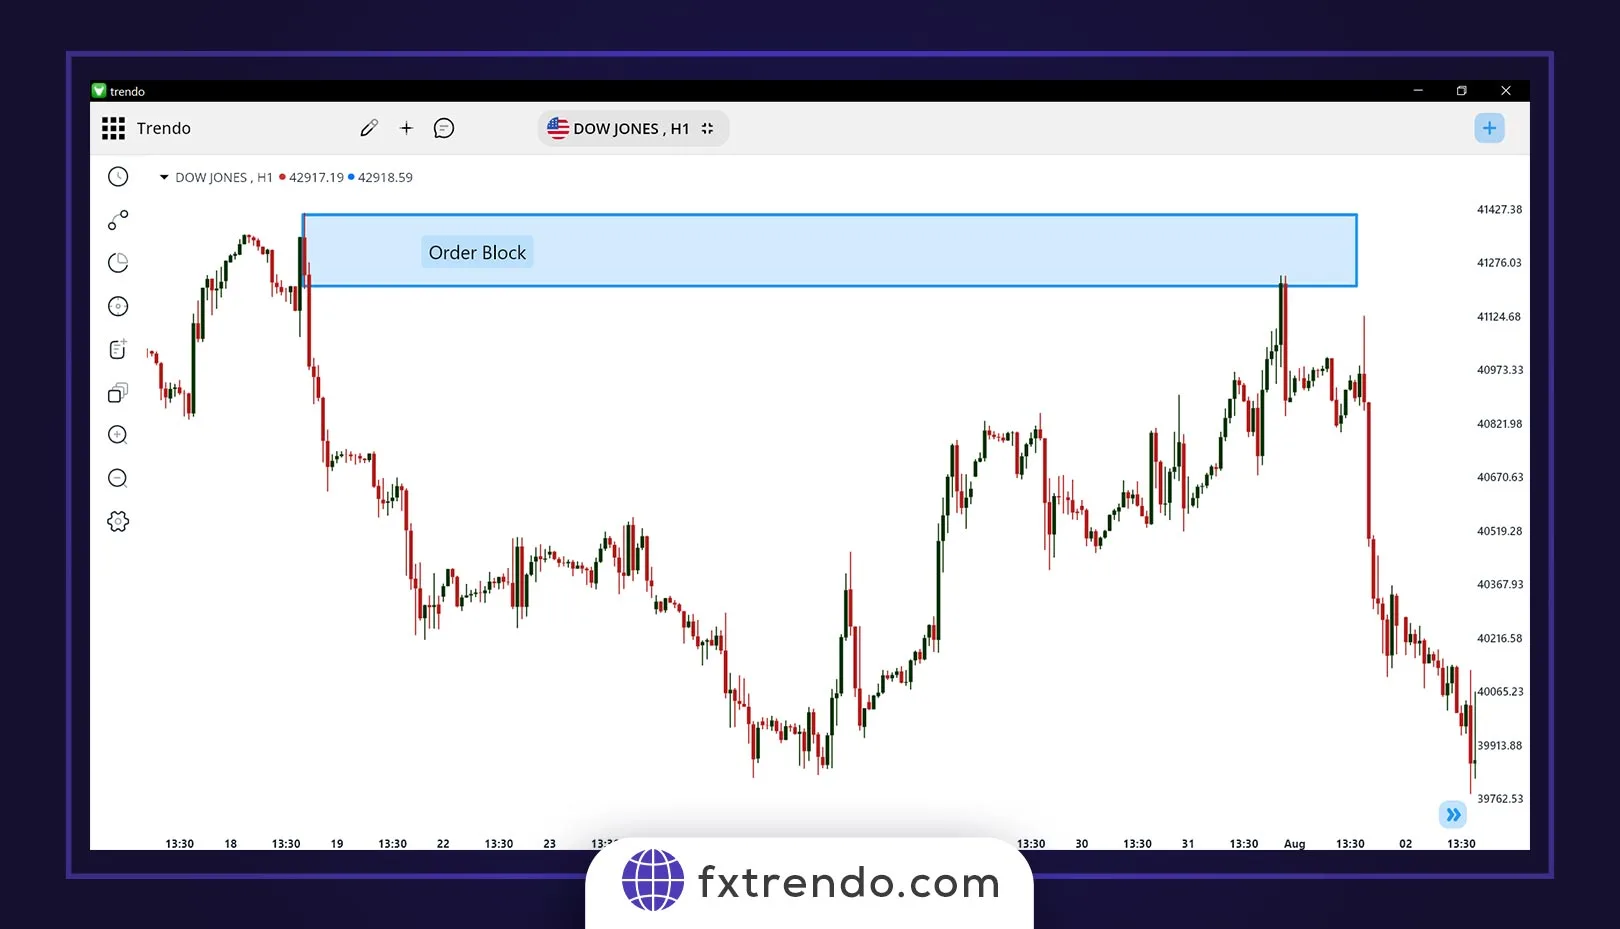
US Stock Market Indices Correlation
The major US stock market indices in forex are the DOW JONES, NASDAQ, and S&P500 symbols. These three symbols have a strong positive correlation with each other, and correlate with other markets, such as gold, the US dollar, and Bitcoin, which we will discuss further.
Stock Market Indices Correlation With USD & Gold
In general, when the US economic situation is good, and the economic data show signs of this country’s economic prosperity, the US dollar will strengthen. As a result, due to the favorable state of the economy, stocks and stock market indices will grow, and gold, known as a safe asset, will decrease. Therefore, the stock market index has a positive correlation with the USD and a negative correlation with gold. But this issue may not apply in crisis and have a negative correlation.
Bitcoin & Stock Market Index Correlation
Recently, many analysts pay a lot of attention to Bitcoin’s positive correlation with US stock market indices, especially NASDAQ and S&P500. Therefore, it is best to pay special attention to these two US stock market indices if you are a cryptocurrency trader. Note that Bitcoin has a positive correlation with other cryptocurrencies.
Summary
Like synchronized swimmers, some currency pairs move with each other, and like the same poles of a magnet, some currency pairs move in opposite directions. When simultaneously trading multiple currency pairs in your trading account, the most important thing is to be sure you know how much risk you are taking. You may believe that by trading in different currency pairs, you are spreading or diversifying your risk, but know that many of them tend to move in the same direction, and trading highly correlated pairs, will only increase your risk!
Correlations between currency pairs can be strong or weak and last for weeks, months, or even years. But always know that they can change in an instant. Staying up-to-date on currency pair correlations can help you make better decisions if you want to consider leverage, risk percentage, and diversification of your trades.