


What is RSI?
The Relative Strength Index (RSI) is a momentum oscillator that measures the speed and volatility of price movements. This indicator is a valuable tool for forex traders as it helps identify overbought and oversold conditions in the market. RSI is usually displayed as a line chart and ranges from 0 to 100.
RSI calculation
RSI is calculated using a formula that takes the average profit and loss of the analyzed asset in a given period into account. The formula is as follows:
RSI = 100 – (100 / (1 + RS))
RS is the average profit divided by the average loss, in a particular period. The period used for calculation is usually 14 days, but traders can adjust this period according to their trading strategy. First, you must calculate the average profit and loss for the selected period to calculate RS. Average profit is the sum of profits during the period divided by the number of periods, while average loss is the sum of losses during the period divided by the number of periods.
The average profit and loss formula is as follows:
Average profit = (total profit during the period) / (number of periods)
Average loss = (total loss during the period) / (number of periods)
Profit and loss are calculated by calculating the difference between the current candle’s closing price and the previous candle’s closing price. It is a profit if the current candle closes higher than the previous one. If the current candle closes lower than the previous, it is considered a loss. Once you have calculated the average profit and loss, you can use them to calculate RS. RSI is shown as a line chart with amounts between 0 and 100. Above 70 amounts are considered overbought, and below 30 are considered oversold.
How to use RSI in Forex trading?
RSI is used to identify overbought or oversold conditions in the market. When the RSI amount is above 70, it means the currency pair is overbought, and below 30 implies that the currency pair is oversold. One can use these areas in different ways as entry or exit points for trading positions. These methods include:
- Overbought conditions
- Oversold conditions
- Divergence
- Break confirmation and trend reversal
- Using level 50
Further, we explain each of the above methods.
Overbought conditions: When the RSI amount is above 70, it implies the currency pair is overbought. That means the price has risen too quickly, and a price retracement or trend reversal may occur. Traders can use this signal to sell the currency pair or wait for a bearish candlestick pattern to confirm a reversal.
Oversold conditions: When the RSI value is below 30, it implies the currency pair is oversold. That means the price has dropped too fast, and a price correction or trend reversal may occur. Traders can use this signal to buy the currency pair or wait for a bullish candlestick pattern to confirm a reversal.
Divergence:
- Positive regular divergence
- Negative regular divergence
- positive hidden divergence
- Negative hidden divergence
Stay till the end to learn more.
Positive Regular Divergence: In a downtrend, if the price of a currency pair makes a lower floor, but the RSI makes a higher floor, it indicates that the downtrend has weakened, and we will probably see a trend reversal. That is a positive regular divergence (RD+), and likely traders may consider buying the currency pair at this stage.
Negative Regular Divergence: In an uptrend, if the price of a currency pair makes a higher ceiling, but the RSI makes a lower ceiling, it indicates that the uptrend is weakening, and we are likely to see a trend reversal. That is a negative regular divergence (RD-), and traders may consider selling the currency pair at this point.

Positive Hidden Divergence: In an uptrend, if a currency pair’s price makes a higher floor, but the RSI makes a lower floor, it indicates that the uptrend will continue. This state is a positive hidden divergence (HD+), and traders look for a buy trade at this stage.

Negative Hidden Divergence: In a downtrend, if a currency pair’s price makes a lower ceiling, but the RSI makes a higher ceiling, it indicates that the downtrend will continue. This state is a negative hidden divergence (HD-), and traders look for a sell trade at this stage.

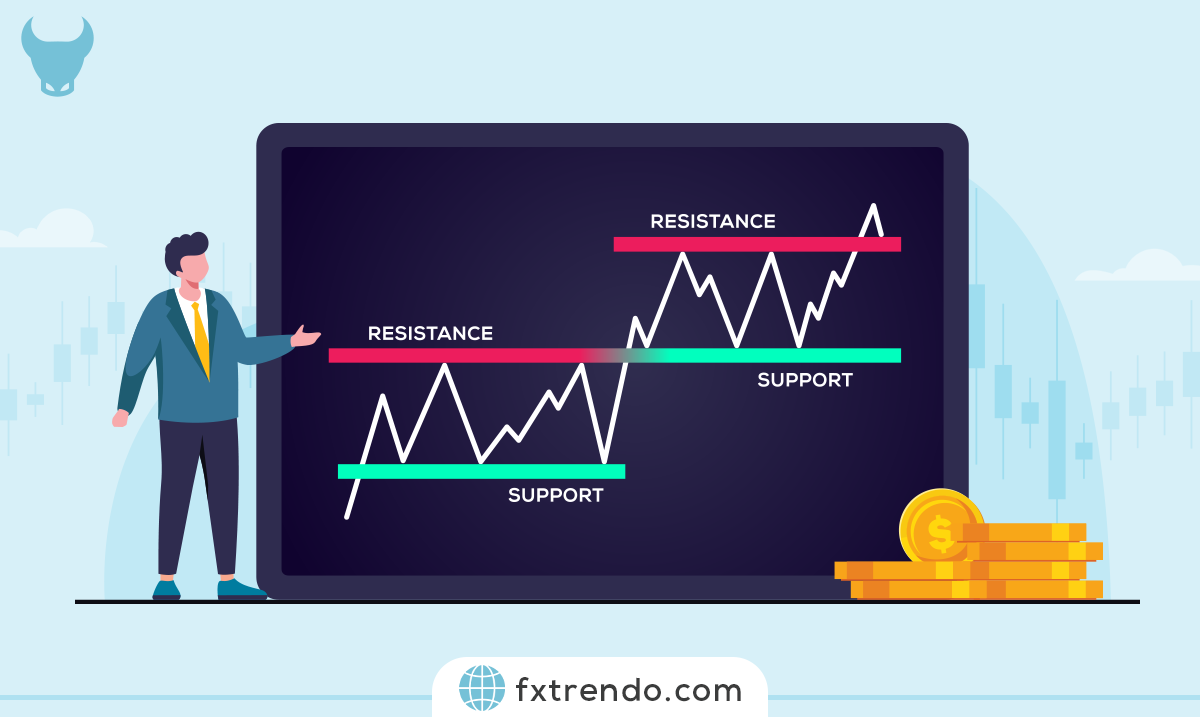
Break confirmation and trend reversal: One can also use RSI to confirm breaks and trend reversals. When a currency pair crosses a key resistance level, traders often search for confirmation from the RSI indicator. If the price corrects after the break and the RSI stays above 50, it implies the break is confirmed, and the price will likely continue to rise. Conversely, if the RSI drops below 50, it indicates that the break is likely to be fake, and the price will return below the resistance level.
Using the 50 level: Support and resistance levels are key areas on the price chart where the price tends to stop or reverse. One can use RSI to identify potential support and resistance levels. When the RSI approaches or crosses the 50 level, it can act as a support or resistance level. Traders can use this information to predict potential price reactions and adjust their trading strategies.
The RSI indicator Advantages and Disadvantages
While trading with the RSI indicator can be effective, beginners must understand its pros and cons before incorporating it into their trading strategy.
The advantages of trading with the RSI indicator for beginners are:
- Easy to understand
- Identifying overbought and oversold conditions
- Confirmation tool
- Versatility
Further, we will explain these advantages.
Easy to understand: The RSI’s simplicity is one of the main advantages of using it for Forex trading. RSI is a visual indicator displayed below the price chart, making it easy to interpret and use for beginners. It’s calculated using a formula that considers the average profit and loss over a certain period. Traders can use this information to identify potential entry and exit points.
Identifying overbought and oversold conditions: RSI helps identify overbought and oversold conditions in the market. When the RSI is above 70, the currency pair is overbought, and a trend reversal or correction may be imminent. Conversely, the currency pair is oversold, and a potential buying opportunity may arise when the RSI is below 30. That can help beginners avoid entering trades at damaging prices.
Confirmation tool: One can also use RSI as a confirmation tool in conjunction with other technical analysis indicators. For example, when a beginner trader identifies a potential trend reversal based on a chart pattern or moving average crossover, they can use the RSI to confirm the trend reversal signal’s strength. If the RSI opposes the price action, it may imply a weak trend and serve as a warning to avoid the trade.
Versatility: RSI can be used for any currency pair and time frame, making it a versatile tool for beginners. The RSI can be adjusted to suit their preferred trading style, whether a trader prefers scalping, day trading, or swing trading. This flexibility allows beginners to experiment and find the best settings for themselves.
Disadvantages of trading with the RSI indicator for beginners are:
- Lagging indicator
- False signals
- Market volatility
- Limited information
Further, we explain the disadvantages of this tool.
Lagging indicator: One of the main drawbacks of RSI is that it has a lag. That means it reacts to previous price movements rather than predicting the future. As a result, there is a lag between actual market conditions and when the RSI signals a potential trade. This delay can lead to missed opportunities or late entry into trades.
False Signals: Like any technical analysis tool, RSI is not error-free and can produce false signals. For example, the RSI may indicate an overbought condition, but the price continues to rise, causing a rookie trader to exit the trade with little profit. Similarly, the RSI may show an oversold condition, but the price is still dropping, prompting the trader to enter the transaction too soon. Beginners should be cautious and use confirmation tools to reduce the risk of false signals.
Market Volatility: RSI may not perform well in volatile market conditions. Volatility can cause the RSI to fluctuate rapidly, leading to false signals. Beginners must exercise caution and consider indicators or other tools that might help filter out the noise in such situations.
Limited information: While the RSI provides valuable info about overbought and oversold conditions, it does not show the market’s complete picture. This indicator does not consider fundamental factors or market sentiment, which can significantly affect price movements. Beginners should use RSI with other analysis types to make informed trading decisions.
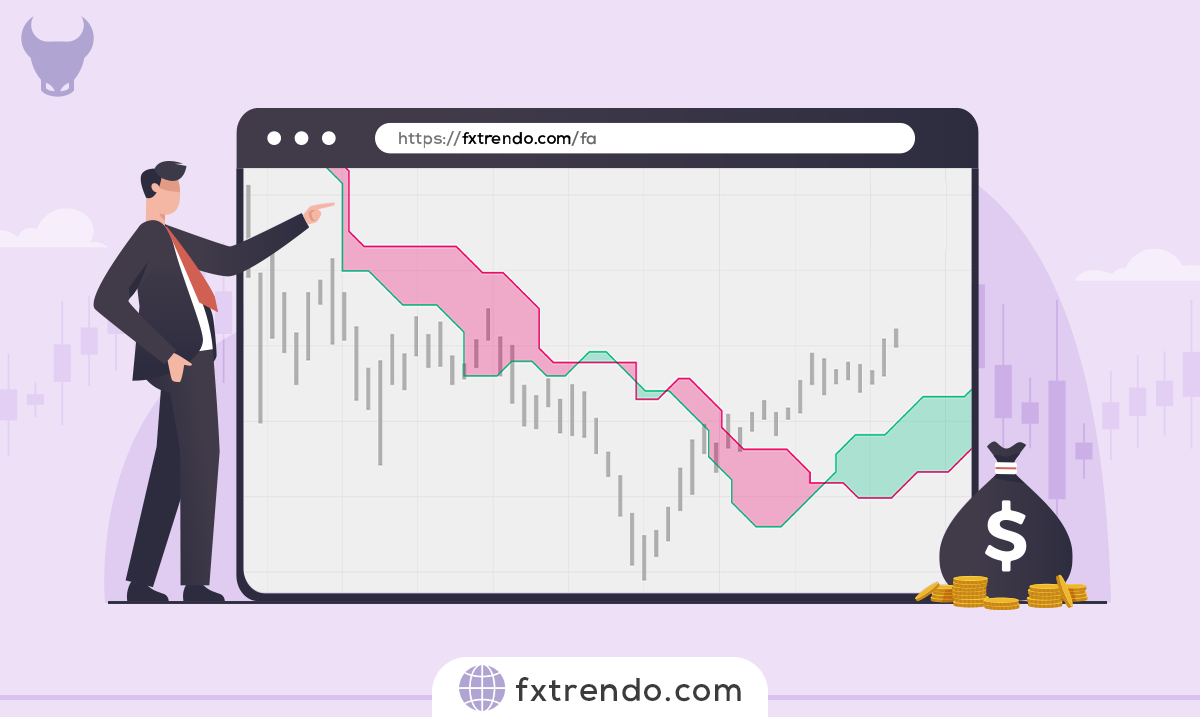
Read More: Forex analysis types and the best analysis method
Two simple trading strategies with the RSI indicator
In addition to the techniques introduced above for forex market analysis that one can customize to create a winning strategy, we will also teach two excellent and practical RSI indicator strategies.
These strategies include:
- RSI volatility
- The trend line in the RSI chart
Stay till the end of this article for full training on these strategies with practical examples.
RSI volatility: This method is a very new RSI trading strategy that works well in all time frames and all market conditions types. This technique is called RSI volatility.
Read More: What is a trading strategy? Steps to build a winning trading strategy in Forex
For Buy
As you can see in the image below, number 1 indicates that the price has entered the oversold zone, which means that the sellers in this currency pair are likely to weaken and we expect the trend to reverse soon. Number 2 represents price reversal from the oversold area. Number 3 shows the sellers trying again, but the buyers’ urgent pressure, number 4, does not allow the sellers to move forward, and the buyers dominate the market.

For Sell
As you can see in the image below, number 1 implies that the price has entered the overbought zone, which means that the buyers in this currency pair will likely weaken and we expect the trend to reverse soon. Number 2 represents the price reversal from the overbought area. Number 3 shows the buyers trying again, but the sellers’ urgent pressure, i.e., number 4, does not allow the buyers to move forward, and the sellers dominate the market.

The Trend line in the RSI chart: The RSI indicator also shows the support and resistance levels, and these lines are in the form of horizontal zones or as a trend line. Most traders don’t know this, but they can apply trend lines to the RSI indicator in the same way they draw them on a price chart.
For Buy
The RSI indicator breaks the trend line and penetrates above it in the image below, which is an upward movement sign in this currency. We enter a buy trade when the RSI completes a pullback on the trend line.
For Sell
The RSI indicator breaks the trend line and penetrates below it in the image below, which is a downward movement sign in this currency. We enter a sell trade when the RSI completes a pullback on the trendline.
Summary
RSI is a popular technical analysis tool that helps traders determine a currency pair trend’s strengths and weaknesses. This momentum oscillator generates buy and sell signals based on overbought and oversold conditions. Traders should use RSI alongside other technical and fundamental analysis tools and know its limitations.