Trading Strategy Based on Doji Candle Types


A doji candlestick is one of the most common candlestick patterns formed when a currency pair's opening price and closing price are almost the same, resulting in a candlestick with a much smaller body and long shadows. This pattern is often seen as an indecision sign in the market, as buyers and sellers failed to gain control during the trading timeframe. In this article, we will have a more detailed look at what the doji candle means, how to identify it, and how to use it in a trading strategy.
Contents
Identifying Doji candlestick
As mentioned earlier, a doji is a candlestick pattern with a much smaller body and long shadows. Shadows can vary in length but are usually at least twice the body's length. This candle's shape can be different. There are four types of doji candles:
- Common Doji
- Long-legged Doji
- Dragonfly Doji
- Gravestone Doji
Below is an explanation of the different types shown in the pictures.
Standard Doji: This candle is the most common type of doji. Its opening and closing prices are almost alike, and its shadows are not too long, indicating the market's uncertainty.
Long-legged Doji: This doji has long upper and lower shadows, indicating that the price fluctuation range was wide in that time frame. This pattern implies extreme hesitation in the market and can be a possible reversal sign.
Dragonfly Doji: This doji has a long lower shadow and no upper shadow, indicating that buyers have managed to gain control of the market during the time frame. This pattern could imply a potential return to the uptrend if it appears near the support level.
Gravestone Doji: This doji has a long upper shadow and no lower shadow, indicating that sellers have managed to gain control throughout the candle formation. This pattern could imply a possible return to the downtrend if it forms near the resistance level.
Doji candle commentary in the Forex market
A doji is often seen as a sign of uncertainty in the market as buyers and sellers fail to gain control over the trading timeframe . This pattern is a neutral candle, which does not provide clear indications of the future market direction. However, dojis can be a sign of a trend reversal depending on where they are. For example, if a doji candlestick is formed after a long uptrend, it may be a sign that buyers are losing strength and sellers are slowly taking control of the market, and vice versa. In both cases, traders should use their strategy and seek candlestick confirmation before deciding on trades.
How to use the Doji candlestick in trading strategy
While dojis are not a reliable signal alone, they can be helpful tools when combined with other technical indicators. Here, there are several ways that traders can use dojis in their trading strategy:
- Support and Resistance Levels Confirmation
- Reversal trend patterns
- Trend Continuation patterns
- Stop loss Placement
Further, we explain each of the above.
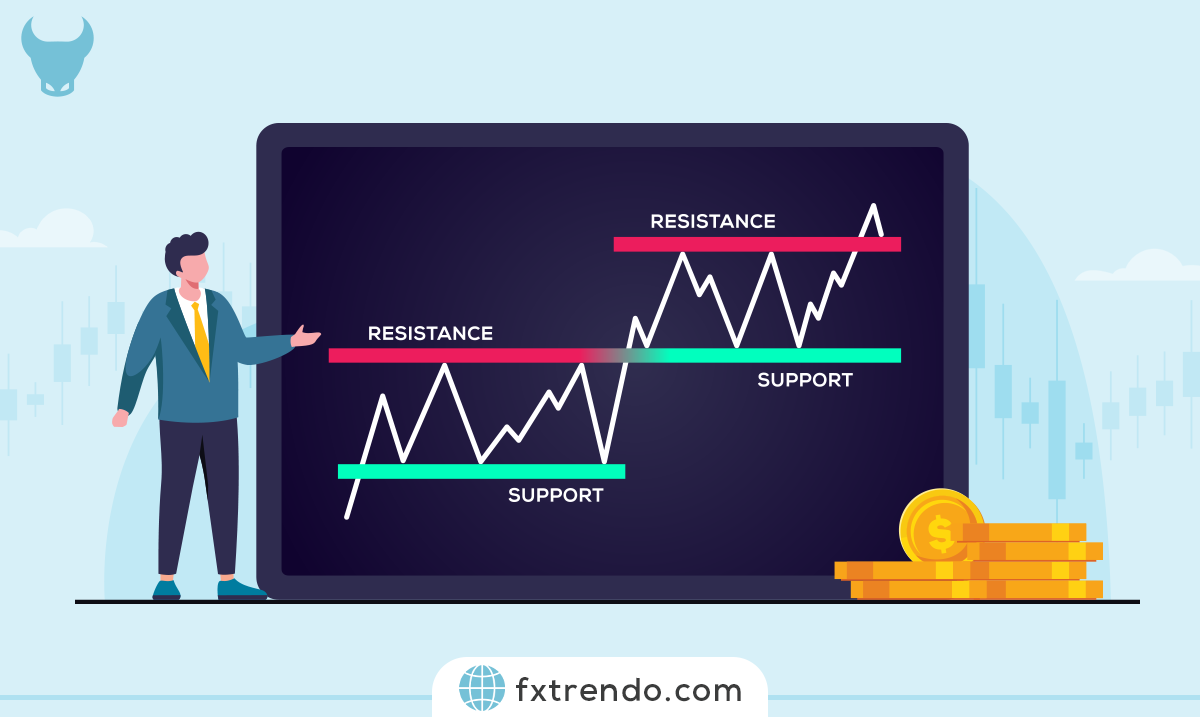
Support and Resistance Levels Confirmation: You can use Dojis to confirm support and resistance levels. If a doji forms near a key support or resistance level, it may signal that the level is strong and the market is likely to reverse from that level.
Reversal Trend Patterns: Dojis can be part of reversal trend patterns. For example, a doji followed by a bearish engulfing candle can signal an uptrend's reversal. Similarly, a doji followed by a bullish engulfing candle can signal the downtrend's reversal.
Read More: What is a Candlestick? The Use of Candles in Analysis and Trading Strategy
Trend Continuation Patterns: Dojis can also be part of trend continuation patterns. For example, a doji with a long shadow followed by a bullish engulfing candle may signal an uptrend's continuation.
Stop Loss Placement: Traders can use doji candles to place their stop loss orders. If a doji forms near a key support or resistance level, depending on their trading strategy, traders can place their stop-loss order above or below the doji.
How to trade with Doji Candles?
This candle is an indecision sign in the market, and it can indicate the current trend's reversal or continuation depending on the conditions. Trading is impossible with the doji candle alone, and you should only use it for confirmation in your strategy. Trading with this type of candle requires understanding the nuances and adapting it to your overall trading strategy. Here are some key steps to consider when trading doji patterns:
1. Identify the doji candle
Identifying it on the chart is the first step in trading this pattern. As mentioned, the doji pattern can have various forms, and interpretations vary according to the shadows' position. However, a small body with long shadows is all doji patterns' common feature.
2. Look for contextual evidence
Once you have identified a doji pattern, the next step is to look for contextual evidence to decide its significance. For example, a doji pattern that appears after a long uptrend may imply a potential reversal trend while a doji pattern that appears in the middle of a ranging market may not be as significant.
3. Consider the volume
The trading volume is another factor to consider when trading the Doji pattern. A high-volume doji pattern may show a significant change in market sentiment, while a low-volume doji may indicate a temporary pause in the market.
Read More: Sentimental Analysis in Forex
4. Confirm the pattern
Traders often look for additional signals such as trend lines, support and resistance levels, or other technical indicators to confirm a doji pattern. These signals can help confirm the doji pattern's significance and provide better insight into potential trading opportunities.
5. Plan your trade
Once you have identified and confirmed the doji pattern, it is time to plan the trade. You may choose to enter a long or short position, set stop loss and take profit orders, or use other trading strategies to manage risk and maximize potential profits depending on the context and other factors.
Read More: The best time to trade currency pairs in the forex market.
6. Observe your trade
After entering a trade, observing it closely to confirm it performs as expected is essential. You may need to adjust your strategy or exit the trade to minimize the loss if market conditions change or the transaction does not perform as expected.
Two examples of trades using the Doji candle
Traders use different methods to trade these candlestick patterns. However, all these strategies use the doji candle for confirmation only.
First example: Doji and indicators
The chart displays that the doji candle has appeared at the end of a downtrend. This pattern shows that the bulls and bears are not in control, meaning trend reversal is possible. At this point, we look at a personal strategy using the stochastic indicator, which is currently in oversold territory, adding to the bullish bias.
Second example: Doji and trend line
A popular doji trading strategy is when they appear near support and resistance levels. The chart shows a dragonfly doji that has emerged close to the trendline's support. In this case, the candlestick pattern shows the retracement of low prices. This pattern can mean a potentially bullish signal near a support area.
Summary
The doji candlestick is a significant candlestick pattern in forex trading. This candle indicates uncertainty in the market and can be a sign of the current trend's possible reversal. Traders should know the four types of doji candles and how to use them to identify potential support and resistance levels. It is important to note that the Doji pattern is not always a reliable indicator for market analysis, and one should use it with other technical indicators and fundamental analysis.


