
Among the different types of charts, the candlestick is probably the most popular among traders and analysts. Probably because candlestick charts are visually distinct from line and bar charts.
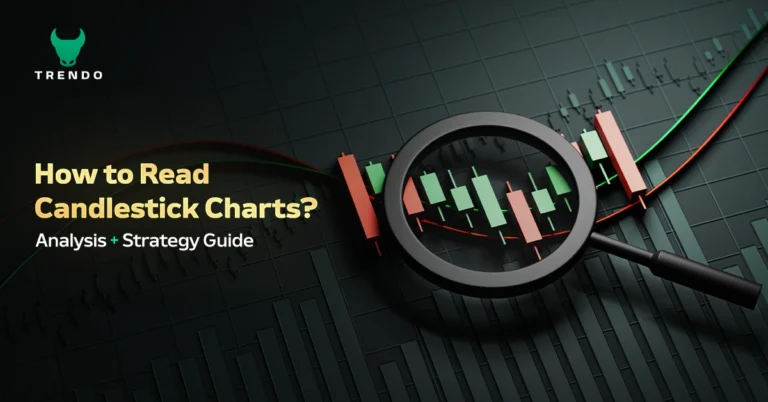
Trading and investing are a game of probability and risk management. Therefore, reading candlestick charts is critical to almost any investment style. This article will explain what candlestick charts are and how to read them.
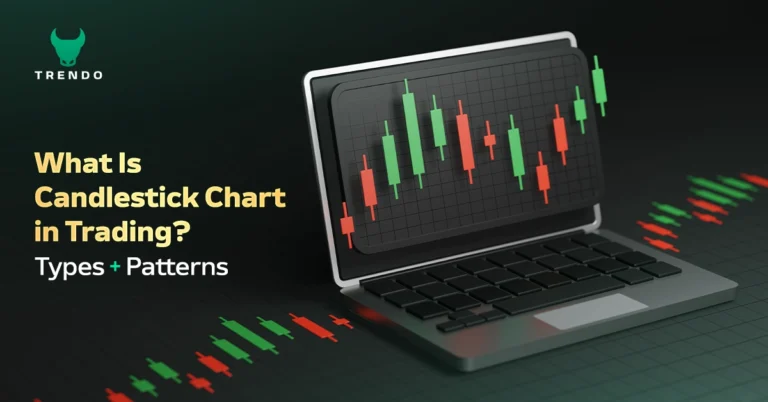
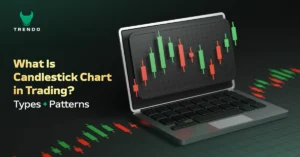
What is a Candlestick Chart?
A candlestick chart is a type of chart in the financial market that graphically shows the price movement of an asset for a certain period. As its name suggests, it consists of candles, each of which indicates the same time, the opening and closing prices, and the highest and lowest prices in the candle. Candlesticks can illustrate almost any period, from seconds to years.
The history of candlestick charts dates back to the 17th century. Their creation as a charting tool is credited to a Japanese rice merchant named Homma. His ideas were probably the foundation of what is used now as the modern candlestick chart. Homma’s findings were modified by many, most notably Charles Dow, known as the “father” of Modern Technical Analysis.
While candlestick charts can be used to analyze any other type of data, they are primarily used to facilitate the analysis of financial markets. If used correctly, these charts are tools that can help traders gauge the probability of outcomes in price action. They can be applicable because they enable traders and investors to formulate their ideas based on their market analysis.
What do Candlestick Charts show?
As mentioned, a candlestick is an asset’s price performance graphical representation, allowing analysts and traders to visualize the minimum, maximum, and open and close prices over a specific time frame.
For example, a 1-hour chart consists of several candles, each of which shows the market movement over a 1-hour time frame. Each candlestick shows the open and close prices (the candle’s body) and the high and low prices (the long lines above and below the body, also known as the wick or shadow).
The candles have different colors depending on the market movements’ direction and the opening and closing price. Ascending candles are usually shown in green or black (filled). Descending candles are red or hollow (white).
What do Candlestick Charts Not Show?
While candlesticks are useful in giving a general idea of price, they may not provide all you need for a complete analysis. For example, candlesticks do not show in detail what happened between the opening and closing, only the distance between the two points (along with the highest and lowest prices).
For example, while the wicks of a candle indicate the low and high prices of the period, they cannot tell us which one happened first. However, on most charts, it is possible to change the time frame and get more detailed information on smaller time frames.
Candlestick charts can have a lot of market noise, especially when charting lower time frames. Candlesticks can also change quickly, which can make them challenging to interpret.
12 popular Candlestick Patterns used in Technical Analysis
There are various candlestick patterns that traders can use to identify areas of interest on a chart. These are useable for daily, fluctuating, and even long-term trading. While some candlestick patterns may provide insights into the balance between buyers and sellers, others may indicate trend reversals, continuations, or bearishness. It’s important to note that candlestick patterns aren’t necessarily a buy or sell signal by themselves. Candlestick patterns are useful when used in combination with technical analysis techniques and the basics of fundamental analysis.
Bullish Reversal Candlestick Patterns
Some candles can be signs of an upward trend in the candlestick chart. These candles are not signals by themselves, but we can receive good signals if these ascending candlestick patterns are combined with the basics of technical and fundamental analysis.
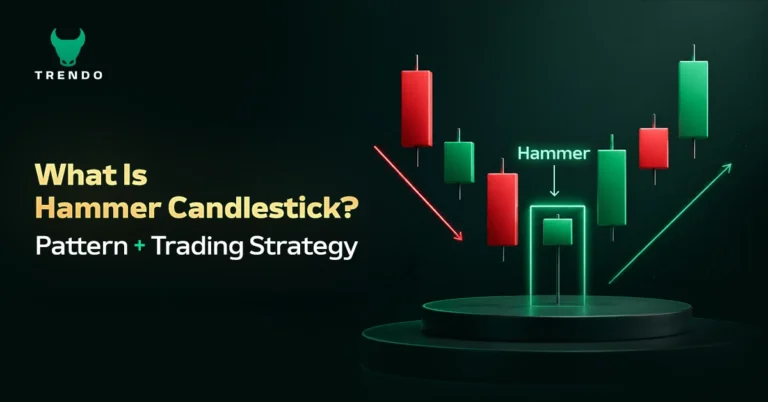
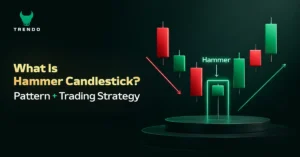
Hammer Candle
A candlestick with a long lower wick or shadow at the end of a downtrend, where the lower wick is at least twice the size of the body, represents a hammer. Although the selling pressure was high, the buyers with their demand have raised the price close to the opening price of the candle, and these are signs of the sellers’ weakness and the buyers’ initial strength in the descending trend. The body of a hammer can be red or green, but green hammers may indicate a stronger bull reaction.
Inverted Hammer Candle
It’s just like a hammer candle, but with a long wick at the top of the body. Like the hammer, the upper wick should be at least twice the body size. An inverted hammer occurs at the end of a downtrend and may indicate a potential reversal to the upside. The upper wick shows that the price has stopped its further downtrend, although the sellers eventually managed to push the price down to near the opening price, and are signs of the buyers’ initial entry. As such, the inverted hammer may indicate that buyers will soon gain control of the market.
Three White Soldiers Candlestick Pattern
The Three White Soldiers pattern consists of three consecutive green candles, all of which open in the body of the previous candle and close at a level higher than the height of the prior candle. Ideally, these candles should not have lower wicks, which shows that the continuous buying pressure will raise the price. The candles’ size and the wicks’ length are useable to judge the chances of continuance or possible correction. The pattern of three white soldiers shows the buyers’ strength in the upward continuation, and you can enter the transaction after corrections in the trend direction.
Bullish Harami
A bullish harami is a long red candlestick followed by a smaller green candlestick entirely within the previous candlestick’s body. A Bullish Harami can be shown over two or more candles and is a pattern that indicates selling acceleration is slowing down and may end.
Bearish Reversal Candlestick Patterns
Some candles can be signs of a downtrend in the candlestick chart. These candles are not signals by themselves, but you can receive good signals if these candlestick patterns are combined with the basics of technical and fundamental analysis. Bearish candles are the opposite of bullish candles.
The Hanging Man Candle
A hanging man candle is the bearish equivalent of the inverted hammer. It usually forms at the end of an uptrend with a small body and a long lower wick. The lower wick indicates there’s been a lot of selling, but the buyers managed to take back control and push the price up. With this in mind, after a long uptrend, it serves as a warning that buyers will soon lose control of the market.
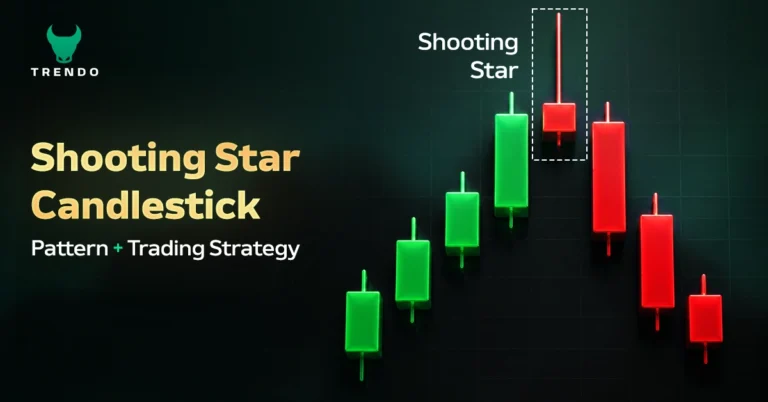
Shooting Star Candle
The shooting star is a candle with a long upper wick, a small or no lower wick, and a small body, which is ideally close to the minimum price. A shooting star is the bearish equivalent of a hammer, but it forms at the end of an uptrend. This candlestick shows that the market has reached a peak, but then the sellers took control and pushed the price lower. Some traders prefer to wait for the next few candles to confirm the pattern.
Three Black Crows Candlestick Pattern
Three black crows are made of three consecutive red candles that open inside the previous candle’s body and close at a lower level than the prior candle. This pattern, which is the bearish equivalent of three white soldiers, ideally should not have Long wicks, which indicate continuous selling pressure and cause the price to fall. The candles’ size and the wicks’ length can be used to judge the chances of the price continuing to move.
Bearish Harami
A bearish harami is a long green candlestick followed by a small red candlestick with a body entirely inside the previous candlestick. A bearish harami can appear over two or more days, at the end of an uptrend, and may indicate a reduction in buying pressure.
Trend Continuation Candlestick Patterns
Rising Three Methods
This pattern occurs in an uptrend where three consecutive red candles with small bodies are followed by the uptrend continuation. Ideally, red candles should not cross the range of the previous candle. The trend continuation is confirmed by a green candle with a large body, indicating that the bulls are again in control of the trend’s direction.
Falling Three Methods
It is the opposite of the rising three methods indicating the continuation of the downtrend.
Doji Candlestick Review
A doji candlestick is formed when the open and close prices are the same or very close to each other. The price can move up and down, but eventually, it closes at or close to the opening price. As such, a doji candle may indicate a point of indecision between buying and selling forces. However, the interpretation of a Doji candle strongly depends on other factors, such as where in the trend this candle formed, and on technical analysis, so this candle can indicate the trend continuation or a change in the trend according to other factors. Often, the doji candle means exhaustion in the market and the failure of buyers and sellers to win over each other and creates a state of expectation for traders. Candles after doji or other technical tools indicate the symbol’s trend direction and show traders the right decision.
According to the basic definition of a doji, the open and closed prices must be the same. But, if the opening and closing prices are not the same, it is called a Spinning Top candlestick. However, since financial markets can be volatile, accurate doji candlestick is rare. As such, the Spinning Top is often used instead of doji.
Depending on where the open/close line falls, a doji candle can be described as below:
Gravestone Doji Candle
Gravestone doji is a bearish reversal candlestick with a long upper wick and an open/close to the minimum price.
Long-legged Doji Candle
Long-legged doji is an indecisive candle with lower and upper wicks and the open/close price near the midpoint.
Dragonfly Doji Candle
Dragonfly doji candle is a bullish or bearish candle with a long lower wick, and the open/close is near the maximum price.
Conclusion
Candlestick patterns are essential for any trader to at least be familiar with, even if they don’t directly incorporate them into their trading strategy. These charts are one of the most basic tools for any trader or investor. Not only do they provide a visual representation of the price performance for a given asset, but they also offer certain flexibility to analyze the data over different time frames.
While candlesticks can be useful for analyzing markets, it is necessary to remember that they are not based on principles or scientific laws. Instead, they convey and visualize the buying and selling forces that ultimately drive the markets.
Extensive study of candlestick charts and patterns, combined with an analytical mindset and enough practice, may eventually give traders a comparative advantage. However, most traders and investors agree that it is also significant to consider other methods, such as fundamental analysis.