How to Trade Triangle Patterns in the forex market?


Triangle Patterns are one of the most common patterns in technical analysis, which indicate the reduction of price fluctuations in a certain range.
In this guide, we’ll dive into the intricacies of trading triangle patterns, exploring their formation, significance, and the best strategies for capitalizing on these market signals. Whether you're a seasoned trader or just starting out, mastering these patterns can enhance your ability to predict market movements.
Join us as we unravel the secrets behind triangle patterns and help you navigate the Forex landscape with confidence. Get ready to transform your trading approach and unlock new opportunities!
Contents
What Are Triangle Patterns?
Triangle patterns are technical indicators in Forex trading, formed when the price of a currency pair moves within a converging range. This happens when two trendlines—one ascending and one descending—come together to form a triangular shape on a price chart.
These patterns signal a period of consolidation in the market, often leading to a breakout when the price moves decisively out of the triangle.
Types of Triangle Patterns
In Forex trading, triangle patterns come in four varieties: wedge, ascending, descending, and symmetrical.
Wedge Triangle
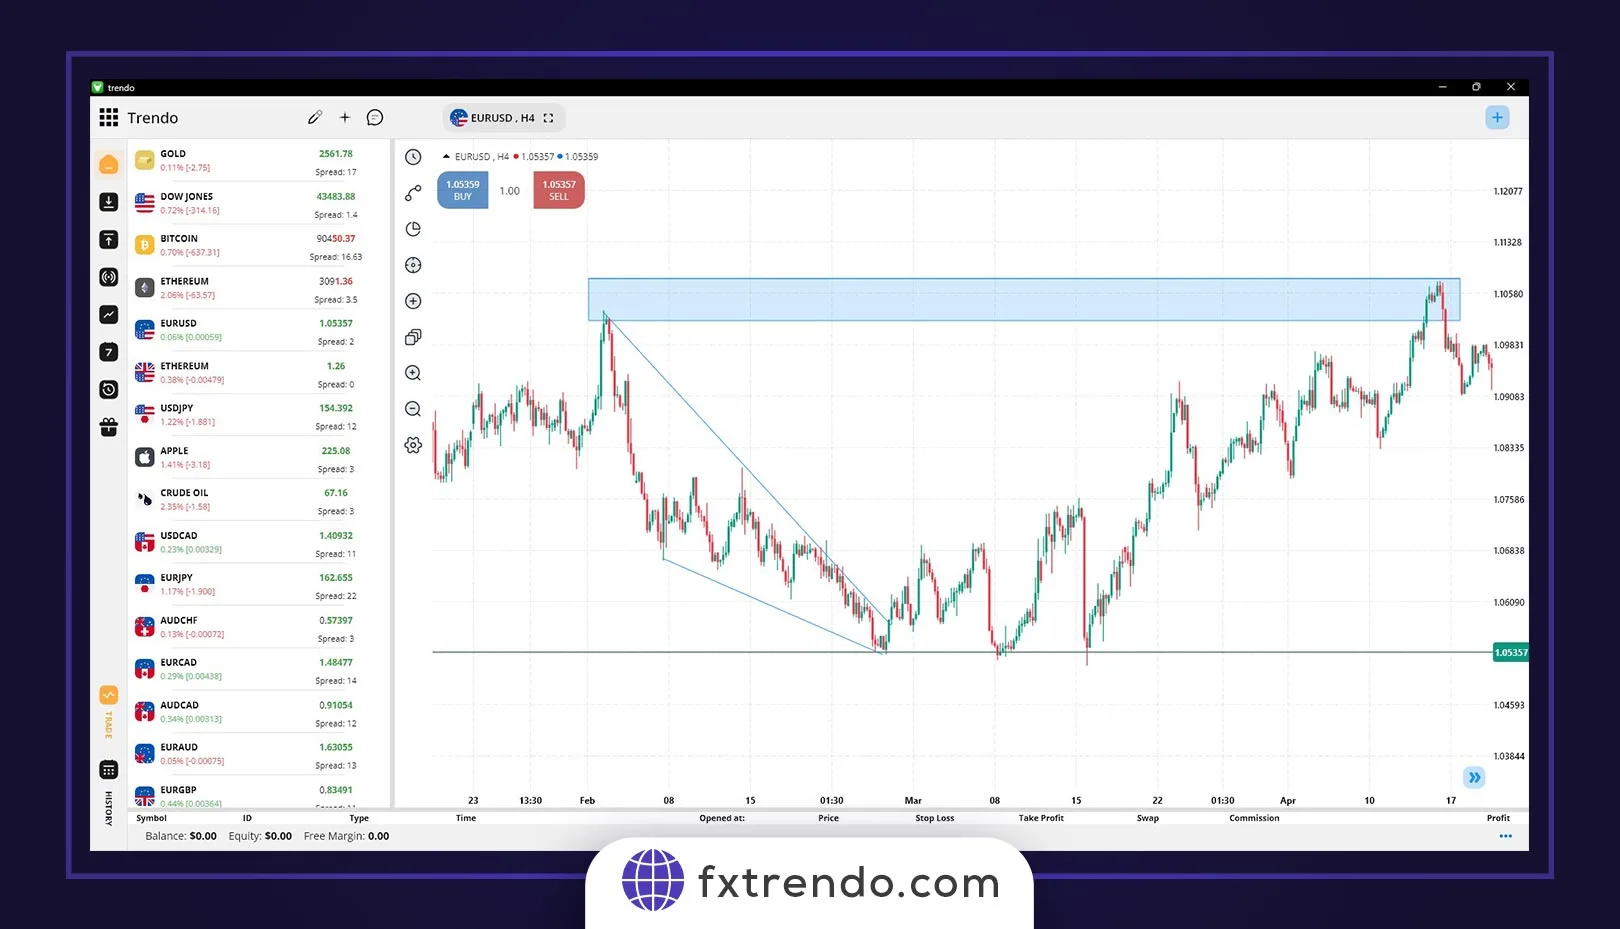
A wedge triangle forms when the price moves within two converging trendlines that slope in the same direction. There are rising and falling wedges. A rising wedge indicates buyers are losing momentum, often leading to a bearish reversal. Below you can see an example of a wedge pattern in the USDCAD currency pair .
An example of a wedge pattern in the USDCAD currency pair
A falling wedge suggests potential bullish momentum as sellers lose control. Recognizing this pattern helps traders anticipate market shifts.
Symmetrical Triangle
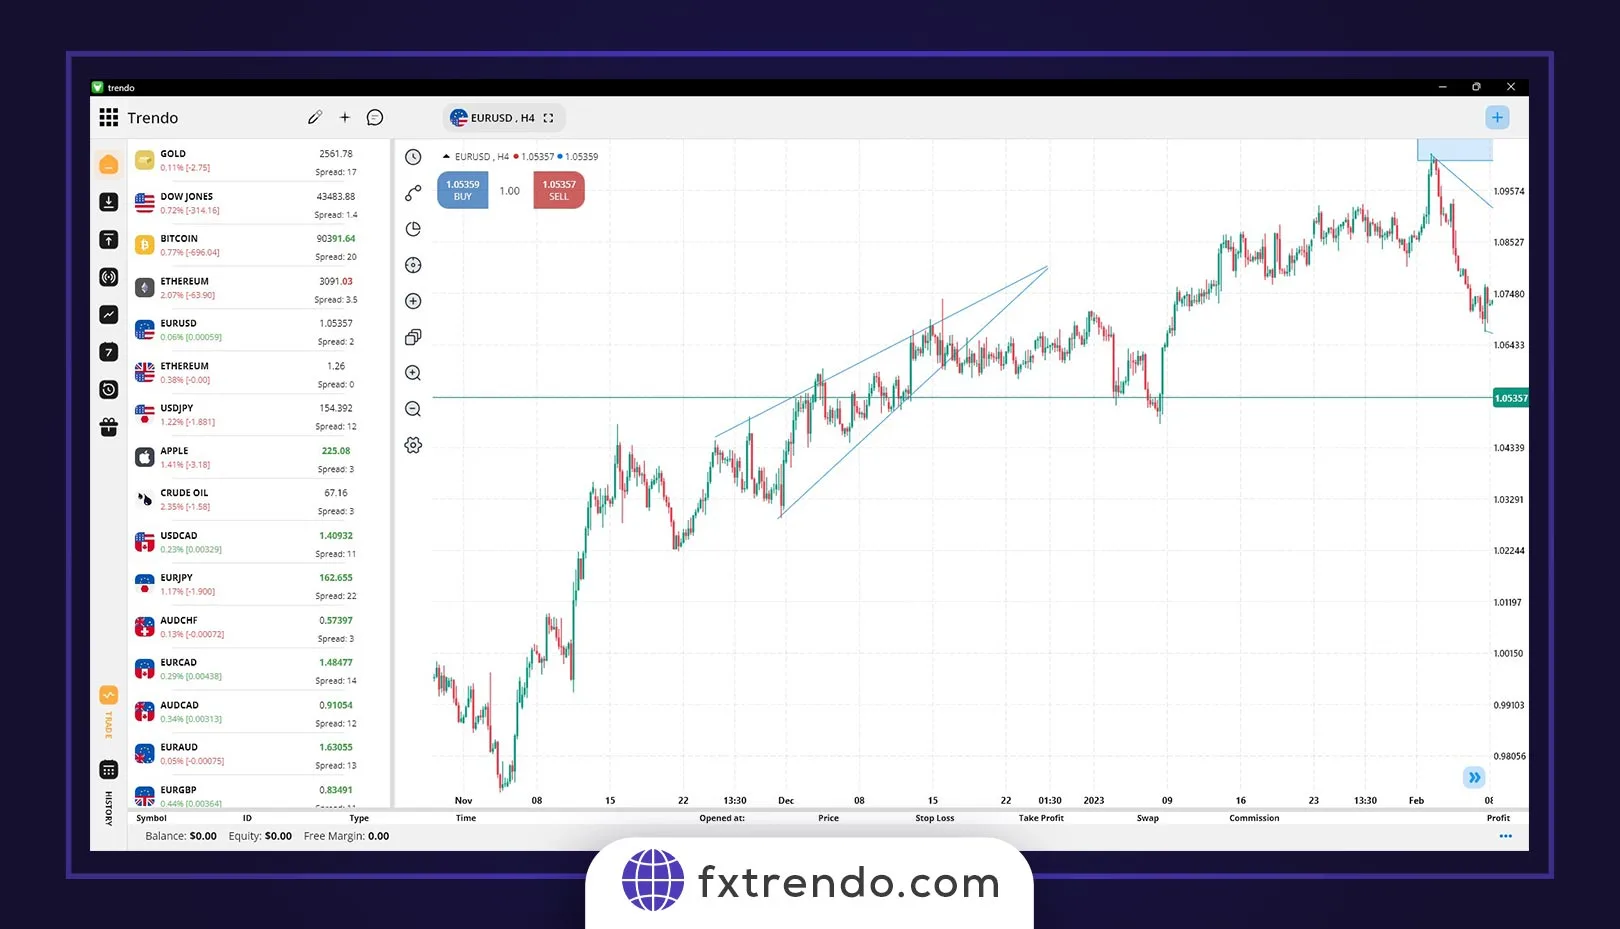
The symmetrical triangle has two trendlines that converge, one sloping upwards and the other downwards. This pattern shows indecision in the market, as buyers and sellers are evenly matched. Typically, a breakout occurs in the direction of the preceding trend.
Symmetrical triangle pattern
Symmetrical triangles often appear during consolidation, and understanding them provides insights into potential price movements.
Ascending Triangle
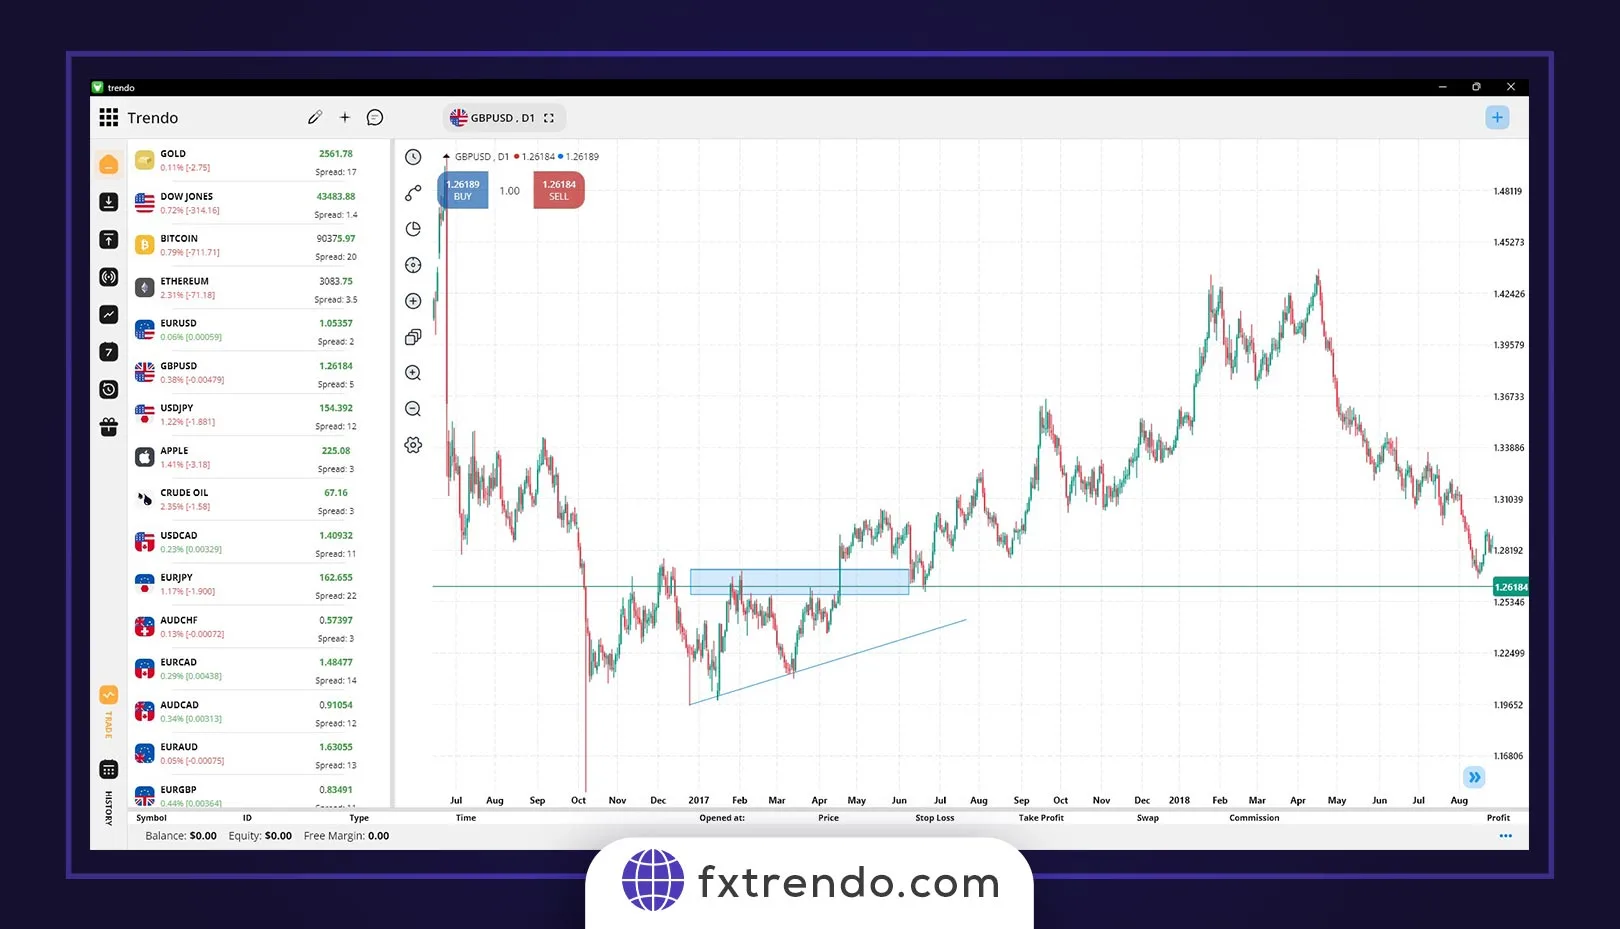
An ascending triangle features a flat upper trendline and an upward-sloping lower trendline. This pattern indicates bullish sentiment, as buyers consistently push prices higher. When the price breaks above the flat resistance line, it often signals upward movement.
Ascending Triangle Pattern
Traders watch for volume increases at the breakout point to confirm the strength of the move.
Descending Triangle
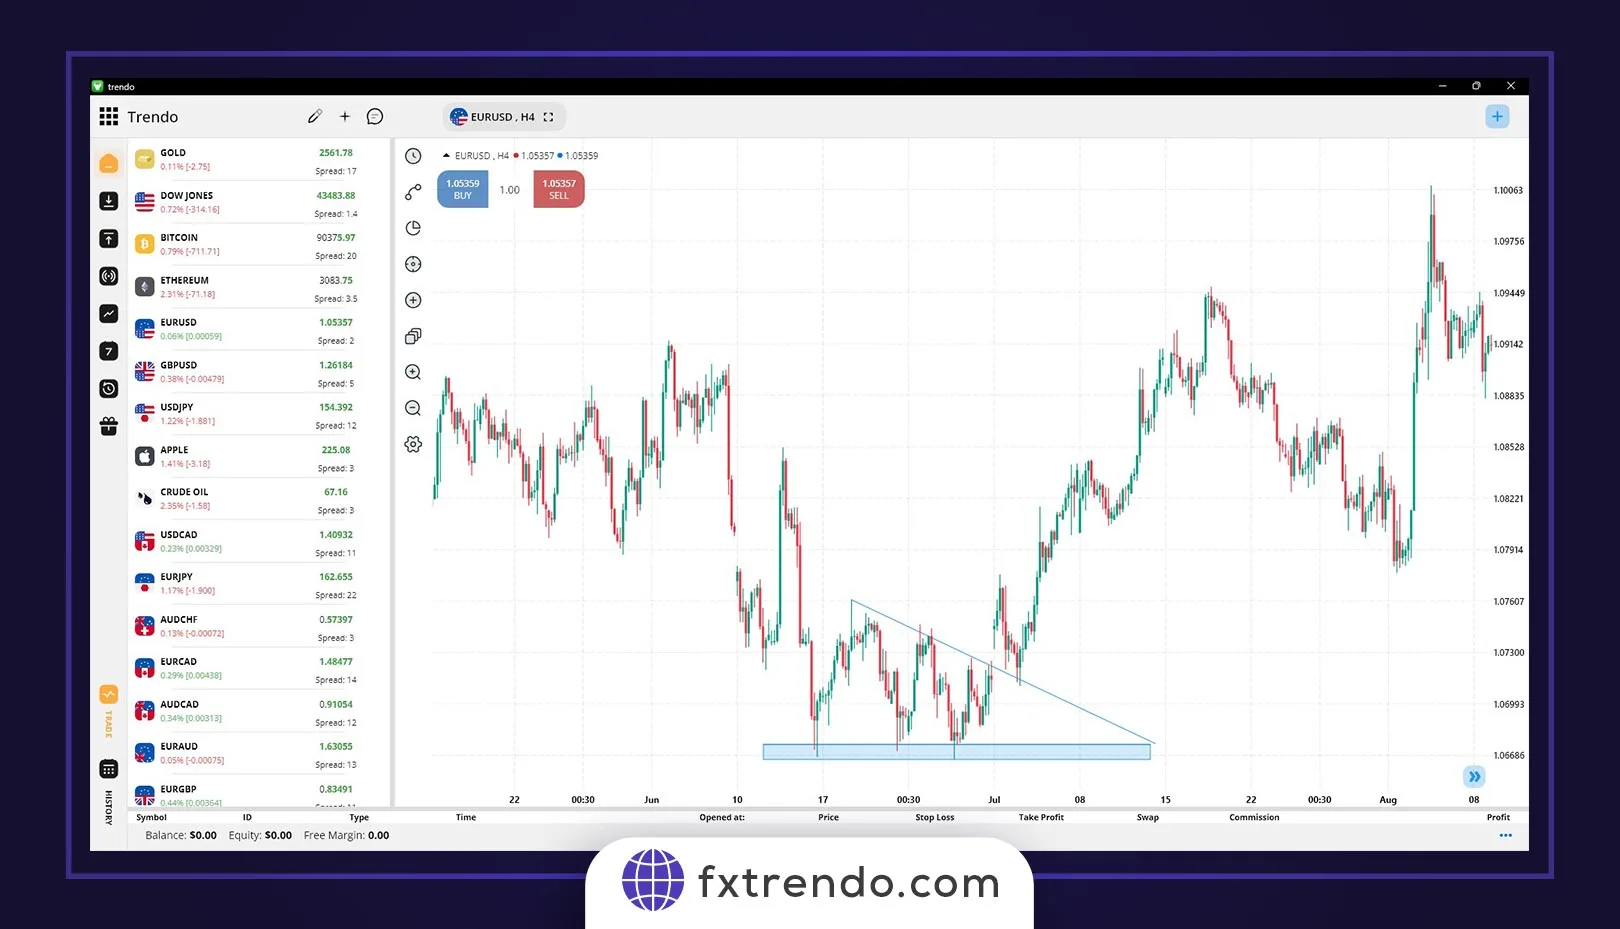
The descending triangle has a flat lower trendline and a downward-sloping upper trendline. This pattern usually signals bearish sentiment, as sellers push prices down while buyers struggle to maintain support. A breakout below the flat support line often indicates further downward movement.
Descending Triangle Pattern
Monitoring volume during this pattern is crucial, as it can confirm the strength of a breakout. Understanding descending triangles helps traders prepare for potential market declines.
Understanding these patterns can help traders make informed decisions by predicting potential market movements. Each pattern provides clues about market sentiment, offering valuable insights for trading strategies.
How to Identify Triangle Patterns in Forex?
Identifying triangle patterns in Forex trading involves recognizing specific formations on price charts. Here's how to spot them:
Ascending Triangle
Look for a flat upper trendline with several touchpoints where the price hits resistance but doesn't break through. The lower trendline should slope upwards, indicating higher lows. This pattern suggests that buyers are gaining control, and a breakout above the upper trendline is likely.
Descending Triangle
In a descending triangle, the lower trendline is flat, showing a consistent level of support. The upper trendline slopes downwards, reflecting lower highs. This pattern indicates selling pressure is increasing, and a breakout below the lower trendline is expected.
Symmetrical Triangle
For a symmetrical triangle, both the upper and lower trendlines converge towards each other at similar angles, forming a point. This pattern usually signifies a period of consolidation, where the price is preparing for a breakout in either direction. Pay attention to the volume, as it often decreases during the formation and spikes when the breakout occurs.
Wedge Triangle
Wedge patterns can be either rising or falling. A rising wedge forms when the price moves within converging trendlines that slope upwards. This pattern often indicates a bearish reversal. A falling wedge, with converging trendlines sloping downwards, typically signals a bullish reversal. Both wedges suggest that the prevailing trend is losing momentum.
Learning to identify these patterns helps traders anticipate market movements and make strategic trading decisions.
Trading Strategies for Triangle Patterns
Trading triangle patterns in Forex requires a strategic approach to capitalize on potential breakouts. Here’s how to develop effective trading strategies for each type of triangle pattern:
Ascending Triangle
Wait for the price to break above the flat upper trendline, indicating buyers are gaining momentum. Enter a long position (buy) with a stop loss slightly below the previous low within the triangle. Target the breakout's projected move by measuring the height of the triangle and applying it to the breakout point.
Descending Triangle
Watch for a breakout below the flat lower trendline, suggesting sellers are in control. Enter a short position (sell) when the price breaks below the lower trendline, with a stop loss just above the previous high within the triangle. Use the height of the triangle to estimate the potential move and set your target.
Symmetrical Triangle
Wait for the price to break out from either trendline. If the breakout is upwards, enter a long position; if it's downwards, enter a short position. Place stop losses just outside the opposite trendline. Measure the height of the triangle and apply it to the breakout point to set your target.
Wedge Triangle
For a rising wedge, wait for a break below the lower trendline to enter a short position, with a stop loss just above the recent high. For a falling wedge, look for a break above the upper trendline to go long, with a stop loss below the recent low. Measure the wedge's height and project it from the breakout point to set your target.
Following these strategies helps traders navigate triangle patterns and enhance their chances of making profitable trades.
Advanced Tips and Techniques Regarding Trade Triangle Patterns in Forex
Trading triangle patterns effectively requires more than just recognizing their formation. Here are some advanced tips and techniques to enhance your trading strategy:
1. Confirm with Other Patterns
Look for additional patterns or signals that can confirm the triangle pattern. A triangle breakout that coincides with a bullish engulfing candle or a head-and-shoulders pattern can strengthen your trade confidence.
2. Set Clear Entry and Exit Points
Determine your entry and exit points based on the pattern. For breakouts, enter just above the resistance line for ascending triangles or just below the support line for descending triangles. Use recent highs and lows to set your stop-loss levels.
3. Watch for False Breakouts
Be cautious of false breakouts. Look for a significant increase in volume and a strong close beyond the breakout point to confirm the move. If the price quickly returns within the triangle, it may signal a false breakout.
4. Utilize Multiple Time Frames
Analyze triangle patterns across different time frames. A pattern on a daily chart carries more weight than one on a 5-minute chart. Multi-timeframe analysis can provide a clearer picture of the market trend.
5. Adjust Your Risk Management Strategy
Adjust your risk management due to the volatility around triangle patterns. Use smaller position sizes and wider stop-loss levels to accommodate potential price swings. This approach helps protect your capital.
6. Practice Patience and Discipline
Triangle patterns take time to develop, so wait for the pattern to complete and for a clear breakout before entering a trade. Avoid rushing based on emotions; sticking to your trading plan is crucial.
7. Monitor Trading Volume
Keep an eye on trading volume during the formation of triangle patterns. An increase in volume indicates greater trader participation in the current trend.
8. Consider Trend Context
If a triangle pattern forms outside of a prevailing trend, the likelihood of a breakout increases. Understanding the market context can improve your trading decisions.
9. Use Technical Analysis Tools
Incorporate other technical analysis tools to confirm the trend and the likelihood of success for the pattern. This can provide additional insights into market dynamics.
10. Always Use Stop-Loss Orders
Utilize stop-loss orders to manage risk. In triangle pattern trades, place your stop-loss just beyond the opposite side of the triangle to safeguard your capital.
By following these tips and techniques, you can enhance your chances of success when trading triangle patterns. With practice and discipline, you'll be better equipped to navigate the Forex market.
Read more: Terms of activating the Trendo Broker Welcome Bonus.
Conclusion
In this article, we’ve explored the different types of triangle patterns, how to identify them, and strategies for trading with them. Remember, these patterns are tools to predict future price trends, but they don’t guarantee success in trading. It’s essential to complement them with other technical and fundamental analysis tools to mitigate risks.
Trading with triangle patterns requires experience and live market practice. You can start your trading journey using a welcome bonus from Trendo brokers, offering a risk-free option to dive into the exciting world of trading.
FAQ
How do you trade triangle patterns in forex?
What is the most successful pattern in forex?
What are the different types of triangle trading?
What is triangle strategy in trading?
What is the success rate of the ascending triangle?
Are triangle patterns bullish or bearish?
Article similaire
Le plus visité
0


