


What Is the Gartley Pattern and How to Trade it? Ultimate Guide to Trading with the Gartley Pattern

Gartley pattern is one of the most widely used technical analysis patterns, which is formed based on Fibonacci ratios in both ascending and descending states in the market.
By identifying specific price movements and retracements, traders can make informed decisions and optimize their trading strategies.
In this ultimate guide, we’ll delve into the intricacies of the Gartley Pattern, exploring its formation, key components, and practical applications.
Whether you’re a seasoned trader or just starting out, understanding how to trade with the Gartley Pattern can give you a significant edge in the financial markets.
Get ready to enhance your trading skills and achieve your financial goals with this comprehensive guide.
Contents
What Is the Gartley Pattern?
The Gartley Pattern is a harmonic chart pattern used in technical analysis to predict potential market reversals. Introduced by H.M. Gartley in his 1935 book “Profits in the Stock Market,” this pattern is based on Fibonacci numbers and ratios.
It consists of four distinct price movements, labeled XA, AB, BC, and CD, which form a specific geometric shape on a price chart. The key to identifying the Gartley Pattern is recognizing these price movements and their corresponding Fibonacci retracements.
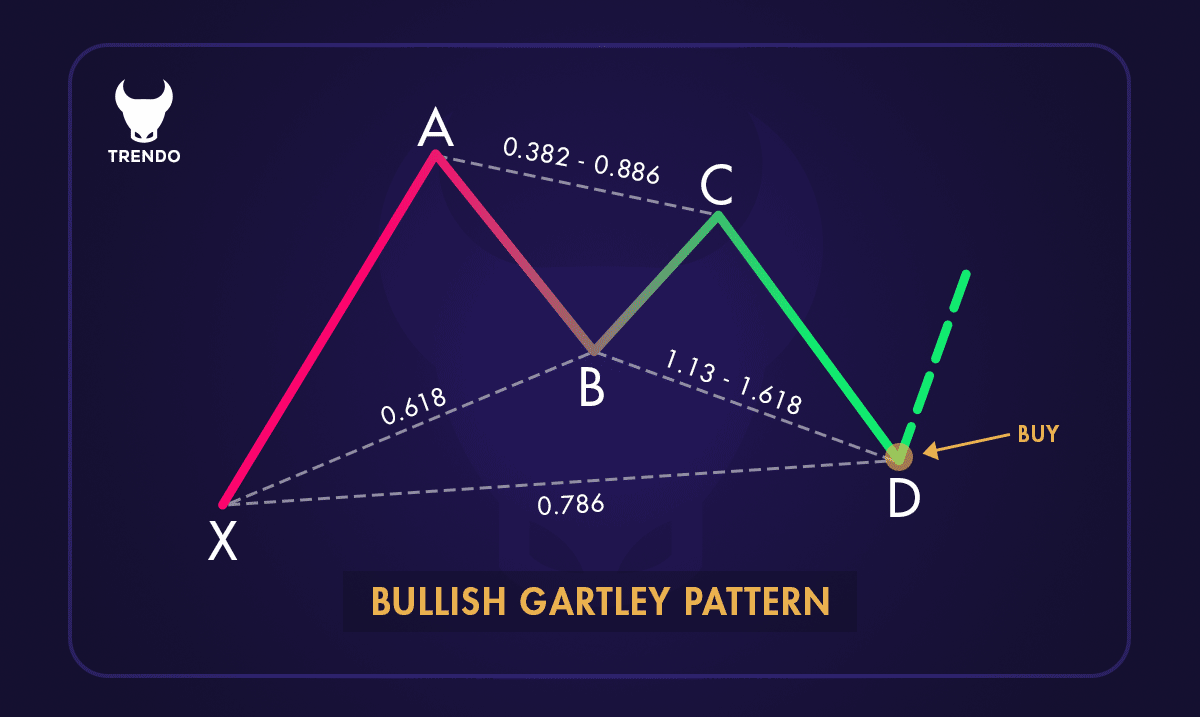
Ascending (Bullish) Gartley pattern
When correctly identified, the Gartley Pattern can help traders make informed decisions by highlighting potential entry and exit points in the market.
This pattern is widely used by traders to enhance their trading strategies and improve their chances of success.
How the Gartley Pattern Works?
The Gartley Pattern identifies specific price movements and retracements that form a unique geometric shape on a price chart. This pattern is based on Fibonacci ratios, which help traders pinpoint potential reversal zones in the market. The pattern consists of four main legs: XA, AB, BC, and CD.
XA: The initial price move.
AB: A retracement of the XA move, typically around 61.8% of XA.
BC: A retracement of the AB move, usually between 38.2% and 88.6% of AB.
CD: The final leg, which is an extension of the BC move, often reaching 127.2% to 161.8% of BC.
When these legs align correctly, they form the Gartley Pattern, indicating a potential reversal point. Traders use this pattern to identify entry and exit points, aiming to capitalize on the predicted market reversal.
Key Characteristics of the Gartley Pattern
The Gartley Pattern is a harmonic chart pattern that helps traders identify potential market reversals. Here are its key characteristics:
1.Fibonacci Ratios: The pattern relies on specific Fibonacci retracement and extension levels. These ratios help determine the points where price movements are likely to reverse.
2.Four Legs: The pattern consists of four distinct price movements: XA, AB, BC, and CD. Each leg has specific Fibonacci retracement levels.
3.Geometric Shape: When plotted on a price chart, the Gartley Pattern forms a unique geometric shape that resembles the letter “M” or “W,” depending on the market direction.
4.Reversal Points: The pattern highlights potential reversal points in the market, allowing traders to identify entry and exit points for their trades.
5.Confirmation: Traders often use additional technical analysis tools to confirm the validity of the Gartley Pattern before making trading decisions.
Types of Gartley Patterns
The Gartley Pattern comes in two main types: the Bullish Gartley and the Bearish Gartley. Both patterns predict potential market reversals but appear in different market conditions.
1. Bullish Gartley Pattern: Forms during a downtrend and signals a potential reversal to an uptrend. It starts with a significant price drop (XA), followed by a partial retracement (AB). The price then moves down again (BC) but not as low as the initial drop, and finally, it makes a final move up (CD) to complete the pattern. Traders look for buying opportunities when the pattern completes.
2. Bearish Gartley Pattern: Appears during an uptrend and indicates a potential reversal to a downtrend. It begins with a strong price increase (XA), followed by a partial retracement (AB). The price then moves up again (BC) but not as high as the initial rise, and finally, it makes a final move down (CD) to complete the pattern. Traders look for selling opportunities when the pattern completes.
How to Identify a Gartley Pattern?
Identifying a Gartley Pattern involves recognizing a specific sequence of price movements on a chart. This pattern is made up of five key points: X, A, B, C, and D. Here’s a step-by-step guide to spot it:
1. Locate Point X: Start with an initial significant price move, either up or down. This is your point X.
2. Measure XA and Retrace to B: From point X, identify the next move to point A. Then, look for a retracement from A to B. Point B should align with a 61.8% or 78.6% retracement of the XA move.
3. Identify BC: From point B, the price should move to point C. This move should be a retracement of 38.2% to 88.6% of the AB leg.
4. Find CD: The final leg, CD, should extend from point C. This move should be 127.2% to 161.8% of the BC leg.
5. Confirm Point D: Point D is the most critical part of the pattern. It should be a retracement of 78.6% of the initial XA leg. When the price reaches point D, it suggests a potential reversal.
By following these steps and using Fibonacci retracement levels, you can accurately identify the Gartley Pattern. Recognizing this pattern can help you anticipate market reversals and make more informed trading decisions.
How to Trade the Gartley Pattern?
Trading the Gartley Pattern involves recognizing the pattern and making strategic trades based on its formation. Here’s a step-by-step guide:
1. Identify the Pattern: Look for the Gartley Pattern on your price chart, ensuring the XA, AB, BC, and CD legs align with the specific Fibonacci retracement and extension levels.
2. Confirm the Pattern: Use additional technical analysis tools, such as trend lines or moving averages, to confirm the pattern.
3. Set Entry Points: For a Bullish Gartley Pattern, place a buy order at point D, where the pattern completes. For a Bearish Gartley Pattern, place a sell order at point D.
4. Determine Stop-Loss Levels: Set your stop-loss slightly below point X for a bullish pattern or slightly above point X for a bearish pattern to manage risk.
5. Set Profit Targets: Use Fibonacci extension levels to set your profit targets. Common targets are 61.8%, 100%, and 127.2% of the CD leg.
By following these steps, traders can effectively trade the Gartley Pattern and potentially capitalize on market reversals.
Advantages and Limitations of the Gartley Pattern
The Gartley Pattern offers several advantages for traders:
Advantages:
1. High Probability of Success: When identified correctly, the Gartley Pattern can provide high-probability trading opportunities.
2. Clear Entry and Exit Points: The pattern offers specific entry and exit points based on Fibonacci retracement levels, making it easier to plan trades and manage risk.
3. Versatility: The Gartley Pattern can be applied across various markets, including stocks, forex, commodities, and cryptocurrencies. It works on different time frames, from intraday to long-term charts.
4. Predictive Power: By using Fibonacci ratios, the pattern helps predict potential reversal points, allowing traders to anticipate market movements.
However, the Gartley Pattern also has its limitations:
Limitations:
1. Complexity: Identifying the Gartley Pattern requires a good understanding of Fibonacci retracement levels and precise measurements. This can be challenging for beginners.
2. Subjectivity: The pattern’s effectiveness depends on the trader’s ability to accurately identify the key points (X, A, B, C, and D). Different traders might interpret the same chart differently.
3. Market Conditions: The pattern may not perform well in consolidating or highly volatile markets. It is most effective in trending markets where price movements are more predictable.
4. False Signals: Like any technical analysis tool, the Gartley Pattern is not foolproof. It can produce false signals, leading to potential losses if not used with proper risk management techniques.
Gartley Pattern vs. Other Harmonic Patterns
The Gartley Pattern is one of several harmonic patterns used in technical analysis to predict market reversals. Here’s how it compares to other harmonic patterns like the Butterfly, Bat, and Crab patterns:
Gartley Pattern: This pattern is the most common harmonic pattern and is characterized by its specific Fibonacci retracement levels. It typically forms an “M” shape in a bullish market and a “W” shape in a bearish market. The Gartley Pattern is known for its high probability of success when identified correctly.
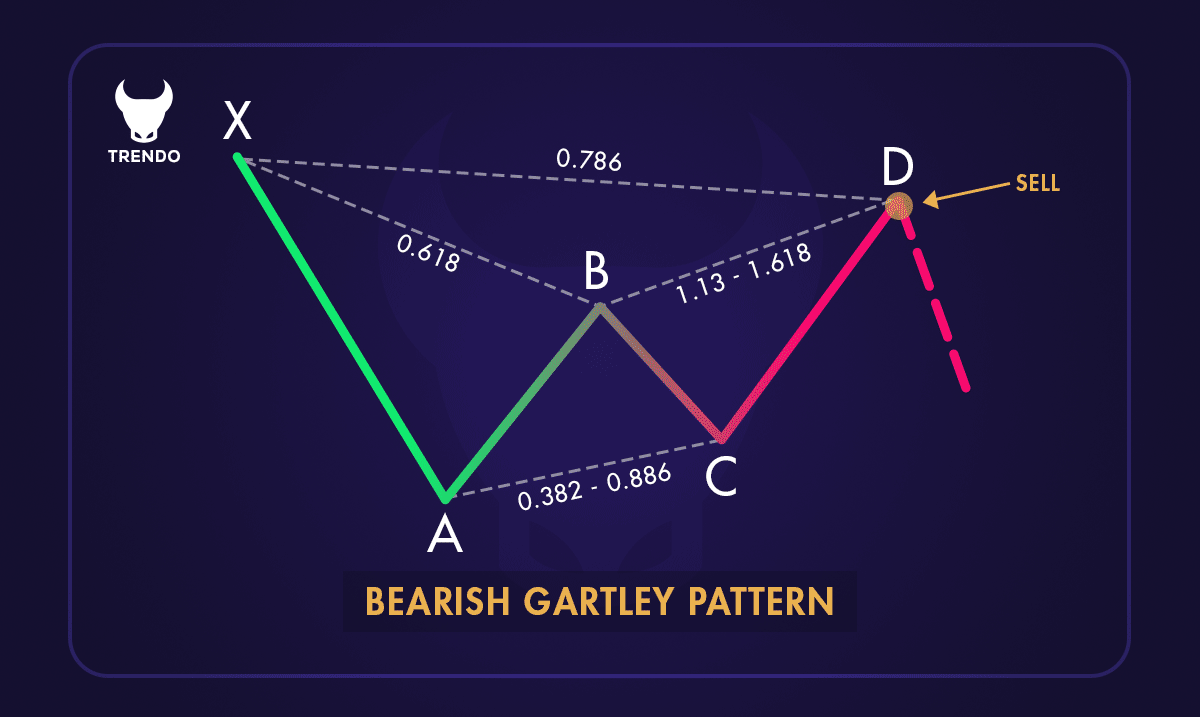
A Bearish Gartley pattern
Butterfly Pattern: The Butterfly Pattern is similar to the Gartley but has different Fibonacci levels. It extends beyond the Gartley Pattern, with point D often exceeding the starting point X. This pattern can signal stronger reversals and is used to identify potential trend changes.
Bat Pattern: The Bat Pattern is another variation with its own unique Fibonacci ratios. It is more conservative than the Butterfly, with point D typically falling within the range of the initial XA leg. This pattern is useful for identifying less aggressive reversals.
Crab Pattern: The Crab Pattern is known for its extreme Fibonacci extensions. Point D in this pattern can extend significantly beyond point X, indicating strong reversal signals. This pattern is often used in highly volatile markets where large price swings are common.
Each of these patterns has its own strengths and weaknesses. The Gartley Pattern is favored for its balance between reliability and simplicity, while the Butterfly, Bat, and Crab patterns offer alternatives for different market conditions and trading styles.
Tips for Mastering Gartley Pattern Trading
Mastering the Gartley Pattern requires practice, patience, and a solid understanding of its principles. Here are some tips to help you become proficient in trading with this pattern:
1. Study the Basics: Familiarize yourself with the Gartley Pattern’s structure, including the XA, AB, BC, and CD legs, and the specific Fibonacci retracement and extension levels.
2. Use Reliable Tools: Utilize charting software and tools that can accurately plot Fibonacci levels and identify potential Gartley Patterns.
3. Practice on Demo Accounts: Before trading with real money, practice identifying and trading the Gartley Pattern on a demo account to build your confidence and skills.
4. Combine with Other Indicators: Use additional technical indicators, such as moving averages or trend lines, to confirm the validity of the Gartley Pattern and enhance your trading strategy.
5. Set Clear Entry and Exit Points: Determine your entry and exit points based on the pattern’s completion and use stop-loss orders to manage risk.
6. Stay Updated: Keep up with market news and trends that may impact price movements and the effectiveness of the Gartley Pattern.
7. Review and Learn: Regularly review your trades to understand what worked and what didn’t, and continuously refine your strategy.
By following these tips, you can improve your ability to trade the Gartley Pattern and increase your chances of success in the financial markets.
Conclusion
The Gartley Pattern is a powerful tool in technical analysis, offering traders a structured method to predict market reversals. By understanding its key components and how to identify it, traders can make informed decisions.
Trading the Gartley Pattern involves recognizing specific price movements and using Fibonacci retracement levels to set entry and exit points.
While it has its complexities and limitations, mastering this pattern can enhance your trading strategy and improve outcomes.
Whether you’re new to trading or looking to refine your skills, the Gartley Pattern is a valuable addition to your toolkit.
Frequently Asked Questions (FAQs)
How to trade Gartley pattern?
How accurate is the Gartley pattern?
How to draw a Gartley pattern?
What is the success rate of Gartley pattern trades?
Can the Gartley pattern be used in Forex, stocks, and crypto markets?
How long does it take to learn to trade with harmonic patterns?
What is the most powerful pattern in trading?
Related Post
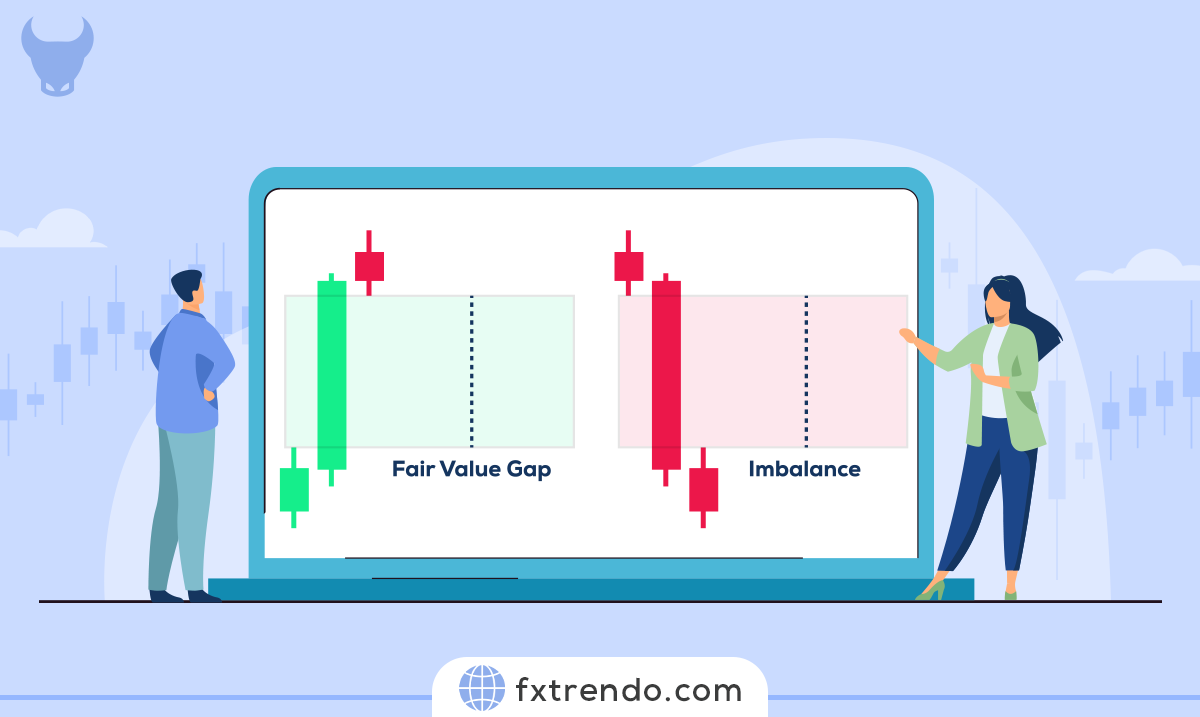
What is Fair Value Gap (FVG) in Forex & How to Use it in Trading?
In the dynamic world of forex trading, understanding and leveraging market inefficiencies can set you apart. One such inefficiency, the Fair Value Gap (FVG), has garnered attention among traders for its potential to signal profitable opportunities. But what exactly is an FVG, and how can it be used to enhance your trading strategy?

What Is EUR/USD? A Complete Review for the Euro-Dollar Symbol (EURUSD)
The foreign exchange market, or Forex, stands as one of the most dynamic and pivotal markets in the world. Encompassing the buying and selling of currencies, it's the heartbeat of global trade and investment. With a daily trading volume surpassing $6 trillion, Forex is where fortunes are made and lost in the blink of an eye.

What are the trading hours of different types of international financial markets?
Understanding the various types of international financial markets and their trading hours is crucial for any professional trader. This knowledge allows you to take advantage of diverse trading opportunities, ultimately enhancing your overall trading performance.
most visited

")


