


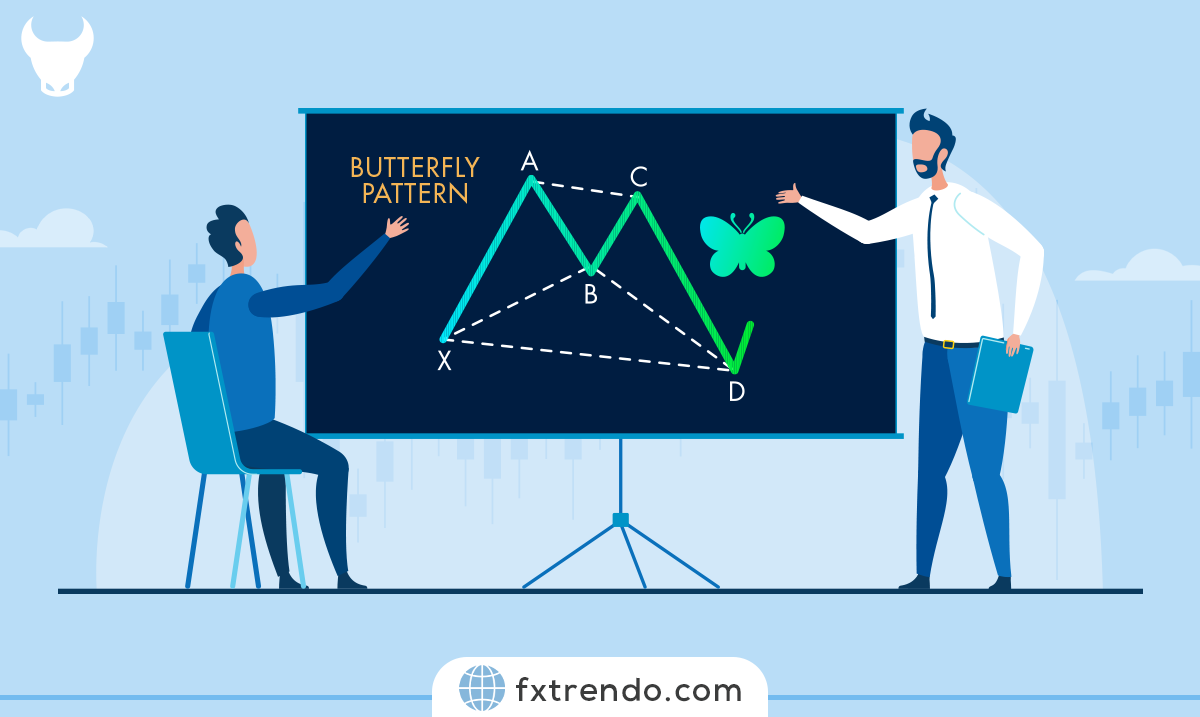
What Is the Butterfly Pattern? How to trade with Butterfly Pattern?
The Butterfly Harmonic Pattern is a popular reversal pattern among traders that is based on Fibonacci ratios.
This pattern, resembling the wings of a butterfly, is not just visually appealing but also a powerful tool for identifying potential trend reversals. By leveraging specific Fibonacci measurements, traders can pinpoint the end of a current trend and position themselves for the next big move.
Whether you’re a seasoned trader or just starting out, understanding the Butterfly Pattern can give you a significant edge in the market.
In this blog post, we’ll dive deep into what the Butterfly Pattern is, how it works, and most importantly, how you can trade with it effectively.
Ready to spread your wings and soar in the trading world? Let’s get started!
Contents
What is the Butterfly Pattern?
The Butterfly Pattern is a harmonic chart pattern used in technical analysis to predict market reversals. It consists of four price movements: X-A, A-B, B-C, and C-D, forming a shape that looks like a butterfly. This pattern is precise, relying on specific Fibonacci ratios to identify key market turning points.
Traders use the Butterfly Pattern to identify potential price trend reversals. Recognizing this pattern helps them make informed decisions about entering or exiting trades.
The key is accurately identifying the Fibonacci levels and understanding the market context.
Types of Butterfly Patterns
The Butterfly Pattern has two main types: Bullish and Bearish. Both help traders spot potential market reversals but signal different directions.
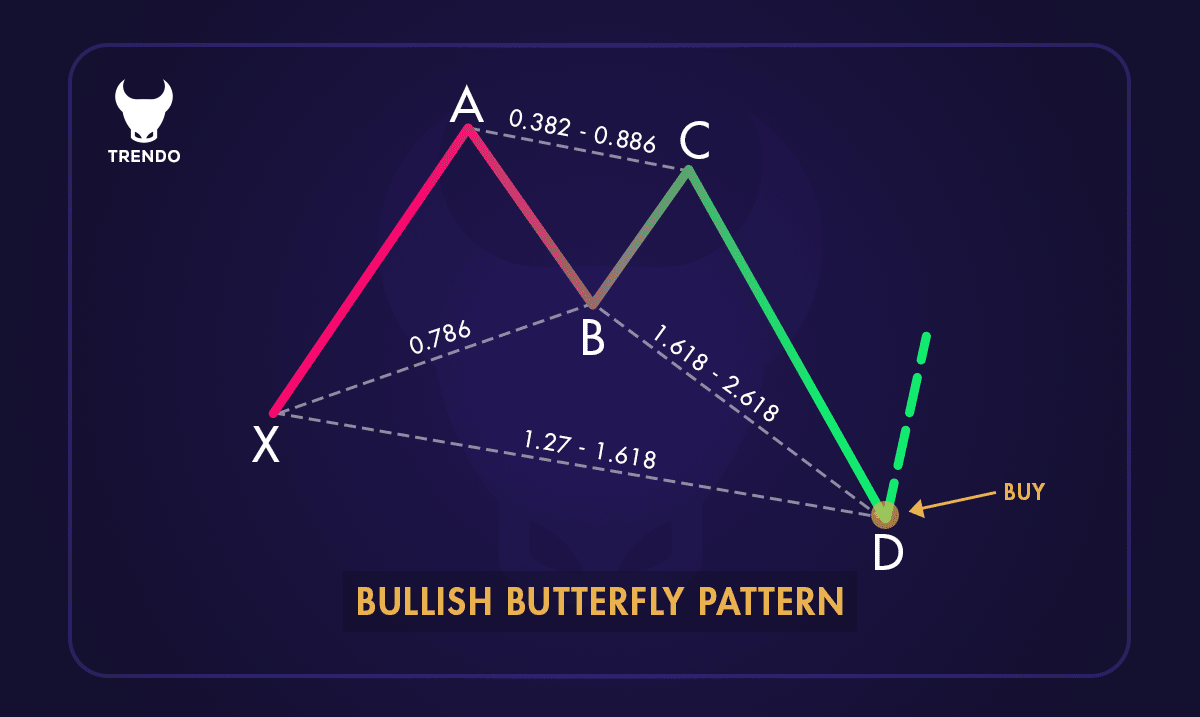
Bullish Butterfly Pattern
The Bullish Butterfly Pattern suggests an upward reversal at the end of a downtrend. Here’s how it works:
1. X-A Leg: The initial downward move.
2. A-B Leg: An upward retracement, typically 78.6% of the X-A leg.
3. B-C Leg: Another downward move, retracing 38.2% to 88.6% of the A-B leg.
4. C-D Leg: The final upward move, extending 127.2% to 161.8% of the X-A leg.
Ascending (Bullish) Butterfly Pattern
When the pattern completes, traders look for buying opportunities, expecting a price increase.
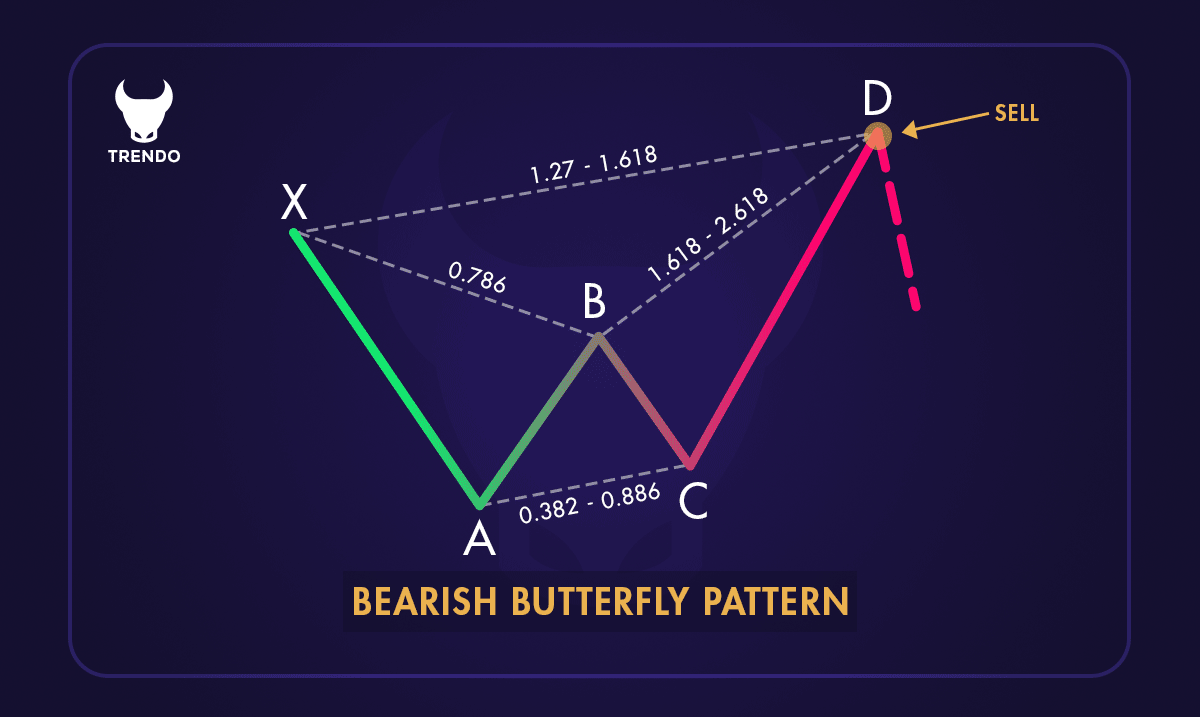
Bearish Butterfly Pattern
The Bearish Butterfly Pattern signals a downward reversal at the end of an uptrend. Here’s the breakdown:
1. X-A Leg: The initial upward move.
2. A-B Leg: A downward retracement, typically 78.6% of the X-A leg.
3. B-C Leg: Another upward move, retracing 38.2% to 88.6% of the A-B leg.
4. C-D Leg: The final downward move, extending 127.2% to 161.8% of the X-A leg.
Bearish Butterfly Pattern
Upon completion, traders look for selling opportunities, anticipating a price drop.
Key Components of the Butterfly Pattern
The Butterfly Pattern consists of four key components, each representing a specific price movement. Understanding these components is crucial for identifying and trading this pattern effectively.
1. X-A Leg: The initial price movement, either upward or downward, sets the foundation for the pattern.
2. A-B Leg: This leg retraces the X-A leg, typically reaching 78.6% of the X-A distance. It marks the first reversal.
3. B-C Leg: The B-C leg moves in the same direction as the X-A leg, retracing between 38.2% and 88.6% of the A-B leg. This leg confirms the pattern’s formation.
4. C-D Leg: The final leg extends beyond the X-A leg, often reaching 127.2% to 161.8% of the X-A leg. This leg completes the pattern and signals a potential reversal point.
Each of these legs is defined by specific Fibonacci ratios, essential for the pattern’s accuracy. Traders use these ratios to identify precise reversal points.
By understanding these components, traders can better anticipate market movements and make informed decisions.
How to Identify the Butterfly Pattern?
Identifying the Butterfly Pattern involves recognizing its shape and specific Fibonacci ratios. Here’s a step-by-step guide:
1. Locate the X-A Leg: Identify the initial price movement from point X to point A, either upward or downward.
2. Measure the A-B Leg: Find the retracement from point A to point B, which should be about 78.6% of the X-A leg.
3. Identify the B-C Leg: Look for the price movement from point B to point C, moving in the same direction as the X-A leg and retracing between 38.2% and 88.6% of the A-B leg.
4. Determine the C-D Leg: Identify the last leg from point C to point D, extending beyond the X-A leg, typically reaching 127.2% to 161.8% of the X-A leg.
Identifying Entry Points for Bullish and Bearish Setups
Bullish Butterfly Pattern: Forms at the end of a downtrend. When the C-D leg completes, it signals a potential upward reversal. Traders look for buying opportunities here.
Bearish Butterfly Pattern: Forms at the end of an uptrend. When the C-D leg completes, it signals a potential downward reversal. Traders look for selling opportunities here.
Tools for Detecting Butterfly Patterns
Fibonacci Retracement Tool: Measures the retracement levels of each leg in the pattern. Applying this tool to the X-A, A-B, and B-C legs helps identify the key levels defining the Butterfly Pattern.
Charting Software: Many trading platforms offer built-in tools to detect harmonic patterns, including the Butterfly Pattern. These tools can automatically highlight potential patterns on your charts.
By following these steps and using the right tools, you can identify the Butterfly Pattern and use it to anticipate market reversals, helping you make informed trading decisions.
How to Trade Using the Butterfly Pattern?
Trading with the Butterfly Pattern involves a few key steps:
1. Identify the Pattern: Spot the Butterfly Pattern on your price chart. Look for the distinct X-A, A-B, B-C, and C-D legs, ensuring they match the specific Fibonacci ratios.
2. Confirm the Pattern: Use the Fibonacci retracement tool to verify the retracement levels of each leg.
3. Wait for Completion: Allow the pattern to complete at point D, where the potential reversal is expected.
4. Enter the Trade:
Bullish Setup: Enter a buy order at point D if the pattern suggests a bullish reversal.
Bearish Setup: Enter a sell order at point D if the pattern indicates a bearish reversal.
5. Set Stop-Loss: Place a stop-loss order to manage risk. For a bullish setup, set the stop-loss below point D. For a bearish setup, set it above point D.
6. Take Profits: Consider taking partial profits at key Fibonacci retracement levels, such as 38.2%, 50%, and 61.8% of the C-D leg.
By following these steps and using the right tools, you can effectively trade using the Butterfly Pattern, helping you anticipate market reversals and make informed decisions.
Advantages of Trading the Butterfly Pattern
Trading the Butterfly Pattern offers several advantages:
1. High Accuracy: The Butterfly Pattern uses specific Fibonacci ratios to pinpoint potential reversal points with high accuracy, leading to reliable trading signals.
2. Clear Entry and Exit Points: The pattern provides well-defined entry and exit points, helping traders set up trades with confidence.
3. Effective Risk Management: The pattern allows for clear stop-loss placement, helping traders manage risk and protect their capital.
4. Predictive Power: The Butterfly Pattern is excellent for forecasting market reversals, allowing traders to capitalize on upcoming price movements.
5. Versatility: This pattern can be used in various markets, including forex, stocks, and commodities, making it a valuable tool for different asset classes.
6. Enhanced Profit Potential: By identifying reversal points accurately, traders can enter trades at optimal levels, maximizing profit potential.
Incorporating the Butterfly Pattern into your trading strategy can improve accuracy, provide clear signals, and enhance risk management, ultimately boosting your trading performance.
Challenges and Limitations of the Butterfly Pattern
While the Butterfly Pattern is a powerful tool, it has its challenges and limitations:
1. Complexity: The Butterfly Pattern is complex and requires a good understanding of Fibonacci ratios and precise measurements, which can be challenging for beginners.
2. Identification Difficulty: Spotting the Butterfly Pattern in real-time can be difficult due to its specific price movements and retracements, making it easy to miss or misinterpret.
3. Market Conditions: The pattern’s effectiveness can be influenced by market conditions. In highly volatile or trending markets, the pattern may not form as expected, leading to false signals.
4. Reliance on Other Indicators: To confirm the Butterfly Pattern, traders often need additional technical indicators like moving averages or RSI, complicating the trading process.
5. Time-Consuming: Analyzing and confirming the Butterfly Pattern can be time-consuming, requiring patience and diligence.
6. False Signals: There is always a risk of false signals, where the pattern appears to form but does not result in the expected price movement.
Understanding these challenges and limitations is crucial for effectively using the Butterfly Pattern in trading. By being aware of these potential pitfalls, traders can better manage their expectations and improve their overall strategy.
Best Markets and Timeframes to Use the Butterfly Pattern
The Butterfly Pattern is versatile and can be applied across various markets and timeframes. Here’s where and when to use it effectively:
Best Markets
1. Forex Market: Ideal due to high liquidity and frequent price movements, helping identify reversals in currency pairs.
2. Stock Market: Effective for signaling reversals in individual stocks or indices.
3. Commodities: Useful for predicting price reversals in gold, silver, and oil.
4. Cryptocurrencies: Particularly helpful in spotting reversals in volatile assets like Bitcoin and Ethereum.
Best Timeframes
1. 1-Hour Chart: Balances timely signals with reduced market noise.
2. 4-Hour Chart: Provides a broader market view, making it easier to spot reliable patterns.
3. Daily Chart: Ideal for long-term traders, helping identify significant market reversals and overall trends.
Using the Butterfly Pattern in these markets and timeframes can enhance your trading strategy by providing accurate signals for potential reversals. Understanding where and when to apply this pattern helps make more informed trading decisions.
Tips for Trading with the Butterfly Pattern
Trading with the Butterfly Pattern can be highly effective if done correctly. Here are some practical tips to help you make the most of this pattern:
1. Master the Basics: Before diving into trading, ensure you understand the structure and Fibonacci ratios of the Butterfly Pattern. Familiarize yourself with the X-A, A-B, B-C, and C-D legs and their specific retracement levels.
2. Use Reliable Tools: Utilize tools like the Fibonacci retracement tool to measure the retracement levels accurately. Many trading platforms also offer harmonic pattern indicators that can help identify Butterfly Patterns automatically.
3. Wait for Confirmation: Don’t rush into a trade as soon as you spot a potential Butterfly Pattern. Wait for the pattern to complete at point D and look for additional confirmation signals, such as reversal candlestick patterns or other technical indicators.
4. Set Clear Entry and Exit Points: Define your entry point at the completion of the C-D leg. Set your stop-loss just beyond point D to manage risk. Plan your take-profit levels at key Fibonacci retracement levels, such as 38.2%, 50%, and 61.8% of the C-D leg.
5. Manage Your Risk: Always use a stop-loss order to protect your capital. The Butterfly Pattern can sometimes produce false signals, so it’s crucial to limit potential losses.
6. Practice Patience: Trading with the Butterfly Pattern requires patience. Wait for the pattern to fully form and confirm before entering a trade. Avoid impulsive decisions based on incomplete patterns.
7. Combine with Other Indicators: Enhance the reliability of your trades by combining the Butterfly Pattern with other technical indicators, such as moving averages, RSI, or MACD. This can provide additional confirmation and improve your trading decisions.
8. Backtest Your Strategy: Before applying the Butterfly Pattern in live trading, backtest your strategy on historical data. This helps you understand how the pattern performs under different market conditions and refine your approach.
By following these tips, you can effectively trade using the Butterfly Pattern, improving your chances of success and making more informed trading decisions.
Conclusion
In conclusion, the Butterfly Pattern is a powerful tool in technical analysis, helping traders predict market reversals with high accuracy.
By understanding its structure and specific Fibonacci ratios, traders can identify precise entry and exit points, manage risk effectively, and enhance their trading strategies.
Whether you’re trading in forex, stocks, commodities, or cryptocurrencies, the Butterfly Pattern offers versatility and reliability.
Practice and continuous learning are crucial to mastering this pattern and achieving long-term success in trading.
FAQ
What is the harmonic butterfly pattern target?
Is butterfly bullish or bearish?
What is the butterfly trend in trading?
How do you trade a butterfly harmonic pattern?
To trade a butterfly harmonic pattern:
1. Identify the pattern on the chart using Fibonacci levels.
2. Wait for the pattern to complete at the D point.
3. Enter a trade at the D point, setting a stop-loss just beyond it.
4. Set profit targets at key Fibonacci levels, such as 61.8% and 127.2% of the CD leg.
5. Monitor the trade and adjust as necessary.
Is butterfly a good strategy?
What is the butterfly swap strategy?
What is the success rate of the butterfly strategy?
Related Post
Forex Spreads vs. Commissions: Which Offers the Best Value? | Trendo Broker
Navigating the intricate world of Forex trading can often feel like a strategic game of chess. Every move counts, and understanding the rules is crucial for success.

What Are the Best Forex Currency Pairs to Trade in 2024 for Beginners? | Trendo Broker
Forex trading in 2024 is a journey into a world of opportunity. With knowledge and tools, it can be a profitable venture.
What are The Differences between Leverage in Forex and in Crypto?
Leverage is a powerful tool that can amplify your trading potential, but it comes with its own set of risks and rewards.
most visited

")


 in Forex & How to Use it in Trading?")
