In this article, brought to you by the Trendo educational team, we will explore the concept of fundamental analysis in cryptocurrencies. Join us to uncover essential insights!
What is Fundamental Analysis in Cryptocurrencies?
Fundamental analysis (FA) is a key tool for evaluating the true value of financial assets, and it plays a critical role in the cryptocurrency market. Unlike technical analysis, which focuses on price trends and statistical indicators, fundamental analysis examines essential data and critical project information to identify the intrinsic value and growth potential of digital assets.
In the realm of cryptocurrencies, fundamental analysis evaluates factors like a project’s technology and innovation, the expertise of its development team, its roadmap, real-world applications, and the level of public adoption.
Read more: Types of Technical Analysis in Forex
By considering these influential factors, fundamental analysis seeks to determine an asset’s true worth, offering a comprehensive view that goes beyond market fluctuations. This method provides valuable insights for anyone aiming to make informed decisions in the fast-evolving crypto market.

On-Chain Analysis and Its Difference from Fundamental Analysis
Many people often confuse on-chain analysis with fundamental analysis, assuming they are the same. While both methods are crucial in evaluating cryptocurrencies and often used together, they serve distinct purposes and focus on different aspects of the market.
To illustrate the difference, think of the cryptocurrency market as a stock market. In this analogy, on-chain analysis is akin to analyzing live market data in stock trading. It focuses on publicly available blockchain data, offering insights into sentiment market and participant behavior. This emerging analytical field is unique to cryptocurrencies, enabling traders to predict market movements and understand the actions of different market participants, such as miners or institutional funds.
On-chain analysis provides granular data points, such as wallet balances, transaction volumes, and coin movements. By studying this data, traders can uncover patterns like why market participants are buying or selling. For example, miners might sell coins to cover operational expenses, or hedge funds might offload assets to secure profits.

Read more: Comparing the Forex market & Cryptocurrency; Which one is better?
Key on-chain metrics include:
Active and New Addresses
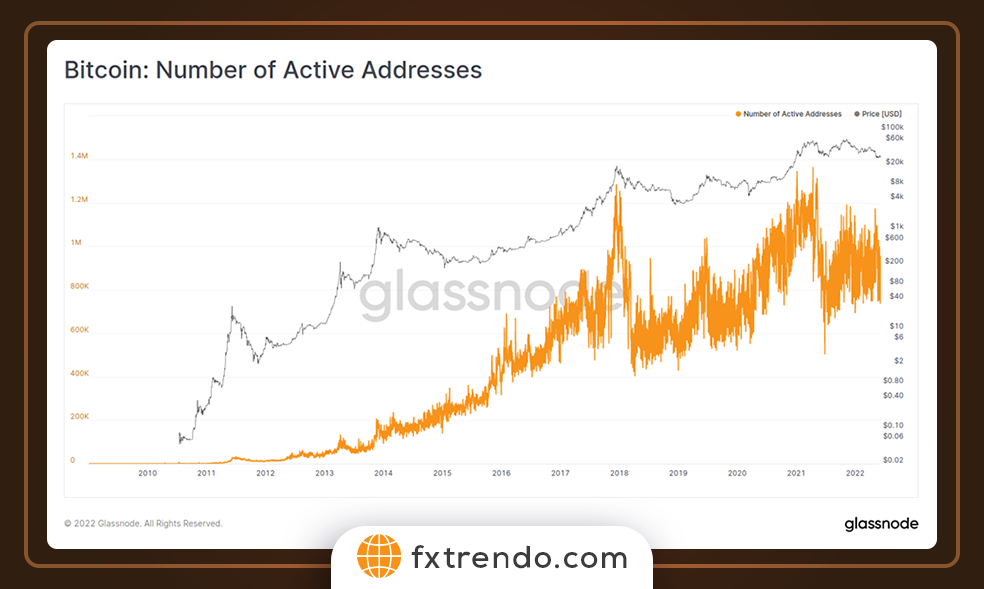
The Active Address Index is a measure of the number of addresses that are active on the Bitcoin network on a daily basis. An increase in the number of active addresses usually indicates greater network usage and a healthy state, while a decrease in activity can indicate a decrease in the number of active users on the network. You can see a graph of active addresses on the Bitcoin blockchain in the image below:
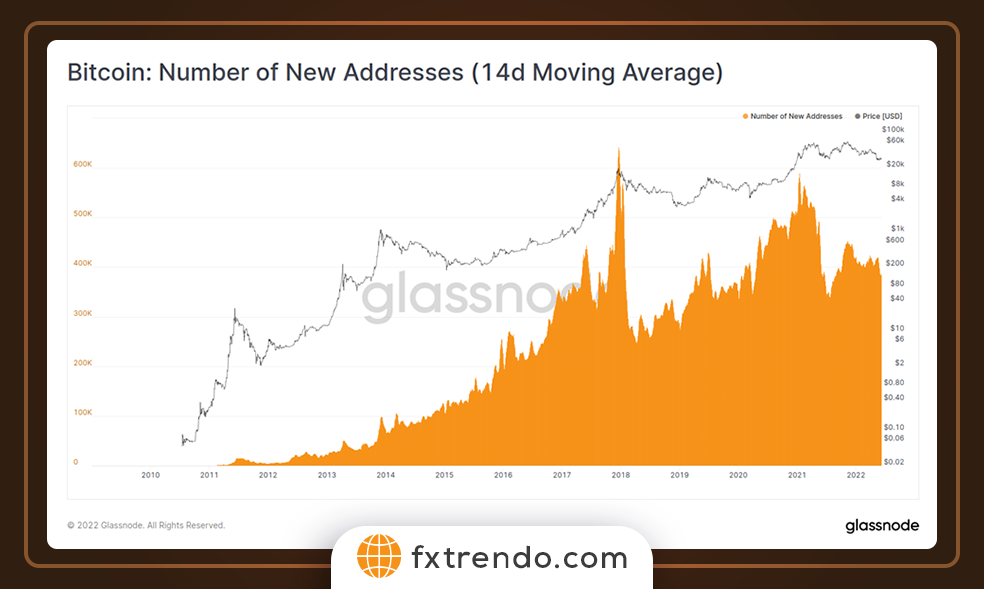
The New Addresses metric, similar to Active Addresses, indicates when an address first appears on the Bitcoin network and receives coins. Since most Bitcoin wallet software generates a new address for each transaction, this metric behaves similarly to Active Addresses.
Analyzing these two metrics allows us to identify peaks and troughs in network activity, which typically correlate with Bitcoin’s bull and bear cycles.
Higher values in these metrics indicate increased user and exchange activity on the network and growth in its profitability, while lower values indicate decreased user engagement and declining profitability.
However, metrics related to on-chain activity are subject to significant short-term fluctuations due to factors such as days of the week, trading hours in different regions of the world, and seasonal variations.
To reduce this daily noise and identify major trends, it is recommended to use a 7- or 14-day moving average. This method helps analysts gain a clearer picture of the network’s status and more accurately assess key trends.
Read more: Types of World Financial Markets and Their Trading Hours
Transaction Count and Volume
This indicator measures the number of transactions confirmed per day and includes all types of transactions, including payments, deposits, withdrawals, and exchange activity. In general, an increase in demand for transactions is a sign of growing network usage. You can see a graph of Bitcoin transaction numbers in the image below:
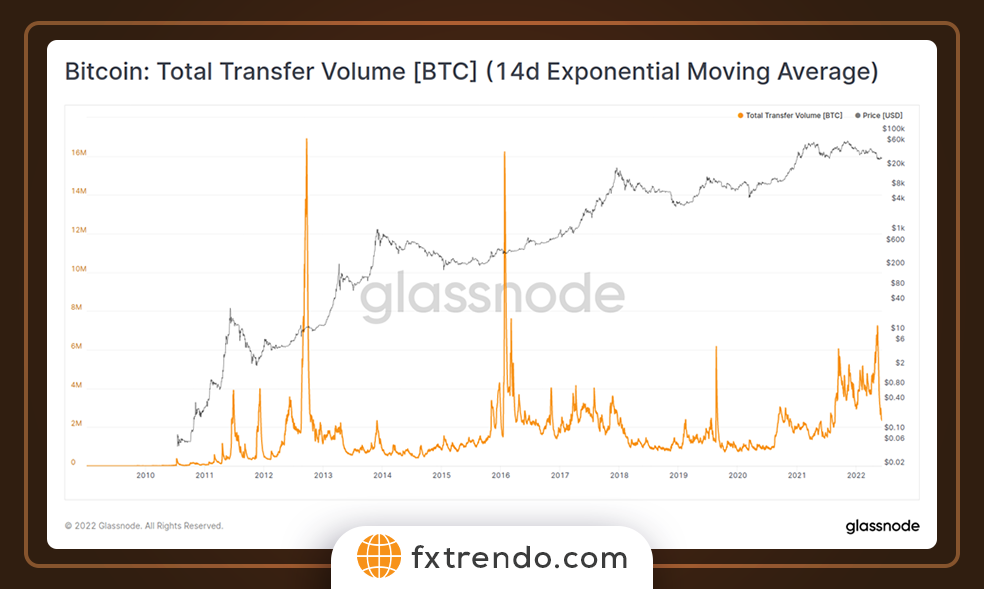
Transaction volume represents the total value of Bitcoins sent across the Bitcoin network each day. For example, an increase in Bitcoin transaction volume typically indicates high levels of network usage and increased demand for the cryptocurrency. Conversely, a decrease in transaction volume can indicate a decrease in demand for Bitcoin and reduced activity on the network.
Network Value to Transactions (NVT)
This indicator is calculated by dividing the market value of a cryptocurrency by the daily transaction volume of its network and is very similar to the price-to-earnings (P/E) ratio in the stock market. In fact, the NVT index indicates whether the current price of a cryptocurrency is reasonable or overpriced, and it can be said that high values of NVT may indicate a price bubble and vice versa.
Market Value to Realized Value (MVRV)
The MVRV index is a popular tool for measuring the overall market condition. It is calculated by dividing the market value of a cryptocurrency by its realized value. In fact, high values of this index can indicate overbought conditions and low values can indicate oversold conditions in the currency in question.
Mayer Multiple
This indicator is calculated by dividing the current price by the 200-day moving average and is a tool for examining long-term market trends. The Mayer Multiple helps investors understand whether the current price is too high or is within a reasonable range. For example, if the Mayer Multiple is greater than 2, it can be considered an overbought indicator.
Unlike fundamental analysis, which evaluates a project’s broader potential (technology, team, adoption, and utility), on-chain analysis delves into blockchain data to capture real-time trends and behaviors. Together, these methods form a powerful toolkit for making informed decisions in the ever-changing crypto landscape.
Advantages and Limitations of Using Fundamental Indicators
Fundamental indicators are powerful analytical tools in the cryptocurrency world, offering valuable insights into the value and growth potential of digital assets. They help investors make more informed decisions and avoid impulsive market reactions. However, like any tool, fundamental indicators come with their own strengths and weaknesses. Let’s explore both sides.
Advantages of Fundamental Indicators
1. Accurate Assessment of Intrinsic Value: These indicators provide a clearer understanding of a project’s real worth by evaluating its underlying factors, such as technology, use cases, and team quality.
2. Identifying Long-Term Opportunities: By focusing on essential metrics, investors can pinpoint projects with sustainable growth potential, making them ideal for long-term investments.
3. Reducing Market Emotion: Fundamental analysis helps filter out short-term market noise and emotional trading, offering a more rational perspective on asset value.
4. In-Depth Understanding of Network Health: By examining metrics like user activity and adoption rates, fundamental indicators provide insights into the overall viability and strength of a cryptocurrency network.
Limitations of Fundamental Indicators
1. Complexity and Expertise Required: Interpreting fundamental indicators often demands specialized knowledge and experience, making them less accessible to beginners.
2. Inability to Predict Short-Term Price Movements: While these indicators are excellent for assessing long-term value, they do not offer precise predictions for short-term market fluctuations.
3. Mismatch with Specific Market Conditions: Fundamental metrics may not fully capture sudden market dynamics, such as regulatory news or geopolitical events, which can dramatically impact prices.
4. Unmeasurable Risks: Factors like sudden technological failures, security breaches, or unforeseen market disruptions cannot always be accounted for through fundamental indicators.
While fundamental indicators provide a robust framework for evaluating cryptocurrencies, they are not a one-size-fits-all solution. Combining them with other analysis methods, like technical or on-chain analysis, can offer a more comprehensive approach to navigating the complexities of the crypto market.
Why is Fundamental Analysis Important in the Cryptocurrency Market?
In a market as volatile and unpredictable as cryptocurrency, fundamental analysis is an essential tool for identifying projects with genuine value. With countless coins flooding the market, many of which hold little to no intrinsic worth, it becomes critical to separate legitimate opportunities from schemes designed to prey on investor greed.
The rise of “shitcoins”—tokens with no real utility or future—has made this process even more vital. These coins often gain temporary attention through flashy marketing or influencer endorsements, enticing investors with promises of rapid gains. However, behind the hype often lies the intent to manipulate and profit at the expense of unsuspecting traders.
At its core, fundamental analysis empowers investors to make informed decisions by focusing on the intrinsic value of assets rather than succumbing to emotional trading or market noise. It allows for a deeper understanding of a project’s mission, technological foundation, and long-term potential. For instance, Bitcoin, the flagship cryptocurrency, exemplifies the importance of looking beyond price speculation.
Bitcoin is more than a financial instrument for fiat gains—it represents a cultural and economic revolution. In an age dominated by inflationary policies and debt-driven economies, Bitcoin offers a transparent, decentralized alternative to traditional banking systems. Unlike fiat currencies, which lose value over time due to inflation, Bitcoin’s limited supply ensures its role as a “hard money” capable of preserving wealth across generations.
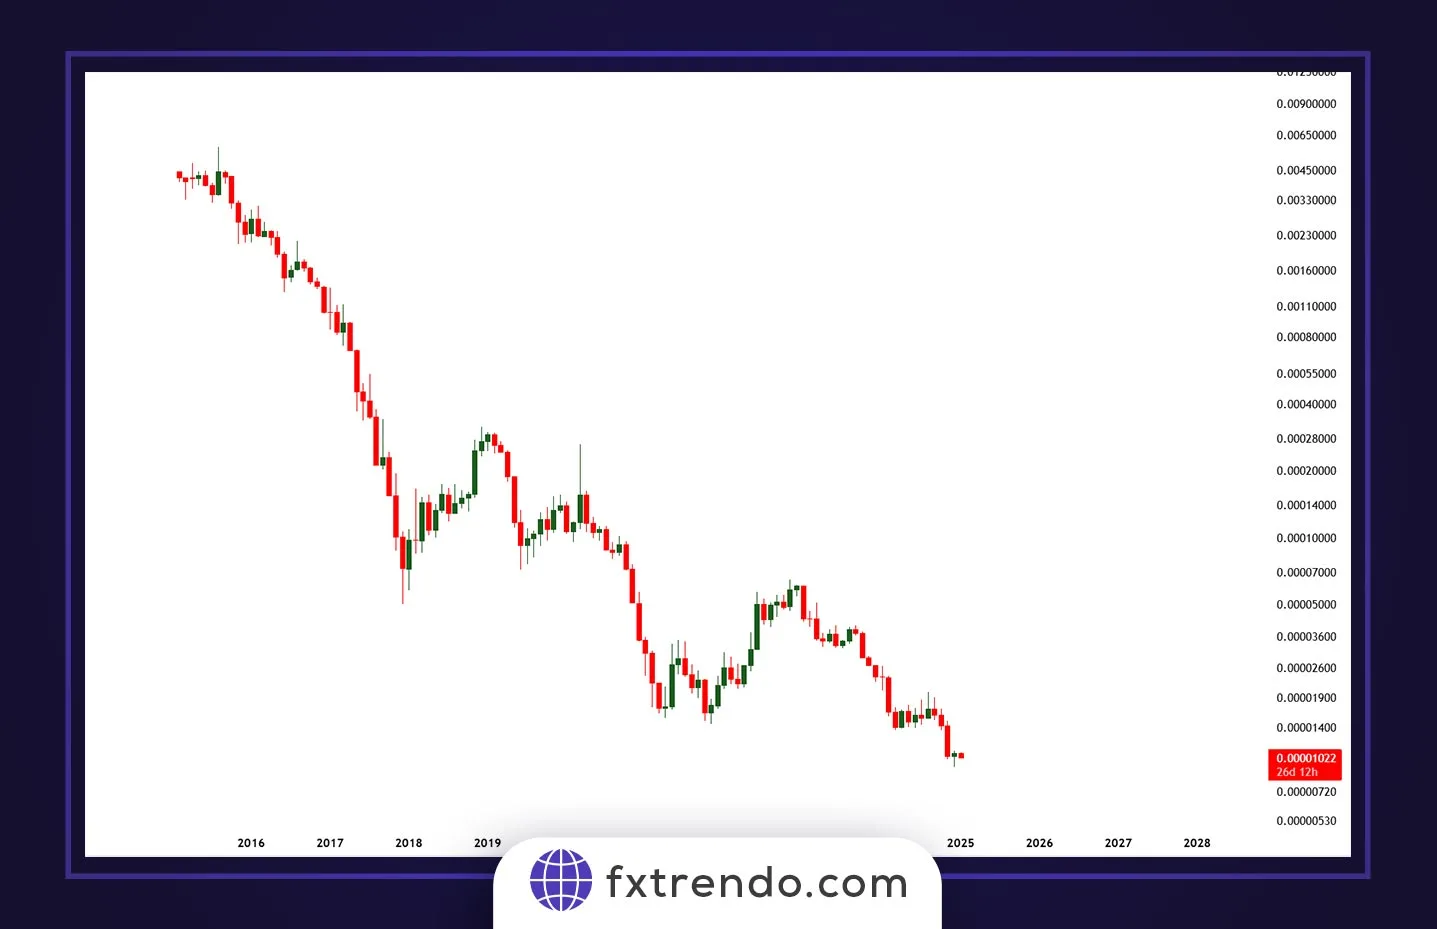
In the chart below you can see the ratio of the value of the US dollar to Bitcoin on a monthly time frame. Even the US dollar is considered a shit coin against Bitcoin:
By relying on fundamental analysis, investors can see through the market’s temptations and focus on projects like Bitcoin that have enduring value and purpose. This approach helps them avoid the pitfalls of pump-and-dump schemes, protect their assets, and contribute to a more stable financial future. Fundamental analysis, therefore, serves as both a shield against market manipulation and a compass pointing toward sustainable investments.
Conclusion
The cryptocurrency market offers significant opportunities but also comes with inherent challenges. To succeed, investors need a deep understanding and the right analytical tools.
Fundamental analysis plays a vital role in assessing the true value of digital assets by examining data such as market capitalization and network adoption. This approach helps investors make informed decisions, looking beyond short-term price fluctuations.
Success in this space requires a long-term perspective, focusing on projects with real utility. However, it’s essential to remain cautious, never investing more than you can afford to lose.
In the rapidly changing crypto world, combining fundamental knowledge with a clear strategy is key to navigating risks and seizing opportunities effectively.
Finally, always remember that trading in financial markets involves a lot of risk and only enter this field with capital that you can afford to lose.

