


A trading strategy based on price action is one of the most popular trading strategies. It involves analyzing price movements over time without relying on indicators and a simple yet effective approach to trading that novice and experienced traders can use.
What is a price action strategy?
A price action strategy is a trading approach that involves analyzing price movements on a Forex chart to identify trading opportunities. Based on this concept of market movements, the result of supply and demand in the market and price is the most important indicator of market sentiment. In other words, traders in this strategy rely only on the currency pair’s price instead of using technical indicators or other tools.
Price action traders’ different techniques
Price action traders use diverse techniques such as trend lines, support and resistance levels, and chart patterns to analyze price movements. They also look for strategy-specific signals, such as bullish and bearish candlestick patterns, to decide the best entry and exit points for their trades.
Price Action Strategy Advantages
The price action strategy has practical benefits for many traders, which include:
- Simplicity
- flexibility
- Finding trading opportunities with a high success chance
Further, we will explain the 3 strengths of this strategy in detail.
Simplicity: Unlike other trading strategies that rely on complex technical indicators, price action traders only need a basic understanding of the market and how to read price charts. That makes this strategy an ideal approach for beginner traders who are new to forex trading.
Flexibility: Since traders do not rely on specific indicators or tools in this strategy, they can trade in any market conditions, including volatile or low-volatility markets. This advantage makes price action a versatile trading method that can adapt to changing market conditions.
Finding trading opportunities with high success chance: By analyzing price movements and looking for specific signals of this method, traders can make conscious trading decisions that are based on real market conditions and not on predictions or rumors.
Price Action Strategy Disadvantages
Despite the significant advantages of the price action strategy, this strategy has disadvantages as well, which include:
- Relying on subjective analysis
- Requires a lot of patience and discipline
Further, we will analyze these cases in more detail.
Relying on subjective analysis: Since traders interpret price movements differently, there is a risk that traders may miss significant signals or make incorrect trading decisions.
Requires a lot of patience and discipline: Unlike other trading strategies that rely on technical indicators, price action traders must wait for the right signals to appear before placing a trade. That can be challenging for traders who are impatient or prone to impulse trading.
What are price action tools?
There are many fundamental concepts in price action strategies that are requirements for implementing this strategy. These concepts are:
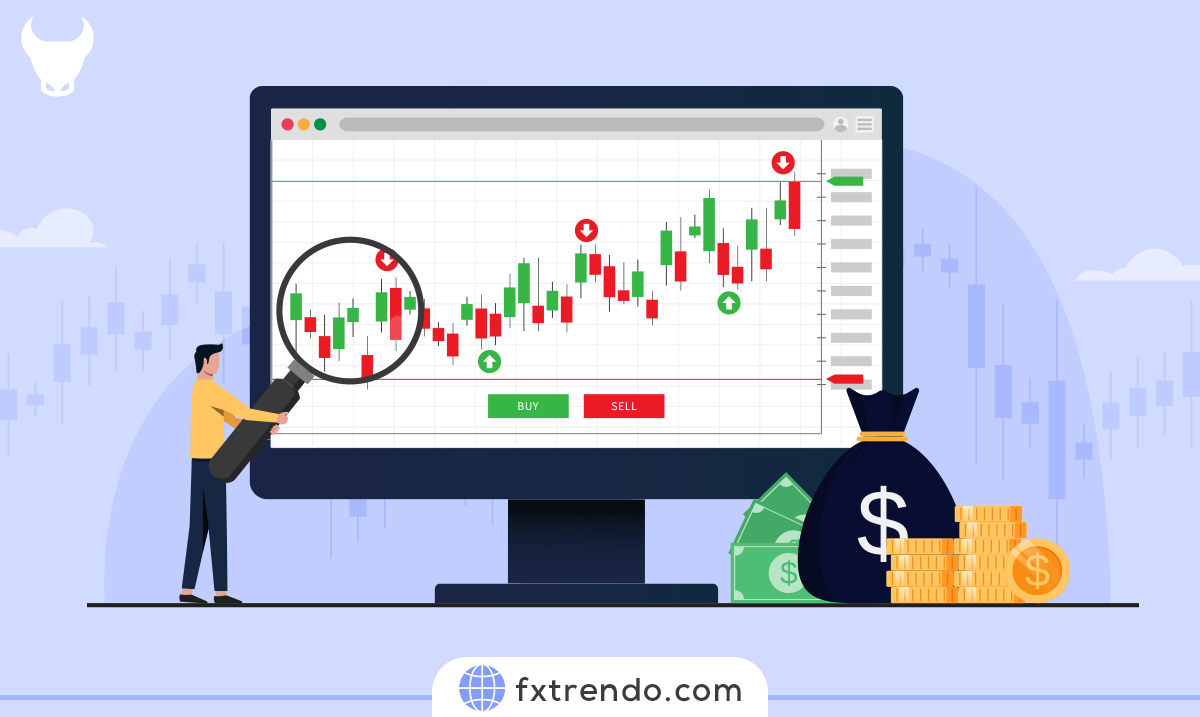
Candlestick Patterns
Candlestick patterns are graphical representations of price action that provide valuable information about market sentiment. A candlestick shows the price movement of a currency pair for a specific period. The four main parts of the candlestick are the opening price, closing price, maximum price, and minimum price. You can recognize the continuation and reversal patterns based on the shape of the candlestick.
For example, a bullish engulfing pattern occurs when a small bearish candlestick is followed by a larger bullish candlestick surrounding the previous candlestick. This pattern indicates a potential reversal of the descending movement and the beginning of the price’s ascending movement. Conversely, a bearish engulfing pattern occurs when a small bullish candlestick is followed by a larger bearish candlestick, indicating a possible reversal of the bullish move and the start of a bearish price movement.
There are numerous other candlestick patterns, each with its unique characteristics and meanings. Traders can identify powerful positions that increase their chances of success by combining these patterns with support and resistance levels.

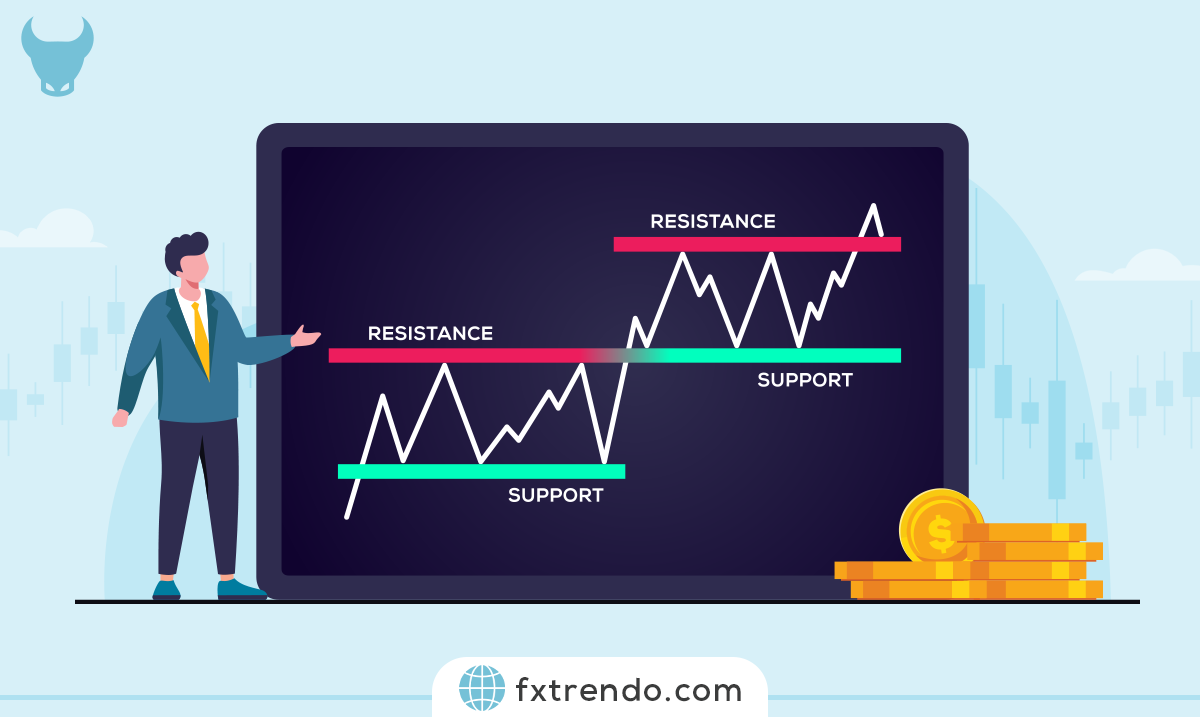
Support and Resistance
Support and resistance levels are key areas on a price chart where prices tend to react or stall. These levels form based on historical price data and act as barriers to price movement. Traders can anticipate potential price trend reversal situations by identifying and analyzing these levels.
Support levels are areas where buyers are strong enough to prevent the price from falling further. On the other hand, resistance levels are areas where selling pressure is strong enough to stem the price from rising further. Traders can identify opportunities to take advantage of possible reversals or breakouts by observing how price reacts to these levels.
More specialized terms are also used for support and resistance levels. These terms are:
- Flip level
- Key level
- Key level
Below is a brief description of each term.
Flip level: The flip level is an area that acts as both support and resistance. This area is significant because both buyers and sellers pay attention to it.
Key level: Key level is a significant area in daily or weekly time frames to identify price floor and ceiling. The best trading time frame to find these levels depends on the trader’s strategies.
Dynamic level: Unlike horizontal levels, Dynamic Levels move with the price. Trendline and moving average are examples of Dynamic Levels.

Market conditions
Market condition is a process to identify the nature of a trend and has four elements:
- Impulsive
- Corrective
- Volatile
- Non-volatile
Further, we briefly describe each of these elements.
Impulsive: It is considered an Impulsive trend when the price makes new ceilings and floors with strength. This price movement indicates the continuation of the current trend.
Corrective: In a corrective market structure, price hardly creates new price ceilings and floors. This price movement is a sign of a market reversal.
Volatile: In a corrective market structure, price hardly creates new price ceilings and floors. This price movement is a sign of a market reversal.
Non-volatile: Non-volatile movements appear with the market’s impulsive movement, and the price tries to continue the current movement.

Step-by-step guide & key techniques to master the price action strategy
Step 1: Understanding the basics of price action
As mentioned, price action refers to price movement on a chart, including floors, ceilings, and price formation patterns. These concepts are the foundation of this strategy because they provide valuable information about market sentiment, supply and demand, and the behavior of buyers and sellers. To analyze this strategy, traders must be familiar with the concepts of key support and resistance levels, trend reversals, and potential trading opportunities.
Step 2: Mastering candlestick patterns
Candlestick patterns are a vital aspect of price action analysis. They provide visual representations of market sentiment and can help traders make conscious decisions. Some of the commonly used candlestick patterns include the doji, hammer, engulfing, and shooting star. Each pattern has a specific meaning and can indicate potential changes in market direction.
Step 3: Identifying the support and resistance levels
Support and resistance levels are areas on the chart where the price tends to stall or reverse. These levels are key reference areas for traders as they provide insights into potential entry and exit points. Support levels are price levels where buying pressure is expected to exceed selling pressure and cause the price to rise again. On the other hand, resistance levels are price levels where selling pressure is expected to outweigh buying pressure and cause a descending trend reversal.
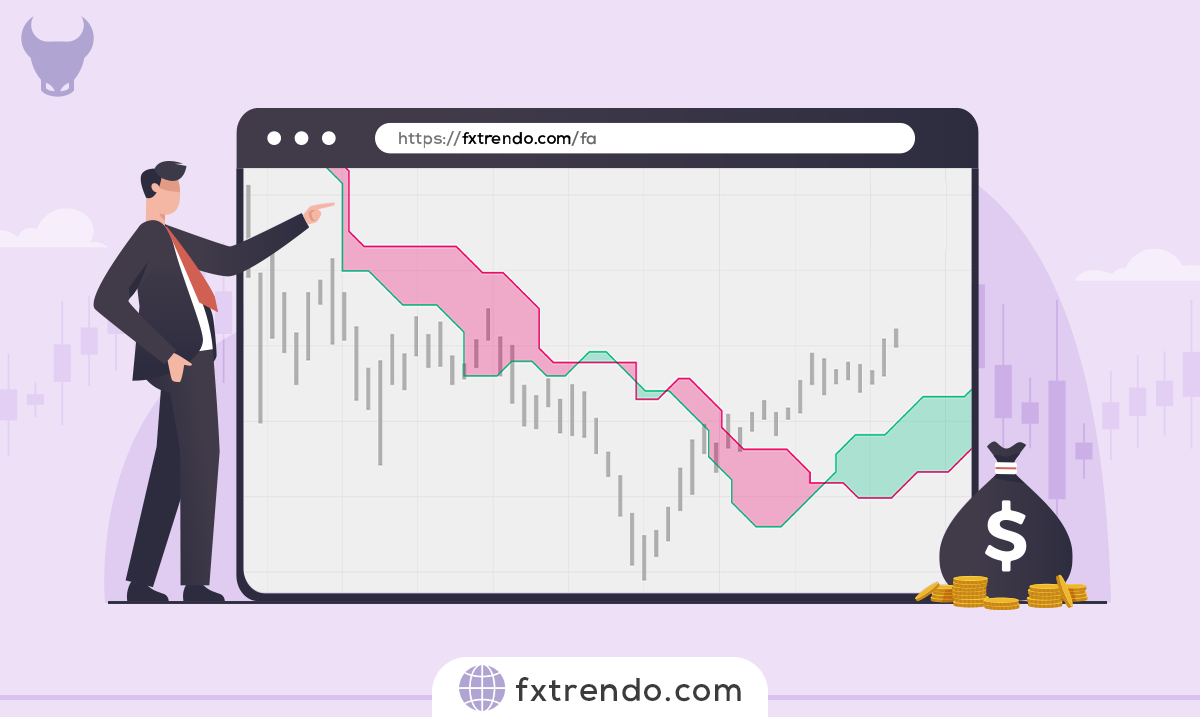
Step 4: Trend analysis and trend reversal
Trend analysis is an essential part of the price action strategy. Traders can increase the probability of making profitable trades by identifying and following trends. An uptrend occurs when the price makes higher ceilings and floors, while a downtrend occurs when the price makes lower floors and ceilings. Traders can use trend lines, moving averages, or trend indicators to identify and confirm trends and reversal trends .
Step 5: Identifying price action patterns
Price action patterns form by combining candlestick patterns, support & resistance levels, and trend analysis. These patterns provide trading signals and can be used to identify potential entry and exit points. Some of the most commonly used price patterns include double bottoms and tops, heads and shoulders, and triangles. Traders must learn to recognize and interpret these patterns to make conscious trading decisions.
Step 6: Risk and capital management
Mastering the price action strategy also requires effective risk and capital management techniques . Traders should always define risk tolerance and set an appropriate stop-loss order to limit potential losses. In addition, they should determine their position size based on the account balance and the risk of each trade. Traders can protect their capital and increase their chances of long-term success by implementing proper risk and capital management techniques.
Step 7: Continuous practice and learning
Mastering price action in forex trading requires constant practice and learning, like any other skill. Traders must study charts, analyze specific patterns, and practice their trading strategies on a demo account . They should also follow market news and developments to stay informed about the latest movements and events that might affect price changes.
Summary
The price action strategy is a simple yet effective forex trading strategy with many advantages over other trading strategies. Traders can make conscious trading decisions based on actual market conditions by relying on price action and looking for signals. However, this strategy requires a lot of patience, discipline, and mental analysis, which can be challenging for some traders. Overall, the price action strategy is a versatile and effective trading approach that novice and experienced traders can use.