The Ultimate Guide to Using Smart Money Concepts in Trading


Smart money is characterized by a disciplined approach, involving decisions based on thorough research and analysis, which often goes against the behavior of retail traders.
Large institutions, such as hedge funds, major banks, and corporate trading firms, make up the bulk of smart money. These organizations have access to vast amounts of data, advanced analytics, and expert insights, allowing them to make informed investment decisions that can significantly affect the price of an asset.
The term "smart money" is often used to describe the investment strategies of these entities, which tend to move markets in ways that are not always immediately apparent to the average trader.
In this article, we will dive deeper into the concept of smart money, its influence on the markets, and how it differs from retail trading strategies.
Stay with us to learn more about the power and impact of smart money in today’s financial landscape.
Contents
What is Smart Money?
Smart money refers to capital invested by large, professional, and experienced investors, such as banks, financial institutions, investment funds, and other market players. These investors make informed decisions based on their expertise and financial resources. They typically focus on long-term investments and are less involved in short-term trading.
Big players can influence market prices when entering or exiting trades. Their actions often serve as indicators for retail traders, providing clues about market sentiment and potential price changes.
By analyzing market data, such as volume patterns, timing, and price movements, retail traders can gain insights into potential trends and improve their trading outcomes.
Smart money reflects a disciplined, data-driven approach to investing, with a focus on long-term value rather than quick profits. These investors use advanced tools and information to make calculated decisions, often staying ahead of the market.
What is Liquidity?
In smart money strategies, the main goal is to identify liquidity levels in the market. Liquidity refers to the amount of money available in the market and is often used to gauge the presence of large players.
As a result, prices tend to follow liquidity. Part of this liquidity comes from levels where most traders have set their stop-loss orders. These levels are typically located behind key support and resistance points, historical highs and lows, psychological levels, trendlines, and other significant price areas.
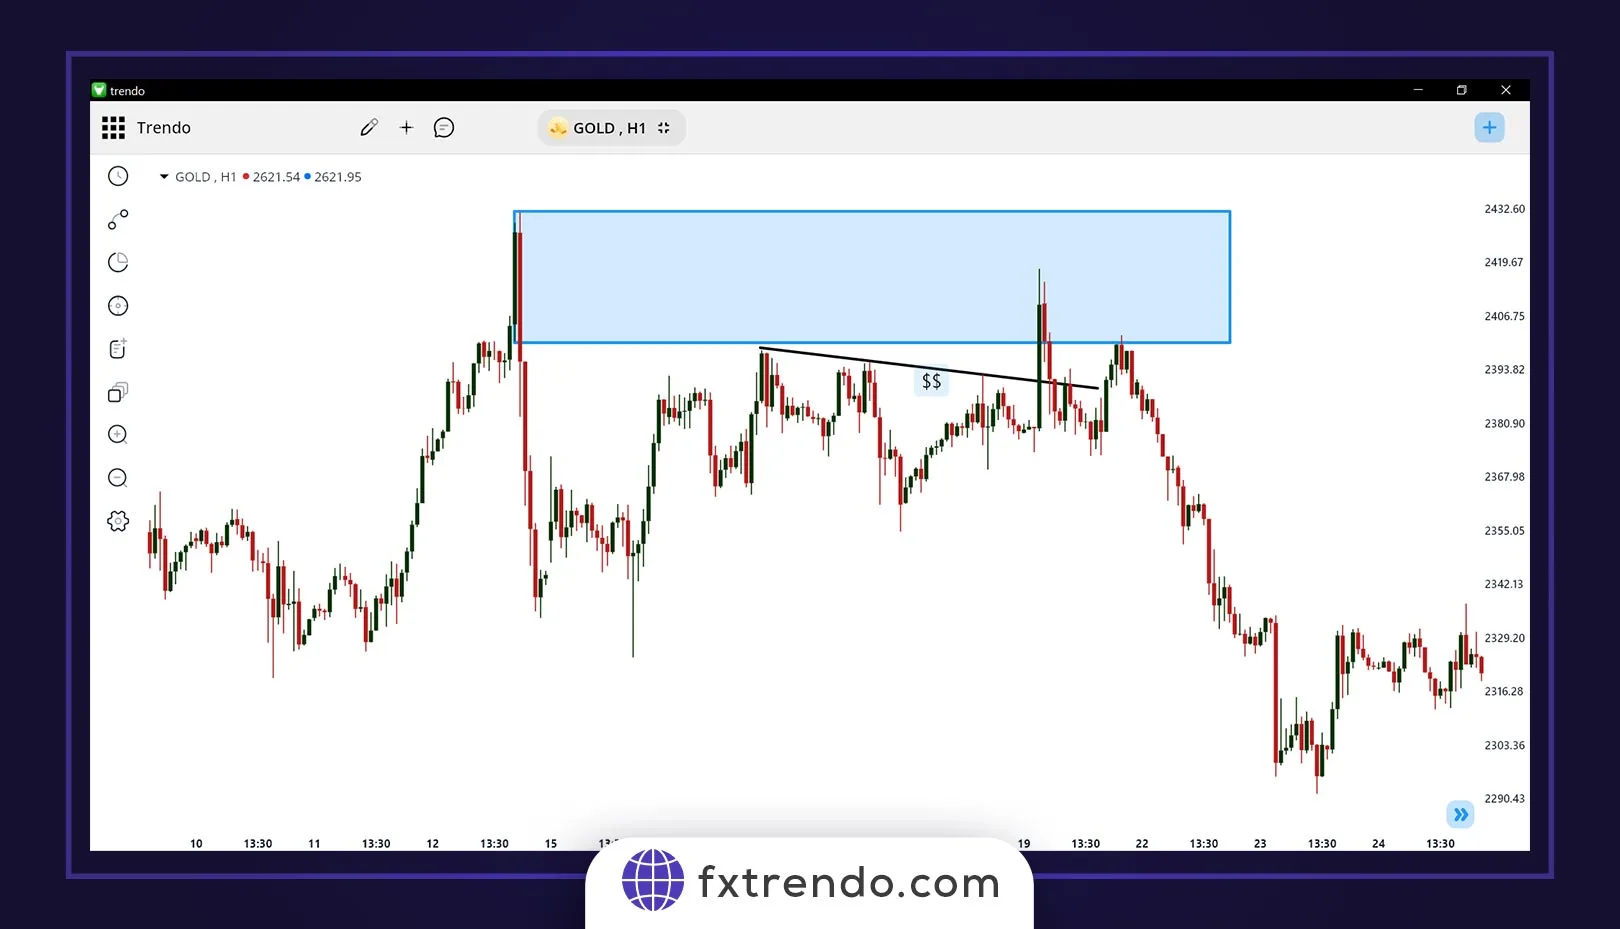
It is important to carefully examine these levels before entering a trade, as the market often moves toward these areas to collect liquidity. For example, as you can see in the image below of the gold analysis, the market continued to move in the opposite direction after gathering liquidity and hitting a block order:
Core Concepts of Smart Money
Smart money structures are more than just Forex trading strategies; they reflect how markets work. They focus on identifying the price levels where big players are active. Retail traders can improve their strategies by understanding smart money movements. Candlestick charts are key tools for identifying smart money, as they show market behavior and psychology in real-time. Traders should first become familiar with candlestick patterns before diving into smart money concepts.
Read more: What is a Candlestick? The use of Candles in Analysis and Trading Strategy
Here are some common concepts of smart money:
Break of Structure (BOS)
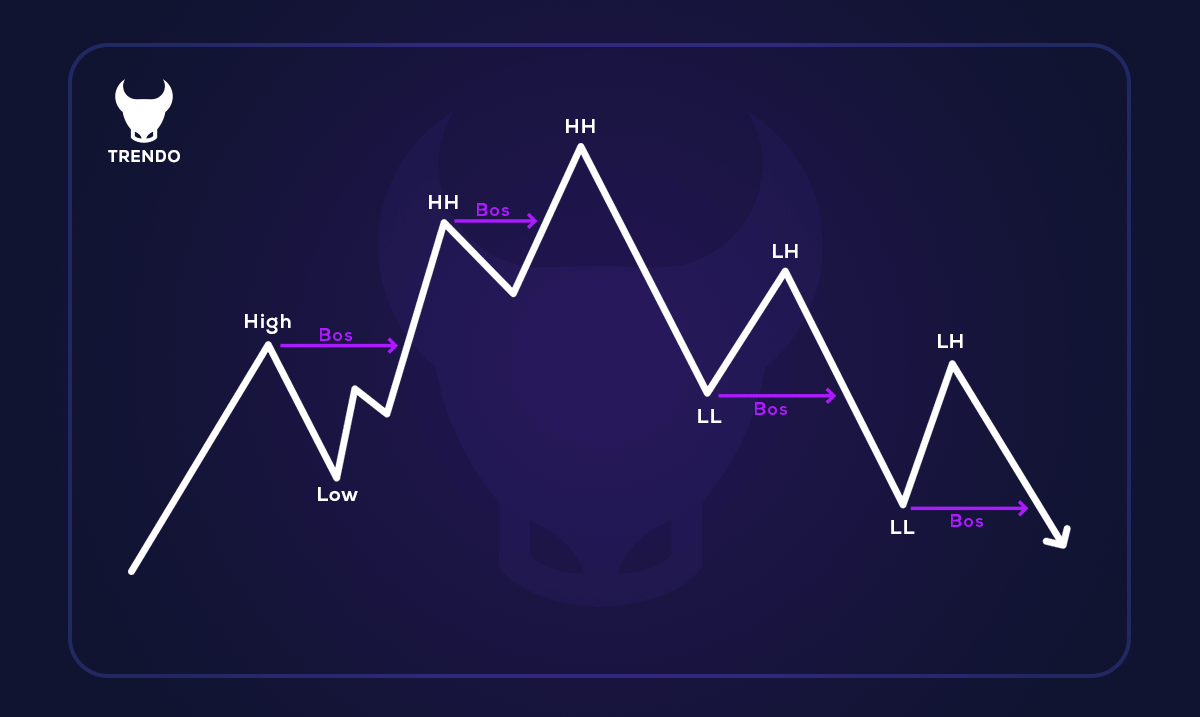
A Break of Structure (BOS) indicates that the market is moving in a specific direction. In an uptrend, BOS occurs when the price rises and breaks the last peak. In a downtrend, it happens when the price falls below the last low. BOS signals a shift in market momentum and can help traders spot potential trend reversals or continuations. You can see the above mentioned items in the image below:
Change of Character (CHOCH)
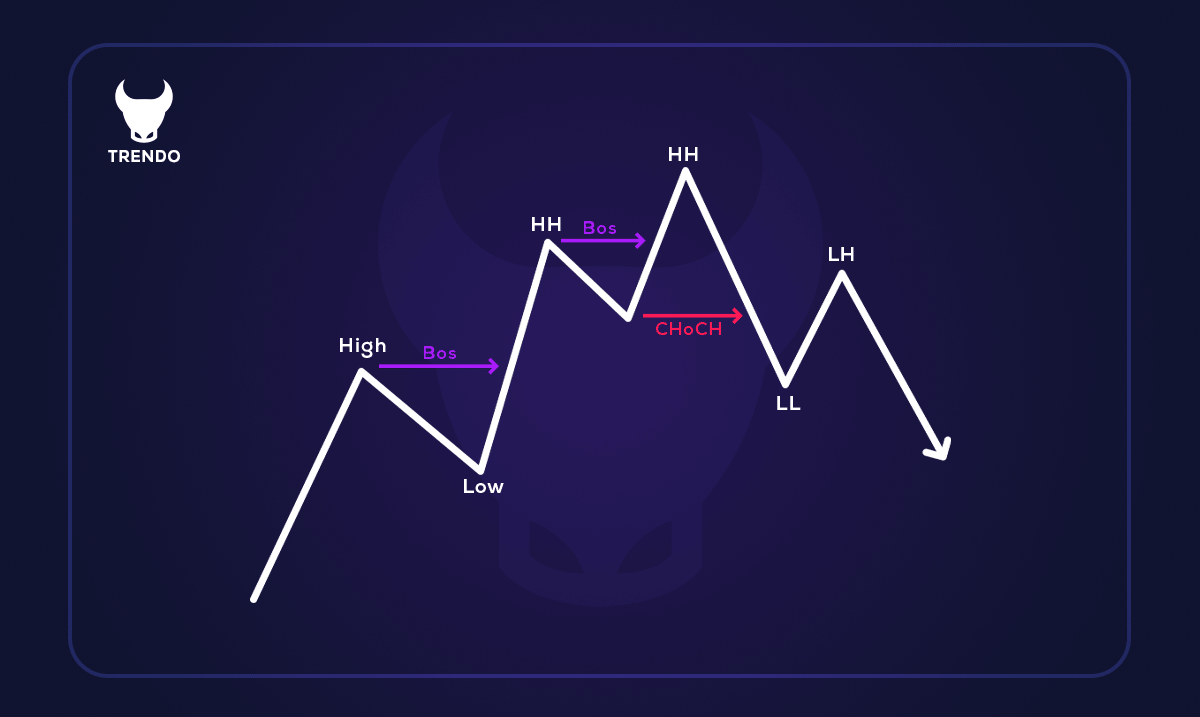
A Change of Character (CHOCH) occurs when the market trend switches from bearish to bullish, or vice versa. In a downtrend, the price breaks previous lows. However, if the price suddenly rises above the last peak, it indicates a CHOCH, showing that the market structure has changed. After a BOS of the last peak, a new bullish trend is often expected. In the image below you can see the concept of Change of Character (CHOCH):
Order Blocks
As the name suggests, order blocks are a collection of orders from banks and large institutions at a specific price.
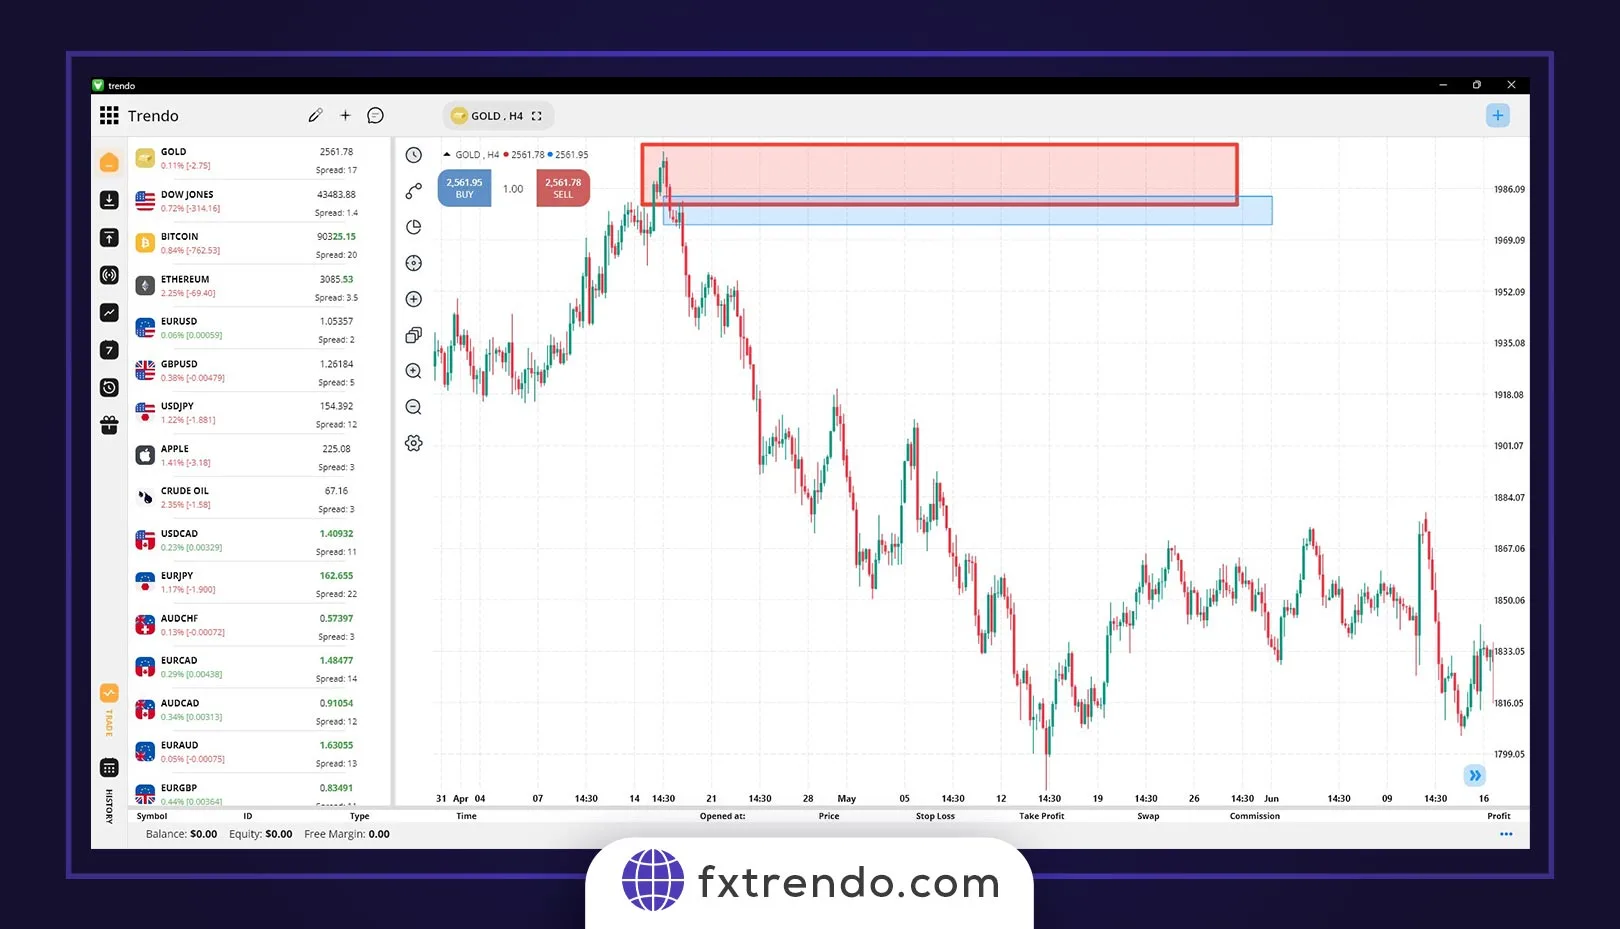
Order blocks work by creating an imbalance of supply and demand in the market and, due to having a large number of buy or sell orders at a specific price level, they create significant support or resistance at a price level in the market, which means that if the price returns to that level again, it is likely to bounce off that level and move in the opposite direction.
After identifying the main market trend and finding the correct order block, two methods are used to enter the trade.
In the first method, after the price hits the desired area, we wait for a confirmation candle in the direction of the trend and then enter the position with a stop loss behind the area.
In the second method, which is a little more aggressive, we enter the trade by placing a limit order. The advantage of the second method is that you enter the trade at a better price and the probability of losing the trade is minimized, but it is obviously more risky.
Stay tuned for an example of a bearish block order on the Dow Jones symbol on the one-hour timeframe:
Read more: All you need to know about Types of Order Blocks
Fair Value Gaps (FVG) and Imbalance
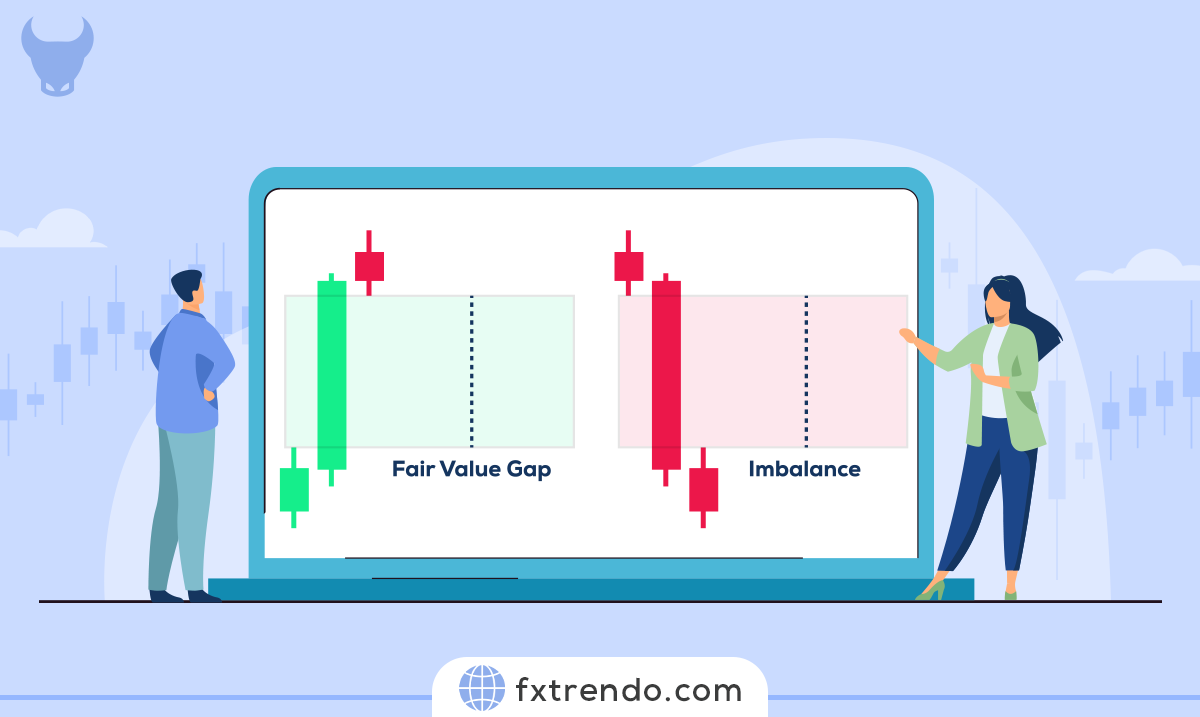
Fair value gaps are most commonly used by price action traders and are referred to as a market inefficiency or imbalance. This pattern forms when the power of buyers over sellers or vice versa increases suddenly, causing the price to jump rapidly.
The fair value gap pattern is represented by three candles and consists of the parts of the body of the second candle that are not covered by the highs and lows of the first and third candles.
It should be noted that if the third candle is the same color as the second candle, this pattern is called imbalance, and if it is not the same color as the second candle, we have the FVG pattern, which is more powerful than the imbalance pattern.
These areas are usually the place where a large number of orders are registered and are expected to act like a magnet and attract price in the future. We can also expect a price reaction back to these areas.
Ways to Identify Smart Money in the Market
In addition to price charts and market structure, there are other methods to track smart money in the market.
1. Trading Volume in Smart Money
Experienced traders usually invest more capital. Increased trading volume, especially when there is no public information on the size of the trades, often indicates smart money activity. In a Forex broker, volume is shown as tick volume, a relative measure of actual trading volume. Sudden spikes in volume without major news or announcements can signal the involvement of large institutional players, often leading to price shifts.
2. The Role of COT Data in Smart Money
Insiders use various methods to gather data on commercial and non-commercial traders. One source is the Commitments of Traders (COT) report, released weekly by the Commodity Futures Trading Commission (CFTC). The report shows the positions of large institutional traders, helping analysts spot smart money movements. While some traders believe COT data is outdated, it can still provide useful insights into institutional activity, especially in the futures market.
By understanding volume and COT data, traders can identify where smart money is positioning itself and adjust their strategies accordingly.
Why Are Smart Money Concepts Effective in Trading?
Smart money concepts are highly effective in trading because they focus on understanding the actions of the largest and most experienced market players. These institutional investors, such as banks, hedge funds, and large asset management firms, have access to vast resources, information, and advanced strategies. Their movements often influence market trends, making it crucial for retail traders to follow their lead.
1. Market Influence of Large Players: Smart money has the power to move markets. When institutional investors make significant trades, their actions can cause price fluctuations. Retail traders can gain an edge by tracking the patterns and trends driven by these large players. By understanding where smart money is positioned, traders can anticipate potential price movements and adjust their strategies accordingly.
2. Insights into Institutional Trading Behaviors: Smart money concepts provide insights into how large institutions approach the market. By studying the behavior of institutional traders, retail traders can better understand how these players make decisions, giving them an advantage when interpreting market movements.
3. Higher Accuracy Compared to Retail Trading Strategies: Smart money traders rely on extensive research, data, and analysis, leading to more informed and accurate decision-making. By adopting similar data-driven methods, retail traders can improve the accuracy of their trades, resulting in higher potential profits.
4. Ability to Predict Market Reversals and Continuations: Smart money is skilled at identifying trends and market patterns early, making it easier to predict reversals and continuations. Retail traders who track the movements of smart money can also spot these trends ahead of time, positioning themselves to profit from price changes.
5. Long-Term Focus: Smart money investors generally take a long-term view of the market. They are less likely to be influenced by short-term volatility and more focused on the bigger picture. By adopting a similar long-term approach, retail traders can avoid getting caught up in market noise and make more calculated, less impulsive decisions.
By understanding and applying smart money concepts, traders can align their strategies with the largest market participants, enhancing their ability to profit in both trending and consolidating markets.
Step-by-Step Guide to Trading with Smart Money
Trading with smart money focuses on the actions of large institutional investors like banks, hedge funds, and corporations. These players often influence market movements, so retail traders can benefit from understanding and following their moves. While smart money trading involves various strategies, we’ll focus on trading with order blocks. Remember, no strategy is foolproof, so always manage your risk and refine your approach through experience.
How to Enter a Trade with Order Blocks?
Order blocks are key in smart money strategies. These zones show where large institutions are active in the market, causing significant price movements. After identifying an order block, it often acts as strong support or resistance, with the price likely reversing or consolidating around it.
Here’s how to trade with order blocks:
1. Step 1: Identify the Market Trend: Start by identifying the overall market trend—uptrend or downtrend. This will help you decide which direction to trade in.
2. Step 2: Wait for a Price Correction and Identify Order Blocks: Once the trend is clear, wait for a price correction. During this phase, find order blocks—price levels where large institutions have previously entered the market. These levels often react strongly when the price returns to them.
3. Step 3: Enter the Trade in the Direction of the Trend: After identifying an order block, wait for price action to confirm a reaction. If the price bounces off the order block, enter the trade in the direction of the trend. In an uptrend, enter after a price rise following the order block’s support.
4. Step 4: Set Stop Loss and Take Profit: Once in the trade, place a stop loss just below (for long positions) or above (for short positions) the order block. Set a take-profit target using a fixed ratio (e.g., 2 or 3 times the stop loss) or key resistance levels.
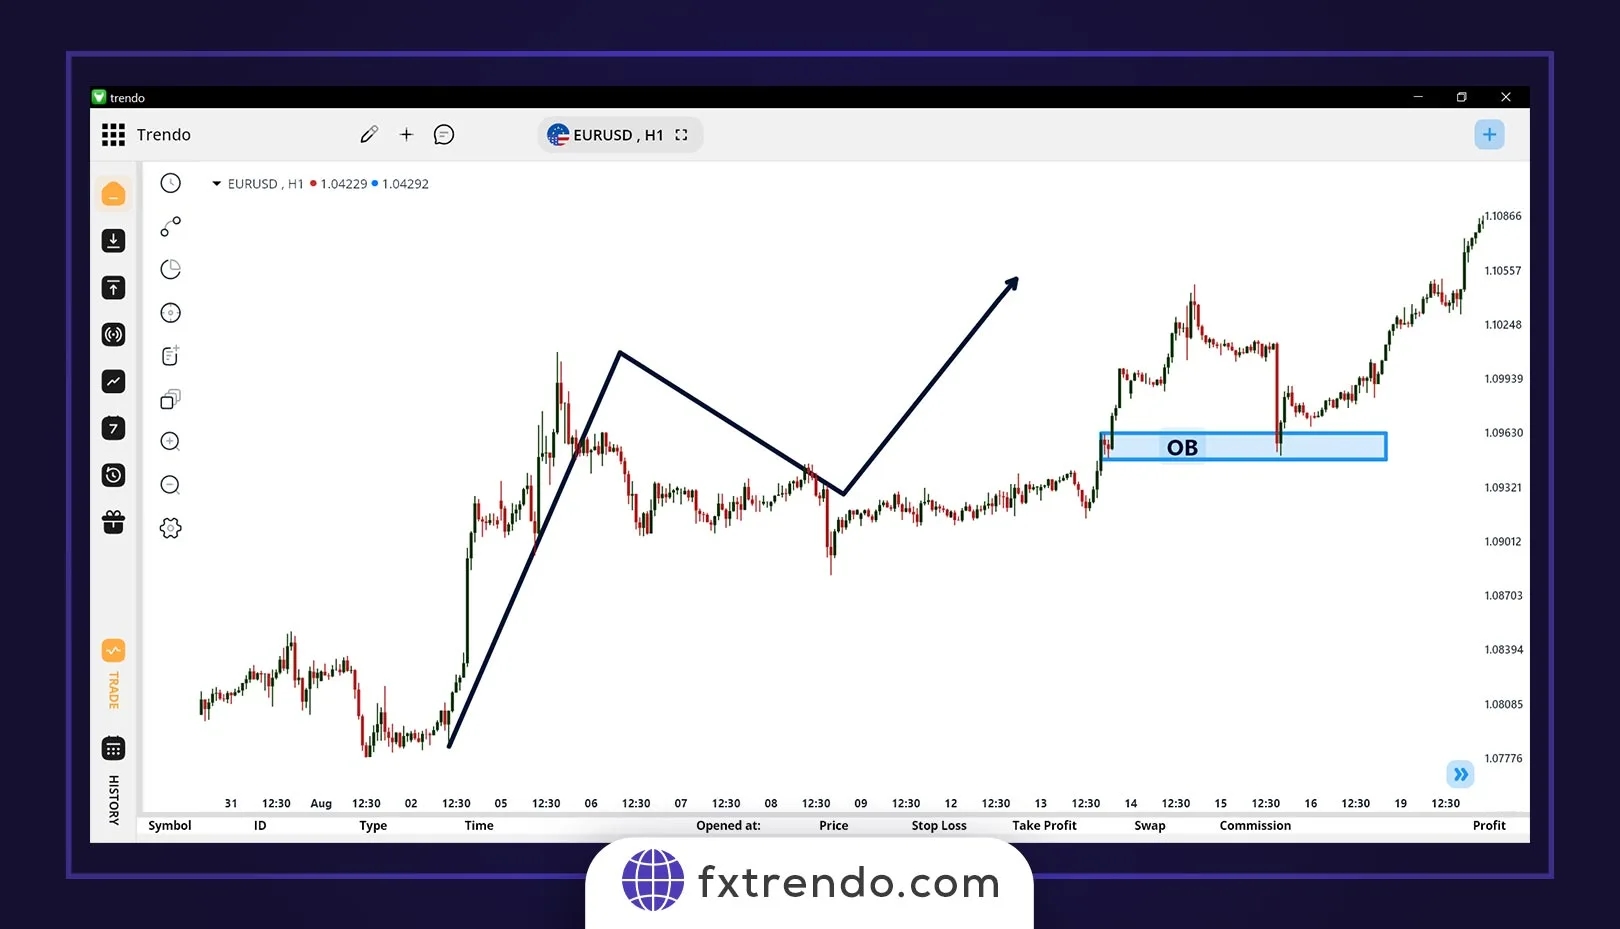
For example, in the EUR/USD pair on the H1 timeframe, after a strong uptrend, the price retraces and hits an order block. The price then resumes its upward movement, confirming the order block as support.
Key Considerations for Using Order Blocks
The success of this strategy depends on trading in the direction of the trend. Always use order blocks that align with the market trend, as trading against it increases the risk of failure. By focusing on these levels, you can better align your trades with smart money moves.
Pros and Cons of the Smart Money Strategy
The Smart Money strategy focuses on following the actions of institutional investors like banks and hedge funds. These players often make informed decisions, but their strategies are not risk-free. Unexpected events can disrupt trends, so effective risk management is essential.
Even experienced traders can be wrong. Markets are affected by many factors, and unforeseen events can change market dynamics. Therefore, all traders should have a clear strategy and manage risk effectively.
Key Points About Smart Money:
- Smart Money aims to identify liquidity in the market.
- It is a modern approach to technical analysis used across financial markets.
- Basic knowledge of supply and demand is needed to understand Smart Money.
- Smart Money refers to large liquidity moves by institutions that create new trends.
- This concept applies to stocks, forex, and cryptocurrencies.
- Traders look for areas where Smart Money places large orders, signaling potential market moves.
- Combining Smart Money with multi-timeframe analysis improves win rates and risk-to-reward ratios.
Strengths of the Smart Money Strategy
Accurate Entry and Exit Points: Smart Money tools like Order Blocks, FVG, and POI help traders identify precise market entry and exit points.
Risk Management: The strategy emphasizes proper stop-loss and take-profit settings, minimizing unnecessary risks.
Identifying Market Manipulation: Concepts like Inducement and Flip Zones help traders avoid market manipulation, such as stop hunting and false breakouts.
Weaknesses of the Smart Money Strategy
Requires Advanced Technical Knowledge: Beginners may struggle with the complex concepts involved. A solid understanding of technical analysis is necessary.
Time-Consuming to Learn: Mastering Smart Money strategies requires time, practice, and detailed analysis.
Demands Precise Analysis: Misinterpreting Smart Money signals can lead to poor trades and heavy losses.
While Smart Money offers powerful tools for making informed decisions, it requires dedication, solid knowledge of market dynamics, and continuous learning. Successful traders manage risk and adapt their strategies as they gain experience.
Read More: Ultimate Guide to Liquidity in Forex
Common Mistakes to Avoid When Using Smart Money Concepts
Using Smart Money concepts can be profitable, but traders often make mistakes that can lead to losses. Here are key mistakes to avoid:
1. Ignoring Risk Management Principles
Risk management is essential. Many traders neglect stop-loss orders or overexpose themselves to large positions. Without risk management, a single unfavorable move can lead to significant losses. Always set stop-loss levels and calculate your risk-to-reward ratio before entering trades.
2. Overcomplicating Analysis with Too Many Indicators
Using too many indicators can clutter your analysis. While concepts like Order Blocks, FVG, and POI are important, adding unnecessary tools can confuse your decision-making. Keep your strategy simple and focus on the most critical factors.
3. Misinterpreting Liquidity Zones and Market Structure Shifts
Correctly identifying liquidity zones and market structure shifts is key in Smart Money trading. Misinterpreting these areas can result in entering trades at the wrong time or price. Focus on accurately spotting these zones to make informed decisions.
4. Chasing the Market
Chasing price movements after they’ve already occurred can lead to buying or selling at the wrong price. Smart Money trading requires patience—wait for confirmation before entering trades to avoid chasing the market.
5. Failure to Adapt to Market Conditions
Markets are constantly changing. What works in one environment may not work in another. Sticking to a rigid strategy without adapting to changing conditions can lead to losses. Be ready to adjust your approach depending on the market environment.
6. Misinterpreting Institutional Movements
Institutional investors trade in large volumes, and their movements can be subtle. Failing to see the bigger picture or relying too heavily on immediate price action can cause you to miss important clues. Broaden your view and identify significant market patterns.
7. Not Using Multi-Timeframe Analysis
Focusing on one timeframe can mislead your analysis. Use multi-timeframe analysis to see the overall market trend. Confirm your analysis across different timeframes to ensure that your trade aligns with the bigger picture.
8. Ignoring Market Fundamentals
Smart Money trading relies on technical analysis, but ignoring fundamentals can be a mistake. Economic news and geopolitical events impact institutional investor behavior. Stay updated on relevant news to understand its effect on the market.
9. Overconfidence in Your Analysis
Overestimating your ability to predict the market can lead to reckless decisions. Overconfidence can cause traders to increase position sizes or ignore market signals. Approach each trade with caution and avoid making assumptions based on past successes.
10. Lack of Patience
Smart Money strategies often require waiting for the right setup. Impatience can cause you to enter trades too early or too late. Wait for confirmation and avoid rushing into trades.
Avoid these mistakes to improve your Smart Money trading. No strategy is foolproof, but with careful analysis and experience, you can trade effectively using Smart Money concepts.
Conclusion
In this article from the Trendo Forex Broker Training Team, we introduced Smart Money. There are many ways to make a profit in the financial markets. One of these methods is the Smart Money style. The money that market giants, banks and financial institutions use in the market and often make good profits.
If a trader can recognize this money in the market and adjust his trades accordingly, he has connected himself to a reliable and profitable source and can make a good profit.
FAQs
1. What is Smart Money?
2. How can liquidity levels be identified?
3. Does the Smart Money strategy help reduce trading risks?
4. What is the difference between regular technical analysis and Smart Money?
5. What is the main advantage of using Smart Money concepts in trading?
6. Are Smart Money concepts suitable for beginners?
7. Can Smart Money concepts be applied to all financial markets?
پست مرتبط
پربازدیدترین ها












||CHR(98)||CHR(98),15)||')