Learning about Market Structure, the basis of all trading strategies


Intro
The forex market is a vast and dynamic financial ecosystem where trillions of dollars move daily, providing many opportunities for traders. However, operating in the complex forex world requires more than a basic understanding of currency pairs and trading strategies. To make real progress in this field, traders must understand the market structure. In this article, we will embark on a journey to demystify the concept of financial market structure to analyze the essential components that define market anatomy and understand how experienced traders use this knowledge to make informed decisions and increase their trading success.
Contents
The importance of understanding the market structure
Market structure serves as a blueprint that focuses on the participants' behavior, capital flows, and the trends' formation, and is a framework that discerns between chaos and order in the market. Without an in-depth understanding of the market structure, traders are like sailors adrift in a vast ocean, lacking a compass to navigate the turbulent waters of the market. Whether you are a beginner or a professional trader, you must know that understanding the market structure is the cornerstone of all trading strategies, and to determine a trading strategy, you first need to define the market structure and trend.
What does market structure refer to?
Structureology is the study of market behavior. Simply put, the way the market is formed and moves in the form of a trend is called market structure. At the same time, the structures are fractal or nested, and that is why most traders use multi-timeframe analysis to analyze the market structure. There are different views of the structure definition, and various styles have provided different definitions of market structure. Further, we'll examine the basic concepts and what you need to understand about the market structure. Stay tuned.
The first step to identify the market structure is to examine the main ceilings and floors. As stated in the "Dow Theory," an uptrend occurs when we have higher highs and higher lows. Similarly, we will have lower lows and lower highs in a downtrend. A trend has two types of movement.
- Impulsive
- Corrective
Impulsive movements are in the trend direction and have good power and momentum. However, corrective movements are against the primary trend and usually have less power and momentum than impulsive movements. In the example below, you can see what we explained.


Read More: Fractal approach and key rules in Elliott wave theory
Breakdown of Structure (BOS)
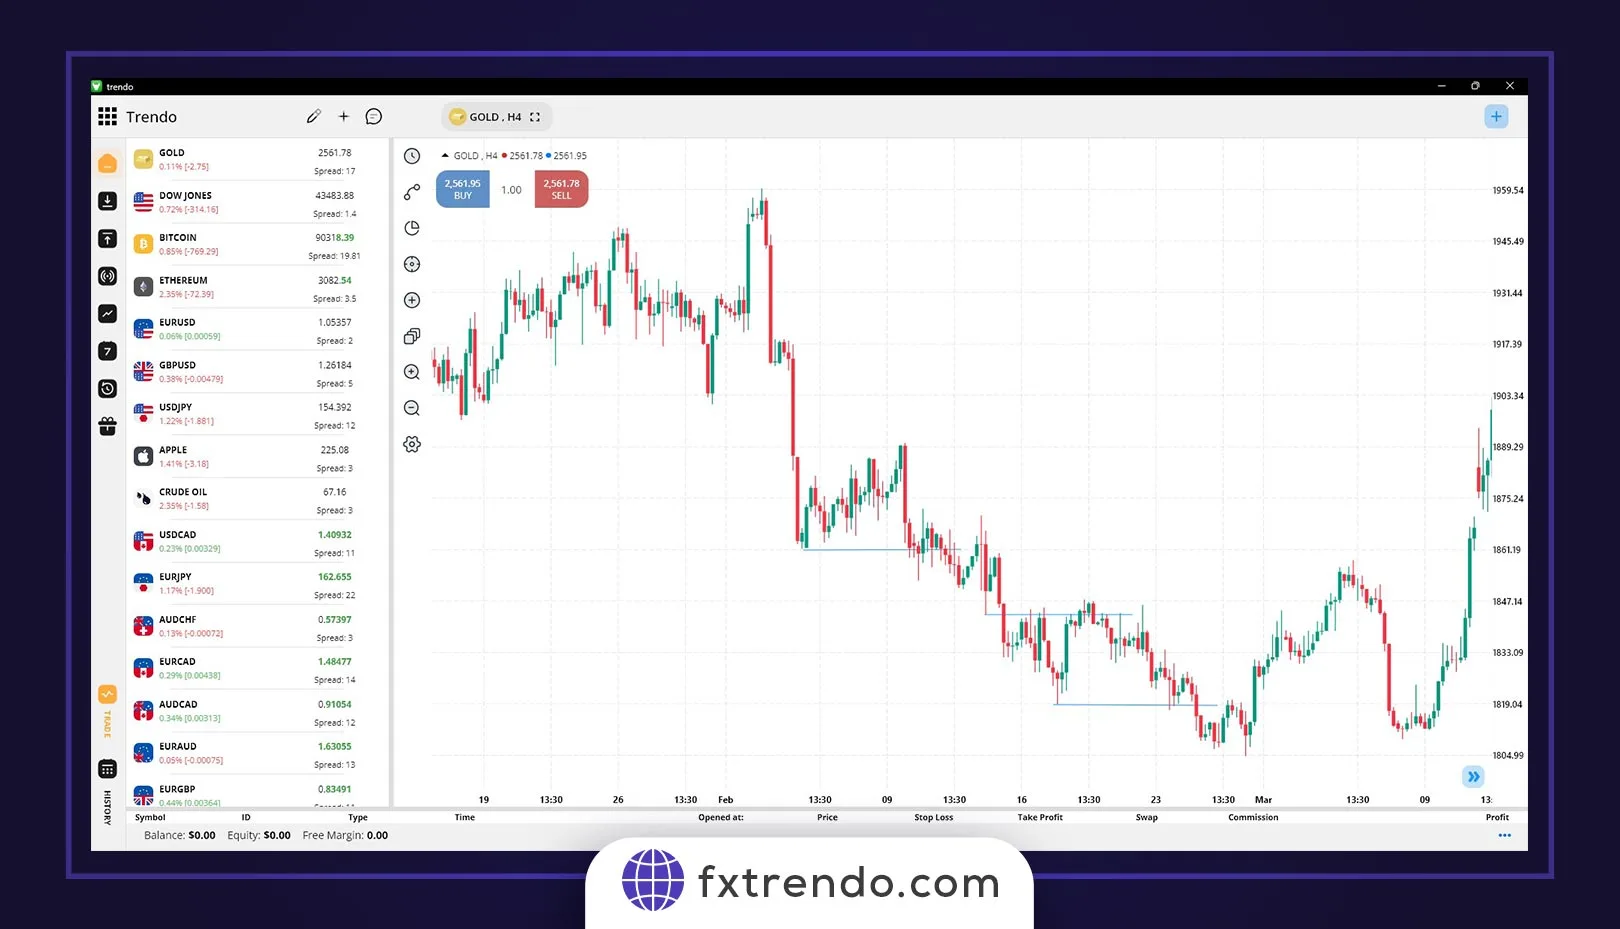
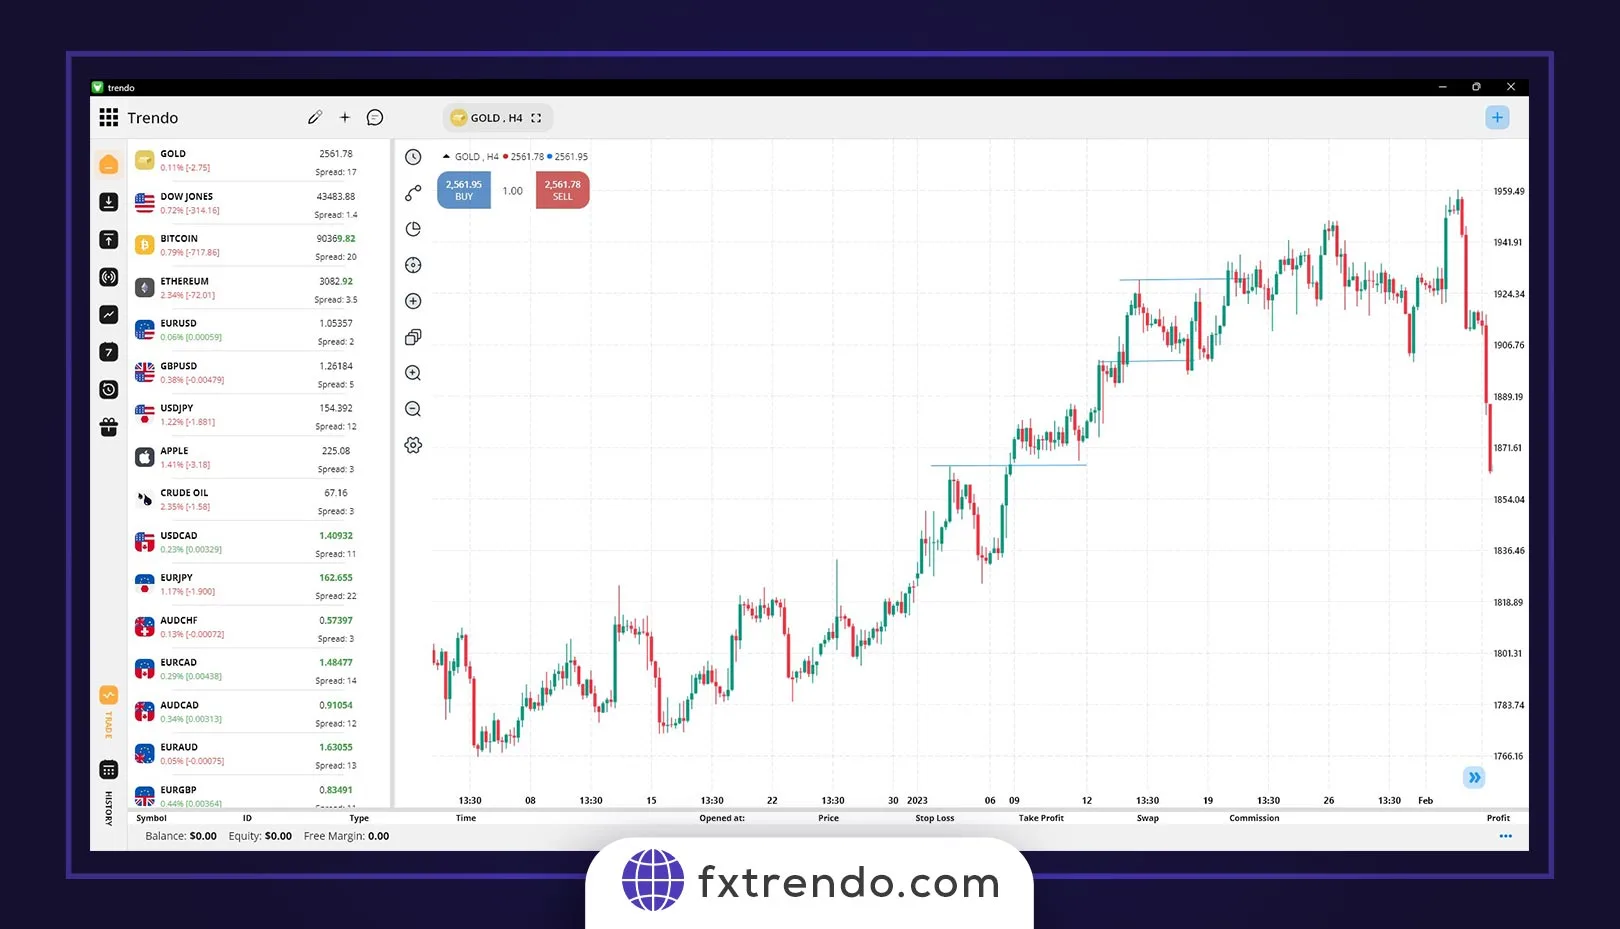
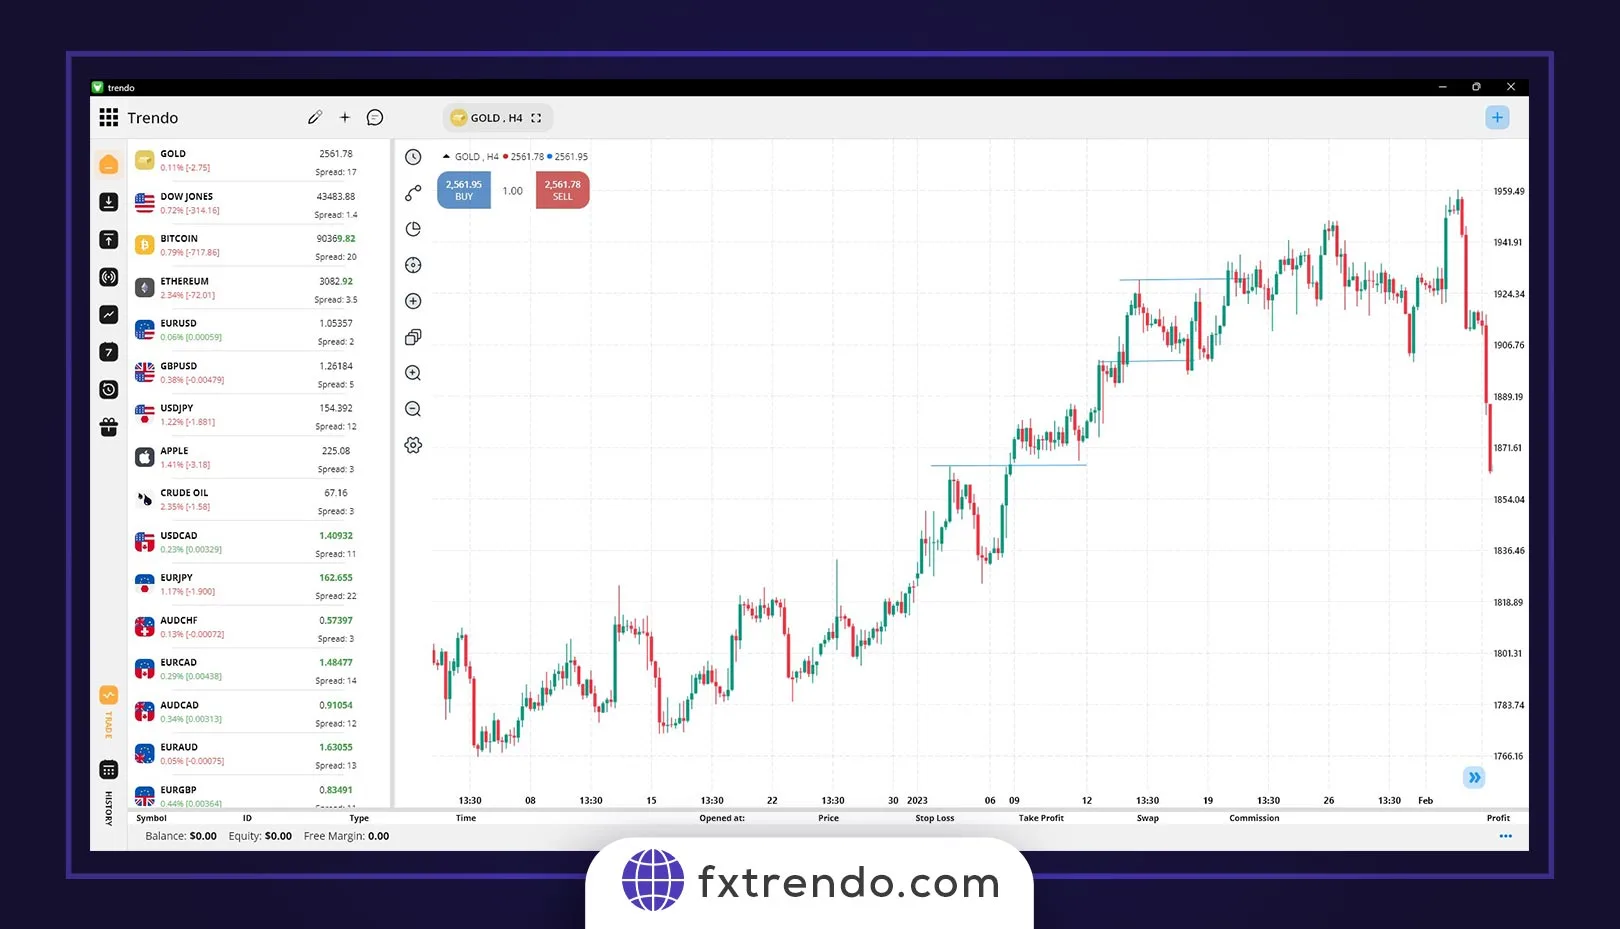
In a specific trend, for example, in a downtrend, when the price crosses the previous floor to create a new floor (LL), a breakdown of structure has occurred, and similarly, in an uptrend, a break in A structure or BOS occurs when the price rises and rejects its most recent high. The crucial point in identifying the trend is that we need at least one BOS to confirm a trend. Note that the previous ceiling or floor’s crossing must occur with the close of one candle, and we need to close at least one candle after that level to create and confirm a BOS. Stay further with two examples of descending and ascending BOS. We see a long-term bearish trend in the first example, which is from the global symbol of gold (XAUUSD). Maybe you want to do trades on gold, but your concern is to find a broker for trading gold . You can easily use the services of Trendo Broker to trade in gold by registering with the Broker.
Change Of Character (CHOCH)
Change of Character is another concept you should know in structureology. A change in the structure is the first sign of a change in the trend. In other words, a process ends with CHOCH. For example, in a downtrend, the price moves down with the BOS of the price floor. The presence of BOS during a trend indicates the strength of that trend. But suddenly, the price rises and rejects the last formed ceiling. In this case, a change in the structure (CHOCH) has occurred, and we can say that the market structure has changed from bearish to bullish, but it does not mean that you should enter into a buy trade. In fact, after creating CHOCH, you have to wait until a BOS is created for the uptrend and the uptrend is confirmed. Note that to confirm a CHOCH, unlike BOS, we do not necessarily need a candle close, and crossing the previous ceiling or floor with the candle shadow is also sufficient. Below, you can see examples of descending and ascending CHOCHs:
Range Market
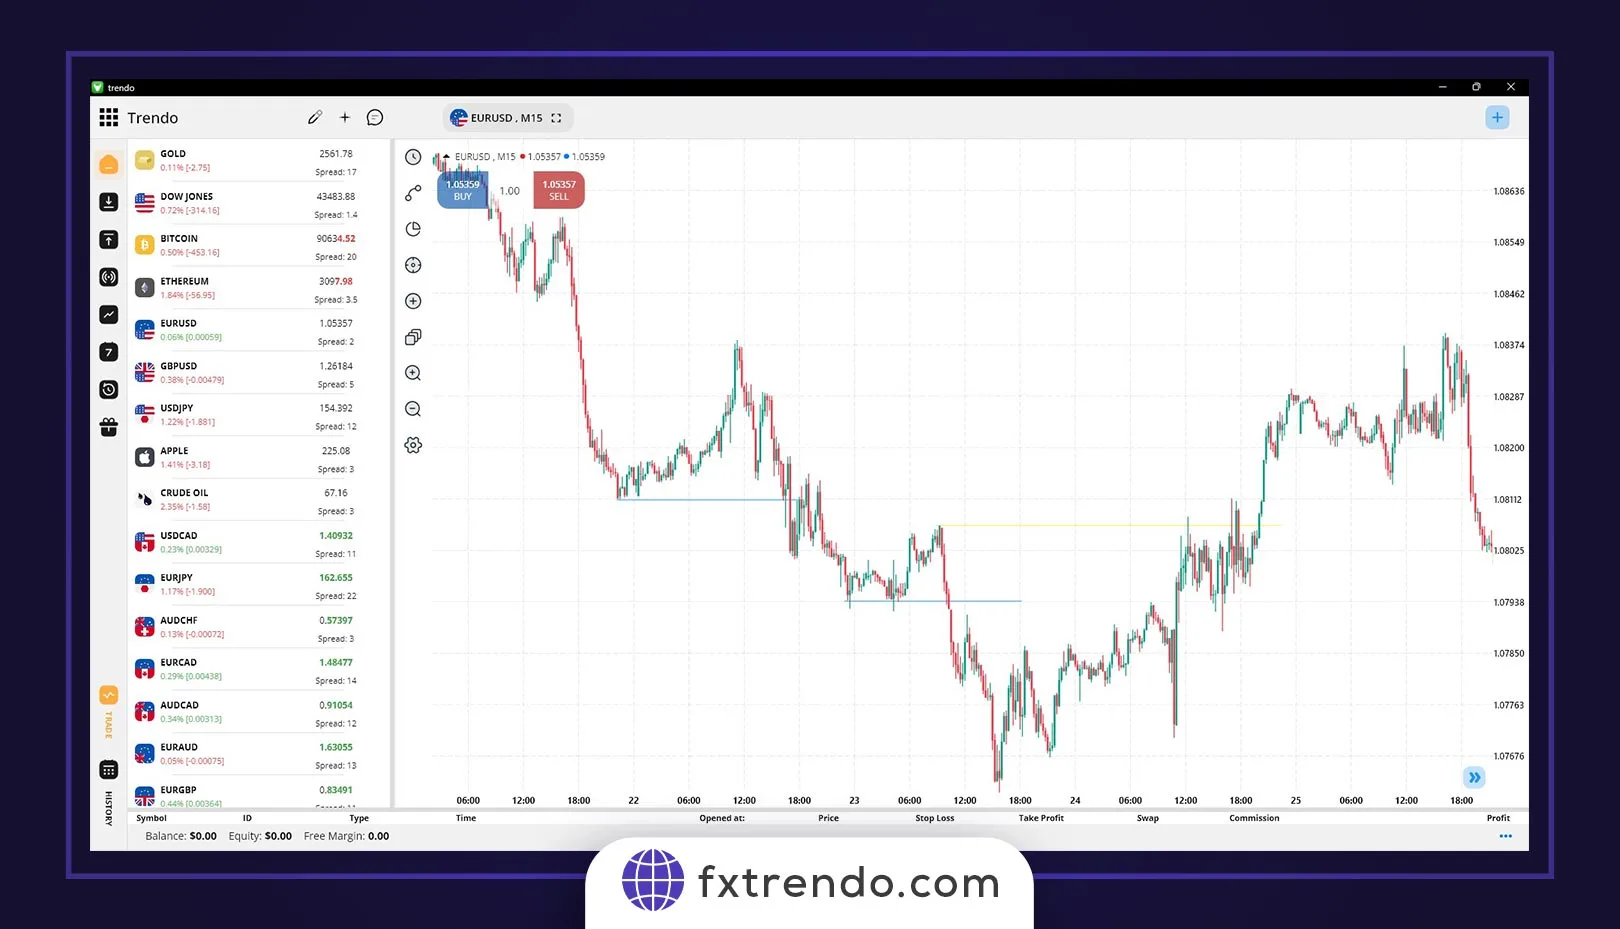
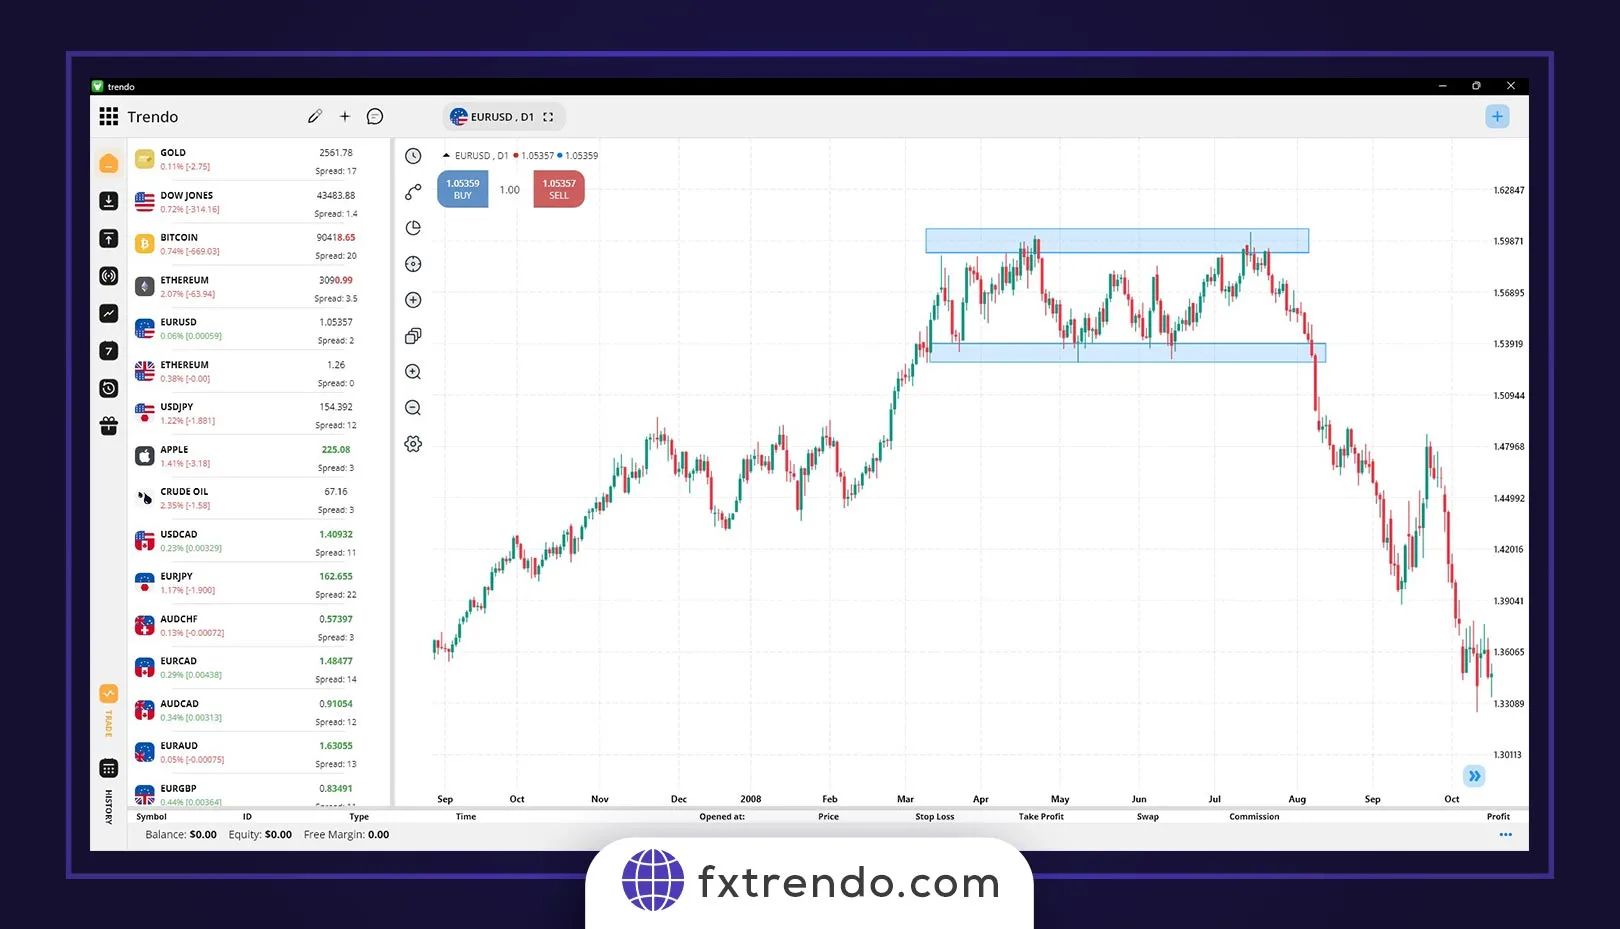
In addition to the bullish structure and the bearish structure we introduced, the third mode created in most cases in the market is the ranging or turbulent structure. In this case, the power of buyers and sellers is almost equal, and there is no special trend in the market. Many traders believe that the market is ranging 80% of the time. So, you must be very patient to start a trend. The crucial point in trading is that if you cannot easily determine the market trend, it is probably a ranging market, and in this case, it is better not to enter the trade, but if you are going to trade in a ranging market, the conventional strategy is to sell at the last high and buy on the last low. In short, BLSH (Buy Low, Sell High). For example, in the image below of the EURUSD currency pair, we see a range structure in the 30-minute timeframe that you could make a good profit with the BLSH strategy. However, note that trading in the ranging market requires a lot of skill and experience, and we recommend that you do these trades with a low volume at first.
How to enter the trade
Now that we analyzed the market structure and identified the trend. How should we enter into the trade?
It's simple! After identifying and confirming the trend, you should try to enter a trade in the trend direction at the end of a corrective movement. But the main question is how to recognize the end of a corrective movement. Further, we intend to address this point.
The following methods are usually used to identify the end of a corrective movement:
- Block order
- Fibonacci 50% and 61.8%
- Moving Average
- Trend lines
Block order: When we are in a confirmed trend, and the price starts to correct, identify block orders in the last impulsive move. These price levels have a high potential for price reversals, and usually, corrective movements end by hitting a block order, and a new impulsive movement begins.
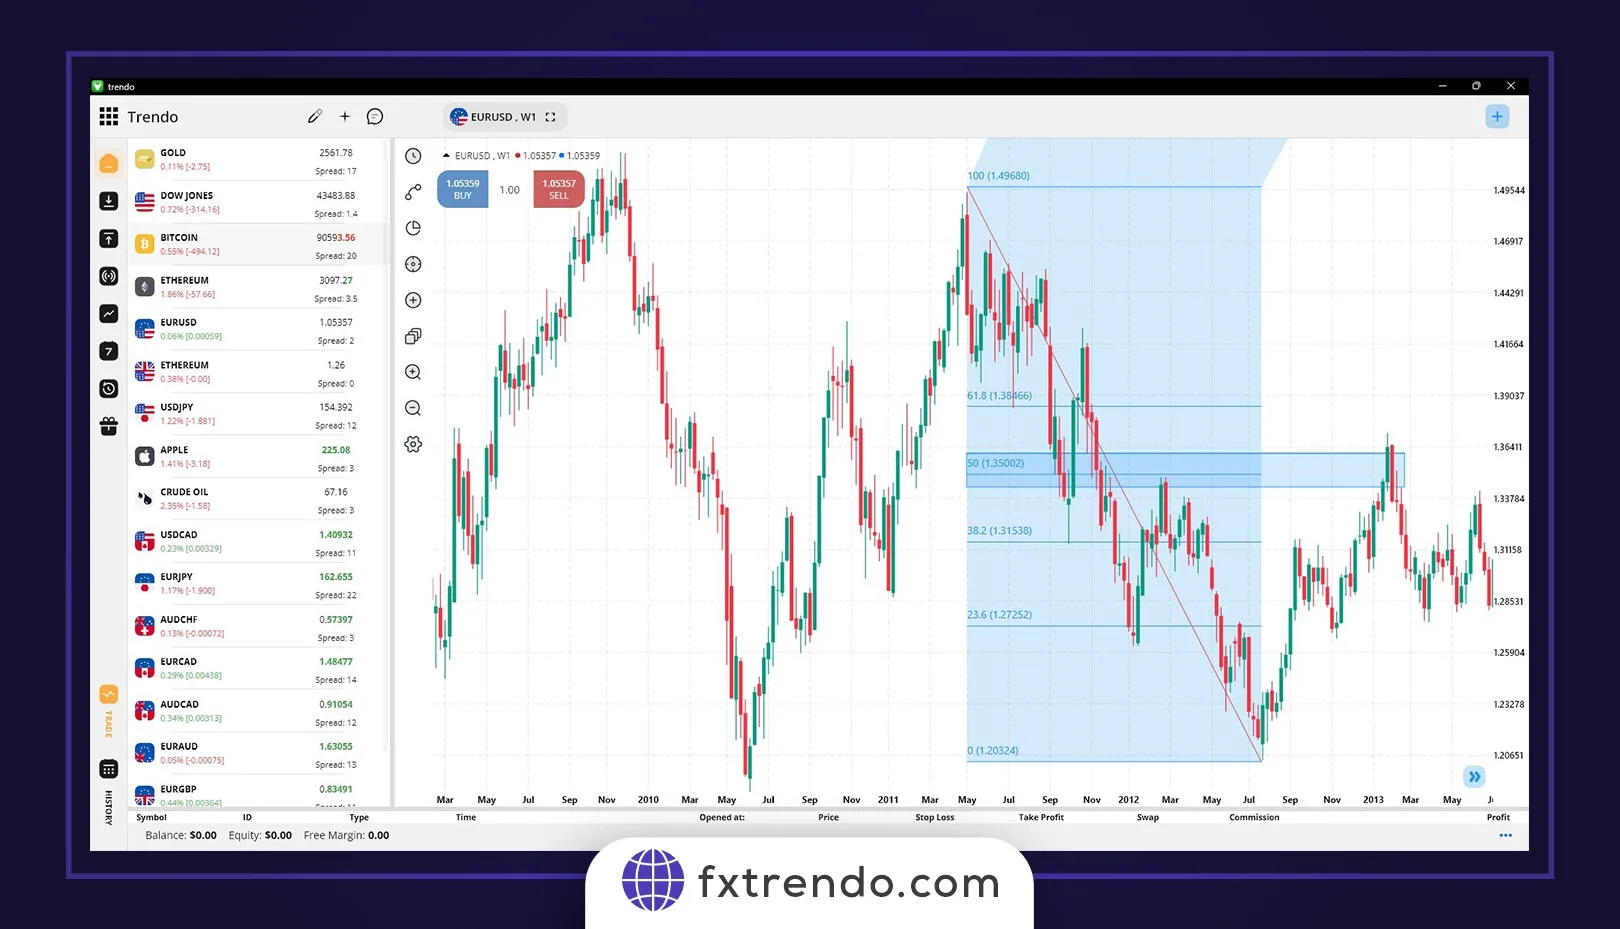
Fibonacci 50% and 61.8%: One of the other crucial levels that can return the price and end corrective movements are the 50% and 61.8% Fibonacci levels. Simply put, when the price corrects 50 or 61.8% of its last impulsive movement, we can expect a reversal and the start of a new impulsive movement. For example, in the image below of the gold symbol (XAUUSD), we see a bearish trend in the daily timeframe. Further, the price has retraced to the 61.8% level of the last movement, and since, the price has reached a strong resistance level (gray area) in addition to the 61.8% Fibonacci level, traders have entered a sell trade in the trend direction with more confidence after the confirmation candle closes.
Moving Average: Some traders use moving averages with usually 50 or 100 periods to identify the end of corrective movements. So, the price hitting these levels in the corrective phase is considered a sign of the corrective movement's end.
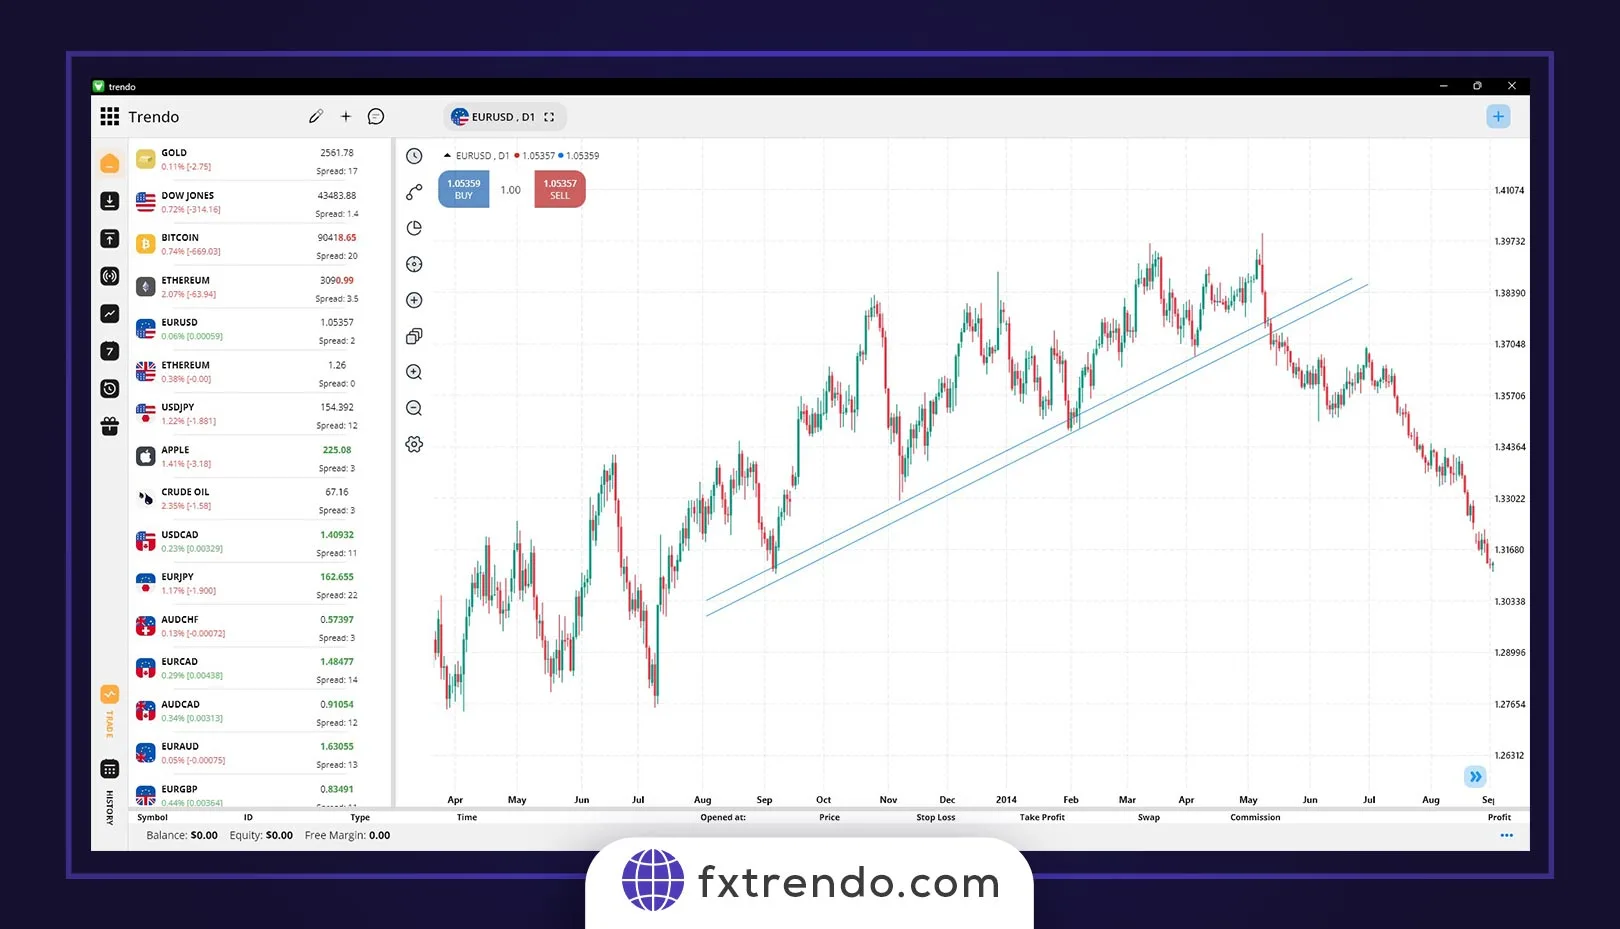
Trend lines: Another tool to find the possible correction endpoint is where the price meets the trend line, which is drawn with the help of the trend's previous two lows or two highs. For example, in the image below of the SPX500 index, we see an uptrend in the one-hour time frame. Further, the price has corrected up to the trend line drawn from the main floors, and traders at this level have entered into a buy trade after closing the confirmation candle.
Here, we introduced helpful methods for identifying the end of a corrective movement. Note that in most of these methods, candlestick patterns are used to confirm the final entry into the trade after the price hits the determined level.
Key points in identifying market structure
- Recognizing the end of a corrective movement requires experience, patience, and a lot of practice.
- After creating a BOS, we usually expect a pullback.
- The structure of larger time frames is more valid than smaller time frames.
- Always trade in the trend direction. Trading against the trend will eventually take you out of the market.
- Never enter a trade before identifying a trend. You're probably in a ranging market when you can't identify a market trend. In such cases, the best thing to do is to wait to start a new trend.
Summary
In this article, we embarked on a journey to understand the concept of market structure in forex and explored ways to identify market highs and lows, breakouts of structure (BOS), and change of character (CHOCH). Also, we provided discussions on how to enter trades and confirm them. Generally, understanding the market structure is of great importance. With a deep understanding of the market structure and the ability to recognize trends and their changes, traders can make better decisions and increase their probability of success.


