ATR indicator explained in a simple and practical way


The ATR indicator is an essential tool in technical analysis that helps traders maximize their profit potential. This indicator provides practical insight into market fluctuations and identifies the most profitable entry and exit points. In this article, we present the following content:
What is ATR?
The ATR (Average True Range) indicator is a technical analysis tool developed by J. Wells Wilder Jr. This indicator was introduced in the book "New Concepts in Technical Trading Systems" in 1978. ATR is designed to measure the volatility of a currency pair by calculating the average range between high and low prices over a specified period.
How is ATR calculated?
To calculate ATR, you must consider the True Range of a currency pair. The actual range is the highest numerical value between the following options:
- The difference between the current candle's high and low price
- The difference between the current candle's high price and the previous candle's closing price
- The difference between the current candle's low price and the previous candle's closing price
Then, to calculate ATR, the average is taken between the actual ranges obtained in the number of specific periods. Usually, in Forex, most traders use the 14th period for this indicator, but it can change according to the trader's strategy in different time frames.
Why is ATR important?
ATR provides traders with valuable insights into the volatility of a currency pair. Traders can adjust their trading strategies accordingly by understanding the level of volatility. ATR can help to determine the appropriate place for Stop-Loss orders and Take-Profit areas. Also, this tool can help identify trading opportunities and assess the risk associated with a particular currency pair.
Read More: Major currency pairs and symbols of the forex market.
Using ATR in Forex trading
Traders can use the ATR indicator in their trading strategy in different ways. These methods include:
- Stop loss and Take profit areas based on volatility
- Identify trade opportunities
- Risk Assessment
- Trend confirmation
We explain each of the above methods below.
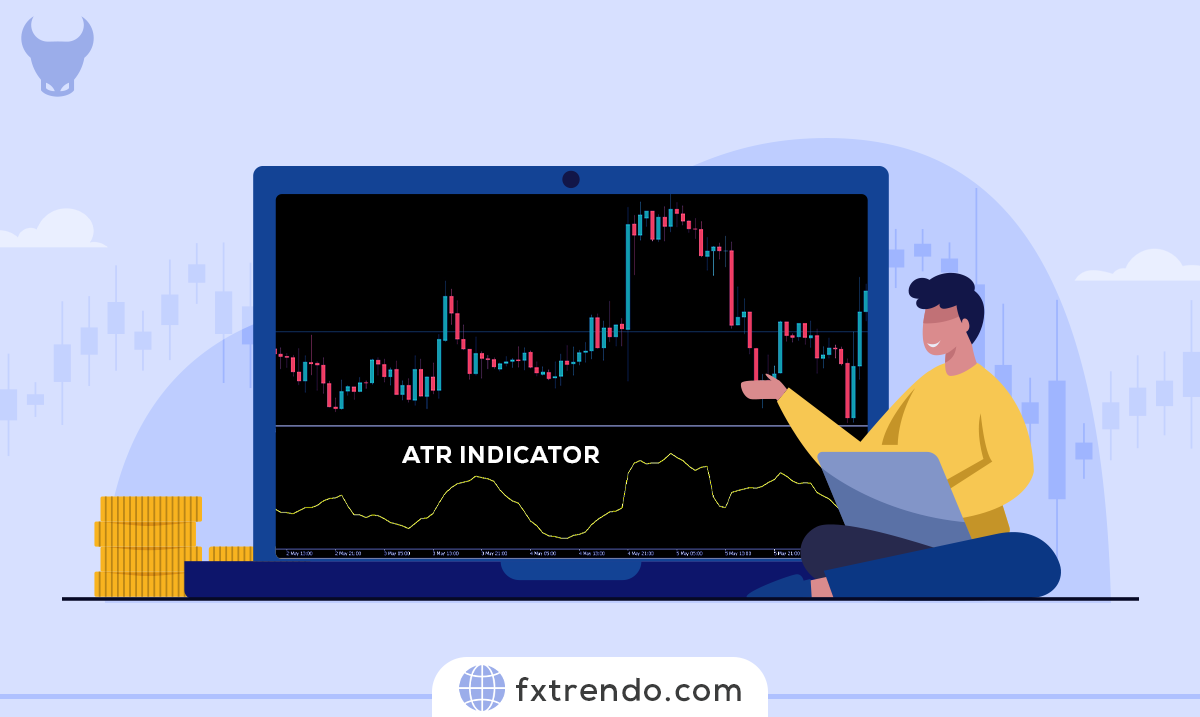
Stop Loss and Take profit areas based on volatility: ATR can be used to determine the Stop Loss and Take profit levels based on the current volatility of a currency pair. When volatility is high, we can set a further Stop loss and Take profit to prevent early stops and Take profits, respectively. On the contrary, in periods with low volatility, stop loss and take profit orders should be placed at closer points and be in line with the ATR indicator. As you can see in the image below, the period between numbers 1 and 2 was volatile, and the ATR indicator also shows this fluctuation well with its upward trend. But we see the period between the numbers 2 and 3 of the candles as a range, and the ATR indicator also verifies this with its downward trend.
Identify trading opportunities: ATR can help identify trading opportunities by paying special attention to volatile periods. One can use ATR to identify breakouts and exiting range periods or significant price changes. Traders can wait for the price to break above or below a certain ATR level before entering a trade.
Risk Assessment: Traders can assess the risk associated with a particular trade by understanding the volatility of a currency pair. A higher ATR value indicates greater volatility and potentially higher risk. Traders can adjust their position size or not trade for effective risk and capital management during volatile periods.
Trend Confirmation: One can use ATR alongside other technical indicators for trend confirmation. When the ATR value increases, it shows the strengthening of the current trend, which indicates a higher probability of a breakout or trend continuation. Conversely, a decrease in ATR value may indicate a trend weakness or a bearish or neutral market that could lead to a reversal trend. View the graph below.
Read More: What is a Trending & Ranging Market?
ATR limitations
While ATR is a valuable tool for analyzing the volatility of financial markets, including the forex market , it has its limitations. ATR, like other indicators, including MACD and RSI, is based on past data and may not accurately predict future volatility. Additionally, ATR does not provide information about the price movement direction and only measures the volatility amount.
Read More: Relative Strength Index (RSI) indicator and teaching its use in technical analysis
An example of trading in the forex market with ATR
Let's take an example to understand how we can use ATR in Forex trading. Suppose a trader wants to trade the EUR/USD currency pair. The trader decides to use the ATR indicator with a 14-day period. As seen in the image below, the ATR value for the EUR/USD currency pair is 16 pips. The trader decides to place a stop loss order twice the ATR value, which will be 32 pips. The trader also decides to set a take profit order twice the ATR value, which will be 32 pips. When a trader enters a buy trade, he places a stop loss order at 32 pips below the entry price and a take profit order at 32 pips above the entry price. The trader monitors the trade, and when the price reaches the profit target, he closes the transaction and makes a profit of 32 pips.
Summary
ATR is a powerful tool that can help forex traders maximize their profit potential by providing valuable insights into market volatility. Traders can determine realistic profit targets and stop-loss areas, identify volatile currency pairs, and make more informed trading decisions by understanding and using ATR effectively. However, combining ATR with other indicators, setting the ATR period, and using the indicator on a trial or demo account is necessary to optimize trading strategies. Traders can use the power of ATR to increase their trading success with proper knowledge and use.


