

If you’ve ever looked at a price chart and noticed a candle with a tiny body at the bottom and a long spike shooting upward, that’s the shooting star candlestick, and it’s one of the most useful reversal signals in all of technical analysis. Traders across forex, stocks, and crypto use this pattern daily to time entries and spot trend exhaustion before it happens.
In this article, you’ll learn what the shooting star looks like, the psychology behind it, how to trade it properly, and how to avoid the most common mistakes.
Open a free demo account with Trendo and practice spotting this pattern on live charts, no risk, no pressure.
What Is a Shooting Star Candlestick?
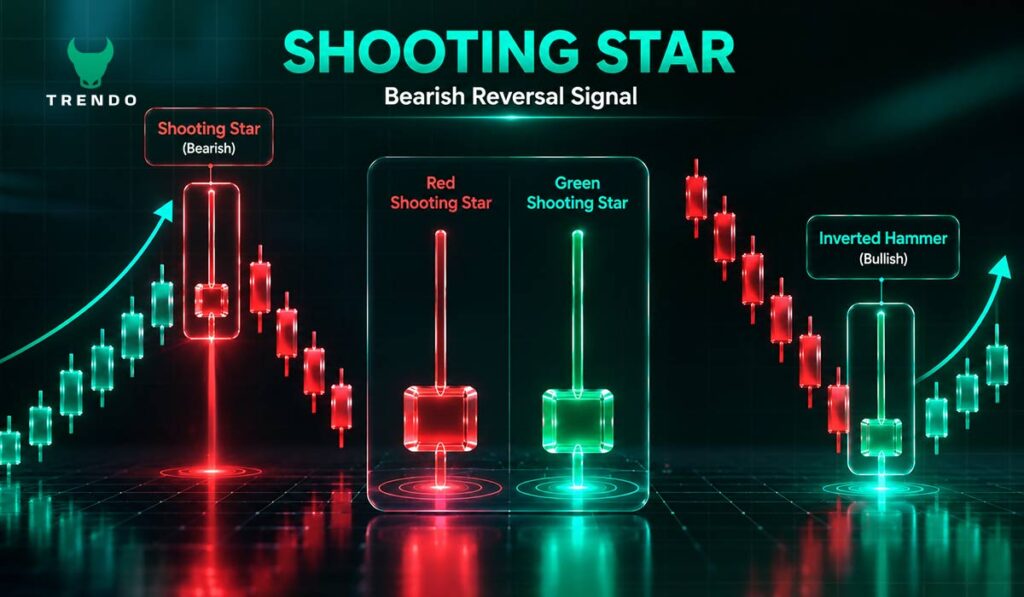
The shooting star candlestick is a single-candle bearish reversal pattern. It forms after an uptrend and signals that buyers pushed prices higher during the session, but sellers took over before the close and drove prices back down, leaving behind a long upper wick as evidence of the failed rally.
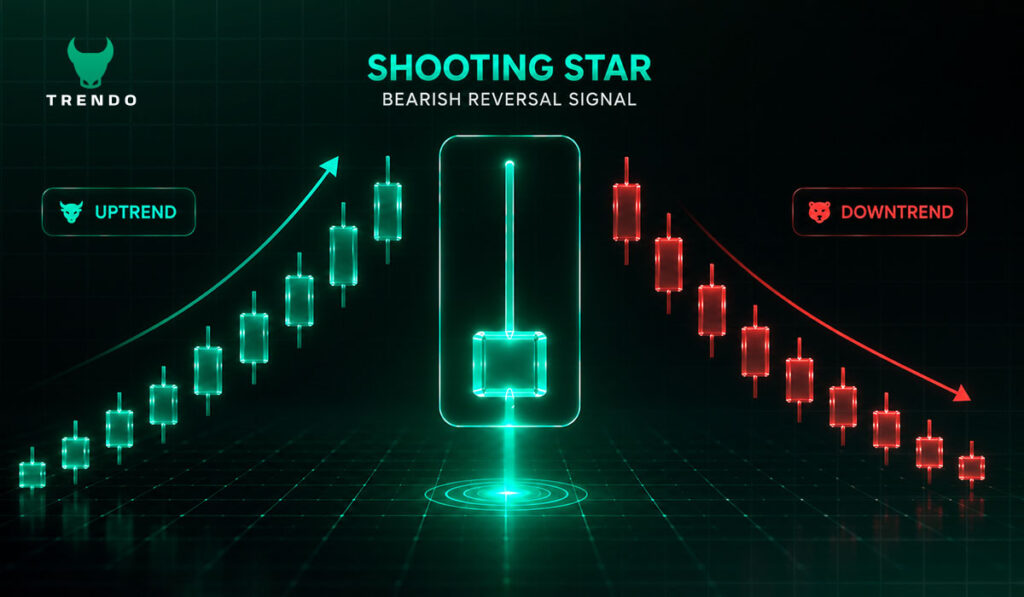
For a candle to qualify as a valid shooting star candle pattern, it needs to meet three structural rules:
- Small real body positioned near the bottom of the session’s range
- Long upper shadow — at least two times the length of the body; the longer, the stronger
- Little to no lower shadow
The name comes from how the candle looks: a tiny body at the base with a long tail reaching upward, like a shooting star arcing across the sky and falling. The visual makes the concept intuitive — price tried to climb, couldn’t hold, and came crashing back.
| Component | What It Tells You |
|---|---|
| Small body at the low | Buyers and sellers ended near where they started |
| Long upper wick | Buyers drove price up, then sellers dominated |
| No lower wick | Price never meaningfully broke below the open |
| Appears after uptrend | Context that gives the pattern its bearish meaning |
The Market Psychology Behind the Pattern
Every candlestick reflects a battle between buyers and sellers. In the shooting star chart pattern, the story unfolds like this: buyers open the session with momentum, pushing prices sharply higher. Then sellers step in (often near a resistance level) and overwhelm the buying pressure. By the close, prices are back near where they started. Buyers tried, sellers won. That shift in control is exactly what makes this a warning signal.
Is the Shooting Star Bullish or Bearish?
The shooting star candlestick is a bearish reversal signal. It does not indicate a continuation of an uptrend; it warns that the trend may be running out of steam.
No pattern should be traded in isolation. The shooting star tells you where sellers stood their ground, but confirmation is what tells you they’re serious.
The bearish shooting star candlestick pattern is the classic form. It typically shows a red body, meaning the close was below the open — sellers not only reversed the intraday spike, but they also pulled prices below the session’s starting point. This makes it a stronger version of the signal.
The shooting star candle bearish setup becomes most reliable when:
- The candle forms after a clear uptrend of at least three to five bullish sessions
- The upper wick is long, and the body is very small
- The pattern appears at or near a known resistance zone
- Volume on the shooting star session is higher than the recent average
One important clarification: a green shooting star candlestick (where the close is slightly above the open) is still a bearish signal. The color matters less than the structure. A green body simply means buyers recovered a fraction of the session; if the upper wick is still long and the body is still small, the pattern remains valid, and the bearish warning stands.
Shooting Star Candlestick in an Uptrend
The shooting star candlestick in an uptrend is the setup you should prioritize above all others. This is where the pattern has the most predictive value, and it’s the version that most professional traders actively seek out.
When price has been rising steadily and then prints a shooting star at or near a resistance level, the message is clear: buyers tested higher ground and got rejected. The higher the price climbed and the harder it fell back, the more significant the upper wick — and the more convincing the signal.
Ask yourself three questions before acting on any shooting star trade pattern in an uptrend:
- Has price been trending higher for at least three consecutive bullish candles?
- Is the shooting star forming at a previous high, trendline, or established resistance level?
- Is the upper wick at least twice the length of the body?
If all three answers are yes, you have a quality setup worth watching for confirmation.
Sign up with Trendo and use real-time charts to scan for shooting star setups across forex and stock markets.
Shooting Star Candlestick in a Downtrend
A shooting star candlestick in a downtrend does appear on charts, but it carries far less weight. In a downtrend, a candle with a long upper wick simply confirms that sellers are still rejecting higher prices — which is consistent with the existing trend, not a reversal. Treating it as a strong sell signal in this context adds little edge and can lead to poor entries.
The bottom line: the shooting star candlestick in a downtrend is not your primary setup. Save this pattern for the top of uptrends, where its reversal implication is at its strongest.
| Context | Signal Strength | Interpretation |
|---|---|---|
| After an uptrend | Strong | Bearish reversal warning |
| At a resistance zone | Strongest | High-probability short signal |
| During a downtrend | Weak | Trend continuation, not reversal |
Bullish Shooting Star and Green Shooting Star
This question creates real confusion among newer traders. A bullish shooting star candlestick is a bit of a misnomer — the shooting star is inherently bearish. However, when a candle with the same shape (long upper wick, small body) appears at the bottom of a downtrend near a support level, some traders use this term to describe it. The more accurate name is the inverted hammer candlestick — and those two patterns share the same structure but carry opposite meanings based on where they appear on the chart.
If you see a shooting-star-shaped candle at the bottom of a move, wait for a bullish confirmation candle before considering any long entry. Do not treat it as a short signal simply because the candle looks like a shooting star.
Green vs Red: Does Candle Color Matter?
A green shooting star candlestick (close above open) is marginally weaker than a red one, since it shows buyers did partially recover, but it is still a bearish pattern when the upper wick is long, and the context is right. Red is stronger; green is valid. Neither should be traded without confirmation.
Shooting Star vs Similar Candlestick Patterns
The candlestick pattern shooting star is frequently confused with three other patterns. Understanding the differences protects you from misreading charts.
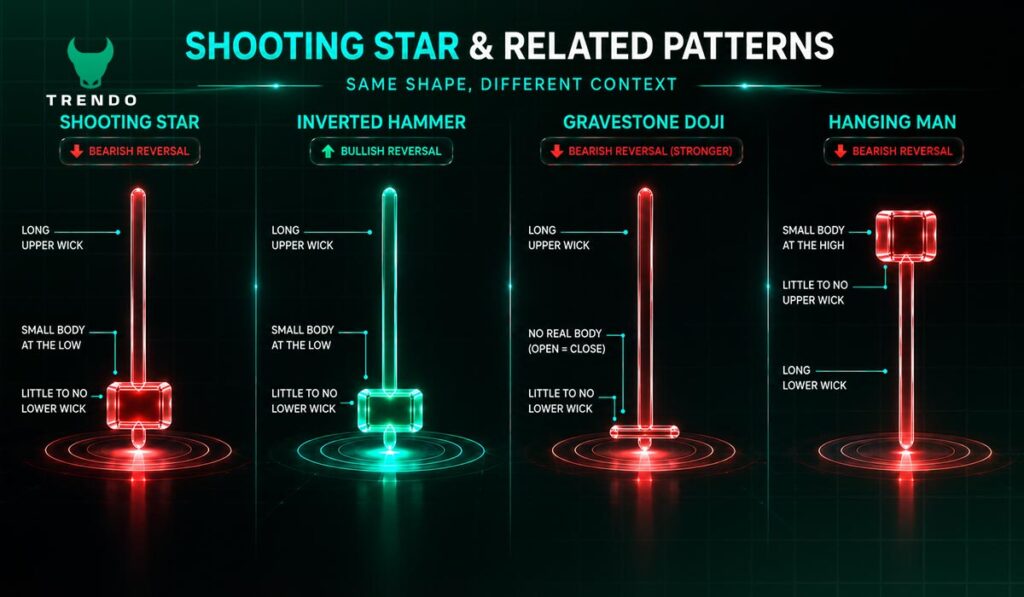
- Shooting Star vs Inverted Hammer: Both have the same structure: long upper wick, small body. The only distinction is position. A shooting star appears after an uptrend (bearish signal). An inverted hammer candlestick appears after a downtrend (bullish signal). Same candle, opposite context, opposite meaning.
- Shooting Star vs Gravestone Doji: The gravestone doji has no body at all — open and close are at the same price. It’s essentially a stronger version of the shooting star because it shows sellers completely reversing all of the session’s gains.
- Shooting Star vs Hanging Man: The hanging man also appears at the top of an uptrend and signals a bearish reversal. The key difference is wick direction: the hanging man has a long lower wick (bullish rejection), while the shooting star has a long upper wick (bearish rejection at the high).
| Pattern | Wick Direction | Appears After | Signal |
|---|---|---|---|
| Shooting Star | Upper | Uptrend | Bearish reversal |
| Inverted Hammer | Upper | Downtrend | Bullish reversal |
| Gravestone Doji | Upper | Uptrend | Bearish reversal (stronger) |
| Hanging Man | Lower | Uptrend | Bearish reversal |
How to Trade the Shooting Star Candlestick
Not every long-wicked candle qualifies as a candlestick shooting star pattern. These five conditions must all be met:
- Prior uptrend: at least 2 to 3 bullish candles before the shooting star
- Upper wick at least 2× the body: the longer relative to the body, the stronger
- Small body: occupying less than one-third of the candle’s total range
- Little or no lower wick: lower shadow shorter than the body
- Resistance context: near a previous high, supply zone, or key price level
Entry, Stop Loss, and Take Profit
A structured shooting star trading approach keeps emotion out of the equation. Follow these steps:
- Step 1: Confirm the setup. Valid structure, clear uptrend, resistance nearby.
- Step 2: Wait for confirmation. The candle following the shooting star must close bearishly. This confirmation candlestick tells you sellers are following through, not just pausing.
- Step 3: Enter short. Most traders enter after the confirmation candle closes. A conservative approach waits for the price to break below the shooting star’s low before entering.
- Step 4: Set stop loss. Place it above the height of the shooting star, the tip of the upper wick. If price breaks above that level, the pattern is invalidated.
- Step 5: Define your target. Aim for the nearest support level below entry, or use a minimum 1:2 risk-reward ratio.
Combining the Shooting Star with Other Tools
A shooting star candle pattern alone is a clue. Combined with other tools, it becomes a conviction trade. The most effective combinations:
- Resistance levels: The pattern is most powerful when it forms at a well-established resistance zone
- RSI above 70: overbought conditions when the shooting star forms create a double warning: the market was already stretched before sellers rejected it
- Volume spike: above-average volume on the shooting star candle, especially in shooting star pattern stocks, confirms that institutional selling drove the move
- Moving averages: a shooting star forming at or below a descending 50-period or 200-period MA adds dynamic resistance to the picture
Forex and Stock Market Applications
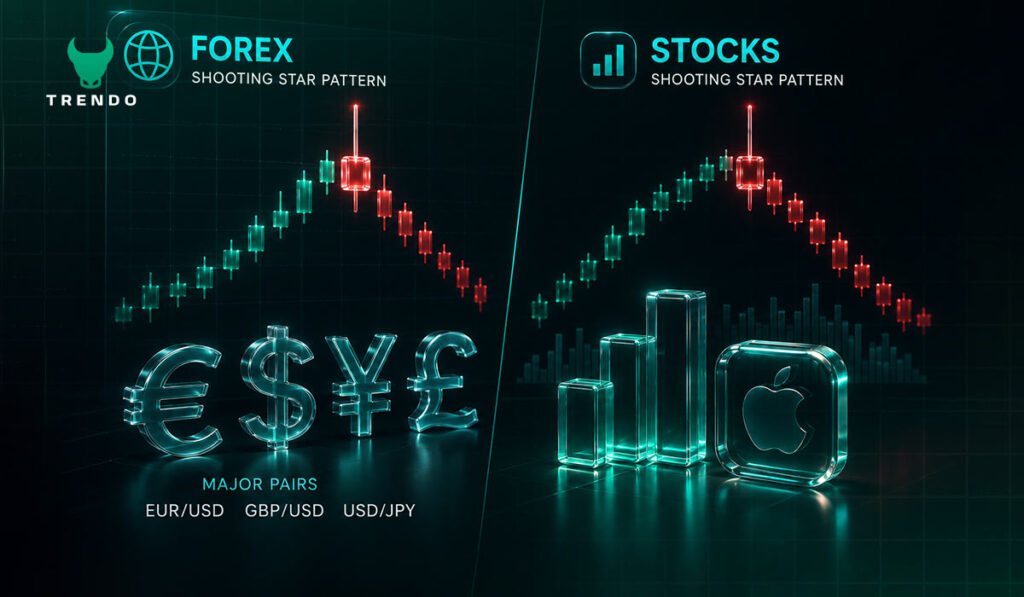
Forex Shooting Star Pattern
The forex shooting star pattern appears across all major currency pairs and is especially effective on H4 and daily charts. Lower timeframes produce too much noise. Practical rules for the forex shooting star pattern trading:
- Always check the economic calendar before entering. A scheduled release can reverse your setup instantly
- Focus on pairs with clear trending behavior: EUR/USD, GBP/USD, and USD/JPY are the most reliable
- Shooting stars forming during the London-New York session overlap carry more weight due to higher volume
Shooting Star Pattern in Stocks
The shooting star pattern stocks setup follows the same logic but with added considerations. Earnings releases can produce shooting-star-shaped candles that are volatility noise, not genuine sentiment shifts — always check whether a report is due. On daily stock charts, volume confirmation is critical: a high-volume rejection signals institutional selling with far greater follow-through than a low-volume wick.
The hammer candlestick pattern is the bullish counterpart worth understanding alongside the shooting star — both appear in similar contexts but signal opposite outcomes.
How Reliable Is the Shooting Star Candlestick?
The shooting star candlestick has a moderate standalone accuracy rate, typically between 50% and 60% when used without additional context. That number rises meaningfully when the pattern is supported by resistance levels, volume, and RSI confluence. Much like the doji candlestick pattern, no single-candle signal is a complete trading system on its own.
The pattern fails most often when the broader trend is unusually strong, and buyers quickly resume control, when volume is too low to confirm genuine selling, or when a major fundamental catalyst overrides the technical setup. To improve reliability: require a confirmation candle every time, take only setups with at least two confluence factors, and never trade the candlestick shooting star pattern against the higher-timeframe trend.
Conclusion: Mastering the Shooting Star Candlestick Pattern
The shooting star candlestick is one of the clearest, most intuitive reversal signals in price action analysis. In a single candle, it tells you that buyers tried to push higher — and sellers shut them down hard. When that rejection happens at the right location (after a sustained uptrend, at resistance, with volume support), the bearish shooting star candlestick pattern becomes a setup worth acting on with real conviction.
Ready to apply this? Open your Trendo account and trade the shooting star with professional-grade tools, tight spreads, and reliable execution.