

If you’re learning technical analysis, you’ve probably asked: what is hammer candlestick? This popular pattern signals a potential bullish reversal after a downtrend, showing that buyers are stepping in as selling pressure fades. Understanding what is hammer candlestick helps traders spot possible market turning points and make smarter trading decisions.
What Is Hammer Candlestick?
A hammer candlestick is one of the most recognizable and widely used single-candle reversal signals in technical analysis. It forms at the bottom of a downtrend and signals that sellers may be losing control — and that buyers are starting to push back.
The name comes from the candle’s appearance: a short body at the top and a long lower shadow beneath it, which resembles a hammer driving a nail. This visual shape tells a story directly on the chart: the market was pushed sharply lower during the session, but buyers stepped in and drove the price back up toward the opening level before the candle closed.
What is hammer candlestick in the simplest possible terms? It’s a price action signal that the market may be bottoming out, not a guarantee, but a meaningful warning that the downward move could be exhausting itself.
What Does a Hammer Candlestick Look Like?
The structure of the hammer is straightforward and consistent:
- A short real body (the difference between open and close) near the top of the candle
- A long lower shadow (wick) that is at least twice the length of the body
- Little to no upper shadow
- The candle appears at or near the low of a recent downtrend
Key Components of a Hammer Candlestick
| Component | Requirement |
|---|---|
| Lower shadow | At least 2× the body length |
| Upper shadow | Minimal or absent |
| Body position | Upper half of the candle range |
| Trend context | Must appear after a downtrend |
What Does a Hammer Candlestick Mean in Trading?
The hammer tells you something very specific about market psychology. During the session, sellers drove the price significantly below the open. But before the close, buyers returned with enough force to push the price back up, essentially “rejecting” the lower levels.
This rejection of lower prices is the core message of the hammer candlestick pattern.
Why Is It Called a “Hammer”?
The term is thought to come from the idea that the market is “hammering out” a bottom. The long lower shadow represents the failed attempt to push prices lower, and the recovery to the top of the candle shows that buyers regained control. When this happens after a prolonged downtrend, it’s taken as a sign that the selling pressure may be fading.
New to candlestick charts? Before diving into the hammer, make sure you understand the basics — read our full guide on what is candlestick to build a solid foundation.
Hammer Candlestick Pattern: Structure & Psychology
Understanding the hammer candlestick pattern requires looking at it in its full context, not just the shape of the candle itself. The pattern is composed of:
- A prior downtrend: the hammer must appear after a series of declining candles
- The hammer candle itself: with the structure described above
- A confirmation candle: the bullish candle that follows and closes above the hammer’s body
Without all three elements, the signal is considered incomplete.
The Psychology Behind the Hammer Pattern
Here is what happens in the market during a hammer candle:
- Opening: Price opens, continuing the bearish mood from the prior session
- Mid-session: Sellers push price aggressively lower, and the lower wick forms
- Late session: Buyers absorb the selling and push the price sharply back toward the opening level
- Close: Price closes near or above the open, creating the short body at the top
This battle between buyers and sellers, with buyers ultimately winning, is why the hammer is treated as a potential turning point.
Where Does the Hammer Candlestick Appear?
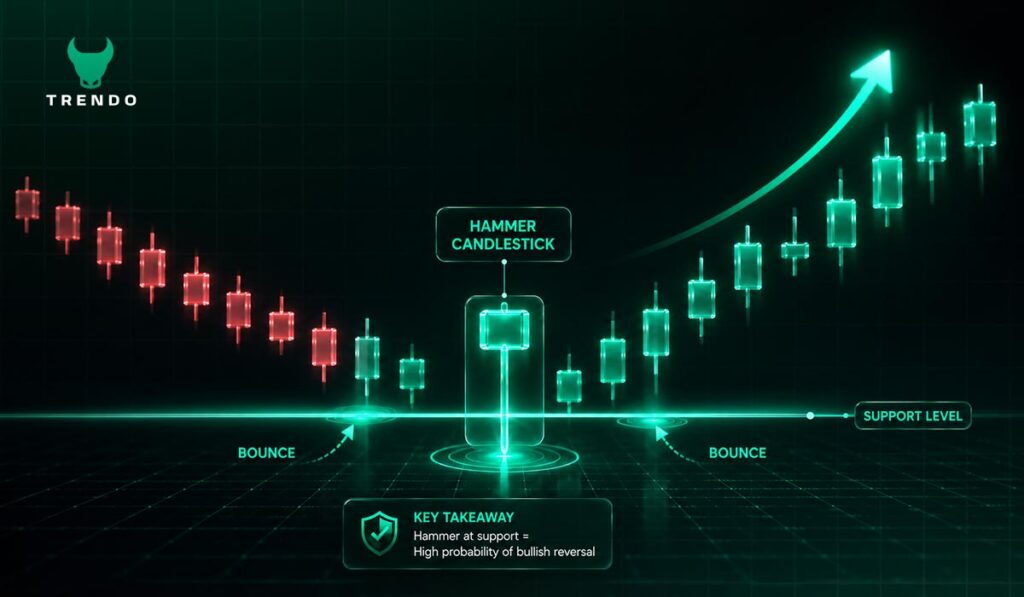
The hammer is most meaningful when it appears:
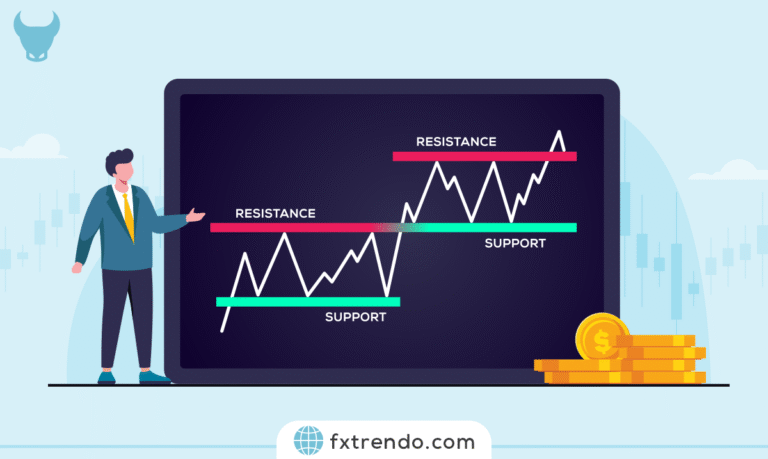
- At or near a key support level
- After a clear and sustained downtrend
- Near historically significant price zones (previous highs/lows, moving averages)
A hammer that appears mid-trend or in a ranging market carries far less weight.
Hammer Candlestick in Different Timeframes
The hammer in candlestick charts that works across multiple timeframes, but reliability varies. Here’s a general guide:
- Daily chart: Most reliable, widely followed by institutional and retail traders alike
- 4-hour chart: Good balance of signal quality and frequency
- 1-hour chart: More signals, but also more false positives
- Weekly chart: Fewer signals, but each one carries considerable weight
For beginners, starting with the daily timeframe is recommended.
Pro Tip: The hammer candlestick is most powerful when it forms at a known support zone. Combine price action signals with support and resistance levels for higher-probability setups.
Is a Hammer Candlestick Bullish or Bearish?
The hammer candlestick is generally considered a bullish reversal signal, but the color of the body matters.
Green Hammer vs Red Hammer: Key Differences
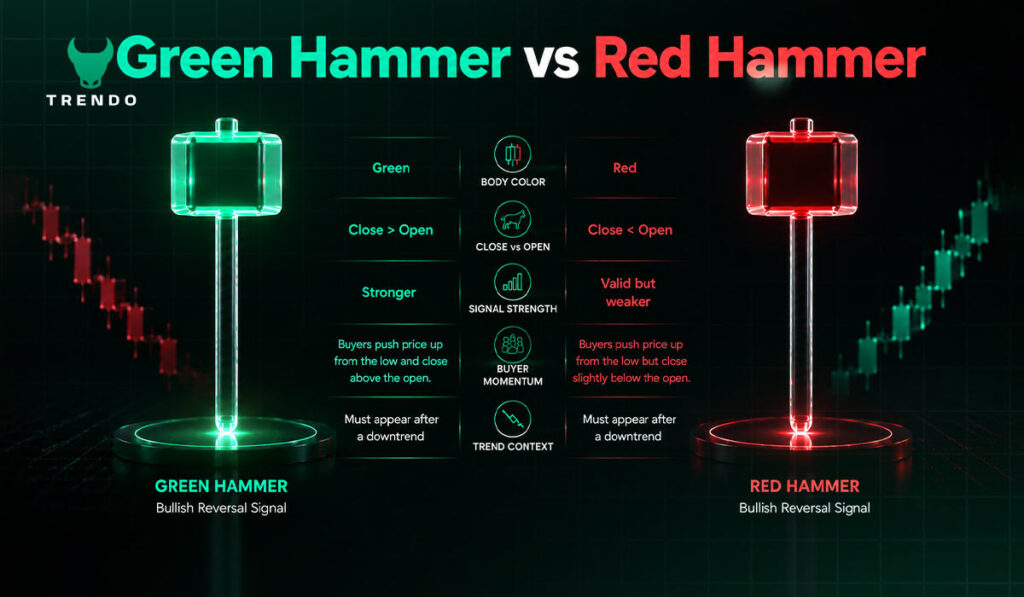
The green (bullish) hammer forms when the price closes above the open. This means buyers didn’t just recover from the intraday low; they also gained ground versus where they started. This is the stronger version of the signal.
The red hammer candlestick forms when the price closes slightly below the open. The lower shadow still shows buyer activity, but the close below the open adds a degree of weakness. A red hammer candlestick is still considered bullish in context, but it requires stronger confirmation before acting on it.
| Type | Body Color | Strength |
|---|---|---|
| Green hammer | Close > Open | Stronger signal |
| Red hammer candlestick | Close < Open | Valid but weaker |
Both types must have the same structural requirements: long lower shadow, minimal upper shadow, short body at the top, and a preceding downtrend.
How to Identify a Hammer Candlestick
Not every candle with a lower shadow qualifies as a hammer. Use these rules:
- The lower shadow must be at least twice the body length
- The upper shadow must be less than 10–15% of the body size (ideally absent)
- The candle must appear after a downtrend of at least 3–5 candles
- The body should sit in the upper 25–30% of the full candle range
If a candle looks similar but appears at the top of an uptrend, it’s not a hammer; it’s a hanging man, which is a bearish signal.
Body-to-Wick Ratio: What Makes a Strong Hammer?
The longer the lower shadow relative to the body, the stronger the signal. A lower wick that is 3× the body length is more impressive than a wick that’s just 2× the body. This reflects more aggressive selling that was completely reversed by buyers.
Confirmation: When Does the Hammer Become Reliable?
The hammer alone is not a trade entry signal; confirmation is essential. A valid confirmation looks like this:
- The candle immediately following the hammer closes bullishly above the hammer’s body
- Volume on the confirmation candle is higher than average
- Price does not fall back below the hammer’s low after the confirmation
Learn more about confirmation signals in our dedicated guide on confirmation patterns.
Hammer Candlestick vs Similar Patterns
One of the most common mistakes traders make is confusing the hammer with similar-looking patterns. Here’s how to tell them apart.
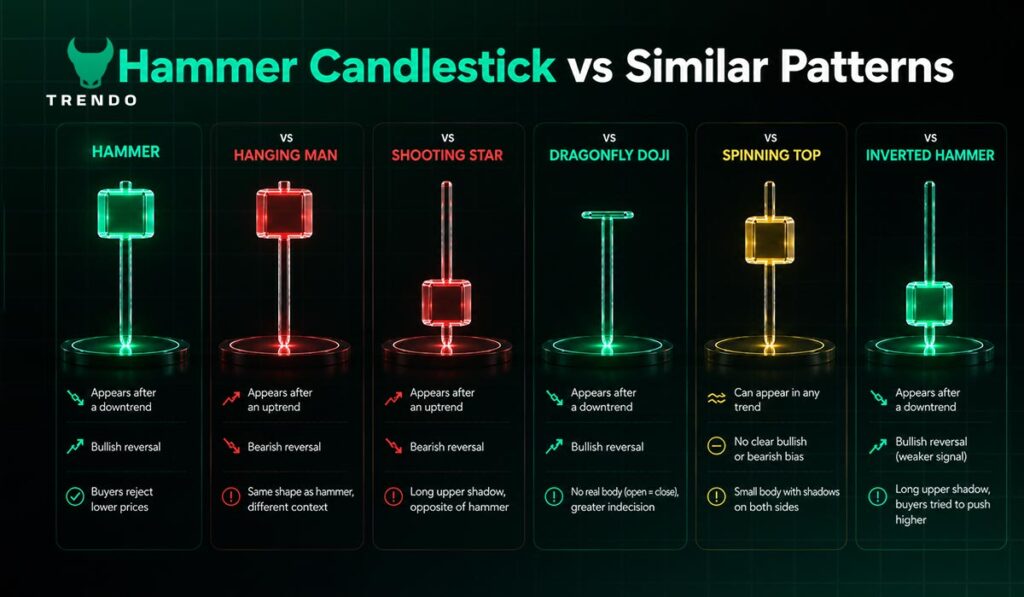
Hammer vs Hanging Man
Both have the same shape, a short body at the top, a long lower shadow, minimal upper wick. The difference is location:
- Hammer: Appears after a downtrend → bullish reversal
- Hanging Man: Appears after an uptrend → bearish reversal
Context is everything.
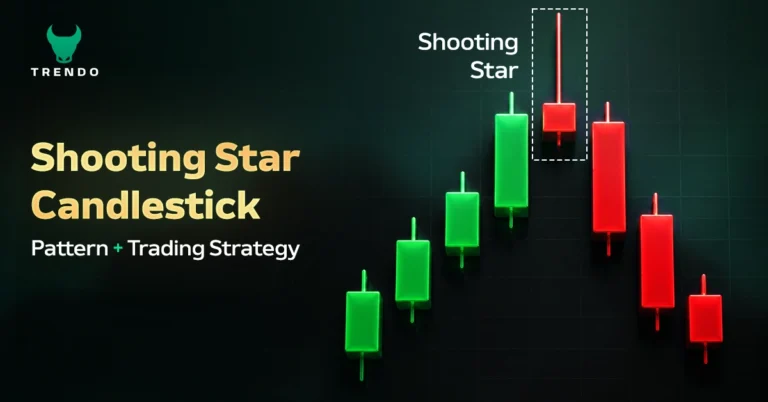
Hammer vs Shooting Star
The shooting star is the upside-down version of the hammer. It has a long upper shadow and appears after an uptrend, signaling a bearish reversal. The hammer has a long lower shadow and signals a bullish reversal. They are mirror images with opposite meanings.
Hammer vs Dragonfly Doji
The dragonfly doji is similar to the hammer but has no real body — the open and close are at the same price. This reflects even greater indecision than the hammer. While the dragonfly doji is also a bullish reversal signal, the hammer typically offers cleaner entries.
Hammer vs Spinning Top
A spinning top has small bodies and shadows on both sides. reflecting broad indecision. The hammer, by contrast, shows a clear directional rejection (of lower prices) with its long lower shadow. The spinning top doesn’t imply a clear bullish or bearish bias.
Hammer vs Inverted Hammer
The inverted hammer also appears after a downtrend but has a long upper shadow instead of a lower one. It means buyers tried to push the price higher during the session (forming the upper wick), but closed near the open. It’s a weaker signal than the standard hammer and requires stronger confirmation.
Quick Comparison Table
| Pattern | Wick Direction | Trend Context | Signal |
|---|---|---|---|
| Hammer | Long lower | Downtrend | Bullish reversal |
| Hanging man | Long lower | Uptrend | Bearish reversal |
| Shooting star | Long upper | Uptrend | Bearish reversal |
| Inverted hammer | Long upper | Downtrend | Weak bullish reversal |
| Dragonfly doji | Long lower | Downtrend | Bullish reversal |
How to Trade the Hammer Candlestick Pattern
This section covers the practical side, how to trade hammer candlestick setups with real rules for entry, stop loss, and trade management.
Ready to apply these strategies in a live market? Open a free demo account with Trendo and practice trading the hammer candlestick pattern with zero risk before putting real capital on the line.
Rules for Trading the Hammer Pattern
Before entering any trade based on the hammer candlestick, confirm the following checklist:
- Prior downtrend is clear and established
- Hammer forms at or near a known support level
- Lower shadow is at least 2× the body
- Confirmation candle closes bullishly above the hammer’s body
- Volume increases on confirmation (when available)
- No major news event is expected to disrupt the move
Entry Point: When to Enter After a Hammer
There are two main entry approaches:
Option 1: Enter at the open of the confirmation candle. This is the more aggressive approach and gets you in early, but it means entering before you have a full confirmation candle.
Option 2: Enter after the confirmation candle closes. This is the safer approach. You wait for the confirmation candle to fully close in bullish territory before entering. You may pay a slightly higher price, but the signal is verified.
Stop Loss Placement for Hammer Trades
Place your stop loss below the low of the hammer candle. This makes logical sense: if the price falls below the hammer’s low, the bullish thesis is invalidated, and the buyers who seemed to be in control have clearly lost that control.
For an additional buffer, some traders add a few pips or points below the hammer’s low to account for the spread and minor volatility.
Hammer Candlestick Trading Example
Imagine EUR/USD has been declining for several sessions, falling from 1.0950 to 1.0780. On a Tuesday, a hammer forms on the daily chart at 1.0780, a level where price has bounced previously. The lower wick extends to 1.0740. On Wednesday, a bullish candle closed at 1.0830, confirming the hammer.
- Entry: 1.0830 (at Wednesday’s close)
- Stop loss: 1.0735 (below the hammer’s low)
- Target: 1.0930 (previous resistance zone)
- Risk-to-reward: Approximately 1:1.5
Combining Hammer Candlestick with Indicators
The what is hammer candlestick pattern question becomes even more interesting when you layer in supporting indicators. The hammer becomes significantly more reliable when it doesn’t stand alone.
Hammer Candlestick + Support & Resistance
A hammer at a key support level is one of the highest-probability setups in price action trading. If the price has bounced from a level before, and then forms a hammer there again, the probability of another bounce increases meaningfully. Support makes the hammer’s low more trustworthy.
Hammer Candlestick + Moving Averages
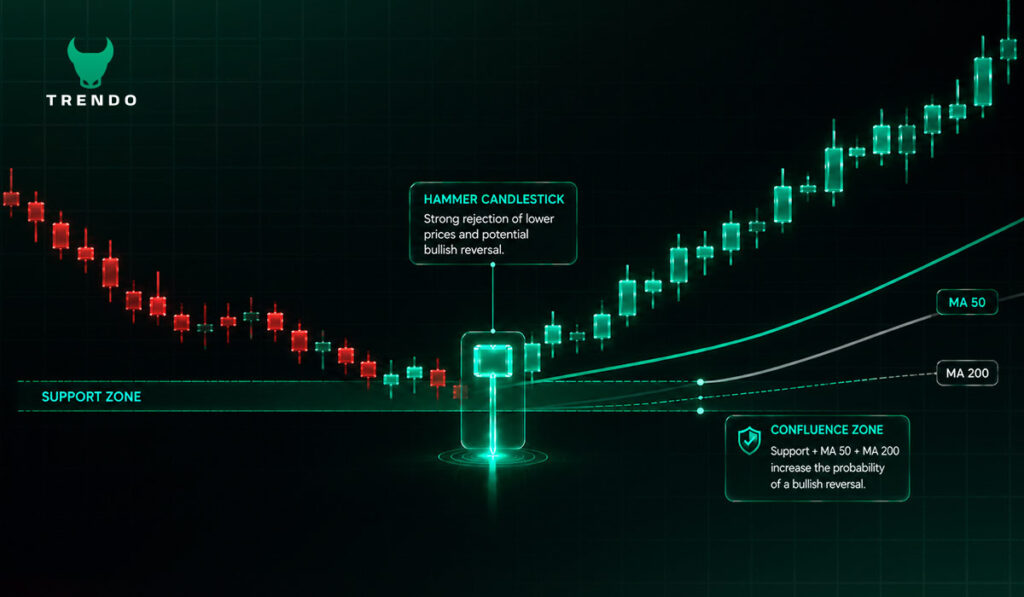
Many traders look for hammers that form near the 50-period or 200-period moving average. These moving averages act as dynamic support levels, and when a hammer forms there, it adds confluence. The more factors aligning at the same price zone, the stronger the case for a reversal.
Hammer Candlestick + RSI
When the RSI is in oversold territory (below 30) at the same time a hammer forms, it strengthens the reversal case. Oversold RSI suggests the market has been pushed too far, too fast — and the hammer shows that price is beginning to respond to that extreme.
Hammer Candlestick + Volume Analysis
Volume is one of the most underused tools in candlestick analysis. A hammer with above-average volume on its sessionو or a high-volume confirmation candle significantly increases the reliability of the signal. High volume means more market participants were involved in the reversal, making it harder for sellers to regain control.
Hammer Candlestick Across Different Markets
Hammer Candlestick in Forex Trading
The forex market is highly liquid and news-driven. Hammer candlestick patterns in forex work best on the daily and 4-hour charts. Avoid trading hammers immediately before major economic events like Non-Farm Payrolls (NFP) or central bank decisions, as the release can easily invalidate the pattern.
Hammer Candlestick in Crypto Trading
Crypto markets are volatile and active 24/7. This makes candlestick patterns like the hammer more frequent — but also noisier. In crypto, hammers on the daily or weekly chart tend to be the most meaningful. Confirmation is especially important in crypto, where fake-outs are common.
Hammer Candlestick in Stock Trading
In equities, hammers are particularly effective when they appear on individual stocks near earnings support zones or after a market-wide correction. Stocks with higher average daily volume tend to produce more reliable hammer signals.
Market-Specific Tips for Trading the Hammer
- Forex: Combine with session timing (London/New York overlap for higher reliability)
- Crypto: Always wait for confirmation; never enter on the hammer candle alone
- Stocks: Look for sector-wide support to align with the individual stock’s hammer
How Reliable Is the Hammer Candlestick?
Hammer Candlestick Success Rate
Studies on candlestick pattern performance suggest that the hammer has a success rate of roughly 60% when used with proper confirmation and context. This is better than a coin flip, but far from infallible. The key is that no single pattern should be used in isolation.
Factors That Affect Hammer Reliability
Several factors improve or reduce the reliability of the hammer:
- Timeframe: Higher timeframes produce more reliable signals
- Volume: Higher volume on the hammer or confirmation candle improves reliability
- Context: A hammer with strong support is more reliable than one in an empty price space
- Market conditions: Trending markets produce better hammer signals than choppy, ranging markets
- Prior trend strength: A stronger, longer downtrend preceding the hammer gives the reversal signal more weight
When the Hammer Pattern Fails
The hammer fails when:
- The confirmation candle doesn’t materialize, price continues lower
- Price briefly confirms but then reverses back down (a “fake-out”)
- A major fundamental event overrides the technical signal
- The hammer appears in a sideways market without a clear downtrend
This is why risk management, particularly a properly placed stop loss, is non-negotiable when trading any candlestick pattern, including the hammer.
Conclusion: Mastering the Hammer Candlestick Pattern
The what is hammer candlestick question leads to one of the most practical tools in a trader’s arsenal. Whether you encounter a green hammer or a red hammer candlestick, a hammer on a daily forex chart or a weekly crypto chart, the core message is the same: sellers tried to push lower, buyers fought back, and the balance of power may be shifting.
Put your knowledge into action. Sign up with Trendo today and start practicing hammer candlestick trades on a risk-free demo account, no deposit required.