

What is a trading strategy?
A trading strategy is a systematic and well-defined program that outlines specific rules and guidelines for participating in the financial markets. This program is a combination of technical and fundamental analysis, risk management, and psychological factors designed to help traders identify, execute, and systematically manage their trades. Traders can make more informed decisions and minimize the influence of emotions on their trading movements by sticking to a trading strategy.
Supply and demand-based Strategies
Supply and demand is one of the main pillars for forex market analysis and forecasting. Currently (2024), supply and demand-based strategies are the most practical trading styles traders worldwide use to increase profitability. Different techniques have been created based on supply and demand, but the 3 primary and notable styles in this field are:
- Sam Seiden’s supply and demand style
- ICT style
- RTM style
Sam Seiden’s supply and demand style
Price action supply and demand is one of the most significant trading styles created by Sam Seiden and is currently one of the most used trading styles in the forex market. Sam Seiden’s supply and demand style is based on the viewpoint that regardless of fundamental news and events, one should check the price chart and formulate the trading strategy based on technical analysis.
In the image below, the supply and demand areas are specified. These areas are more advanced support and resistance levels determined based on the block orders. We will see the start of a new trend when these areas are broken after the confirmation candle closes. But as long as the price does not cross these areas, we can trade based on them.
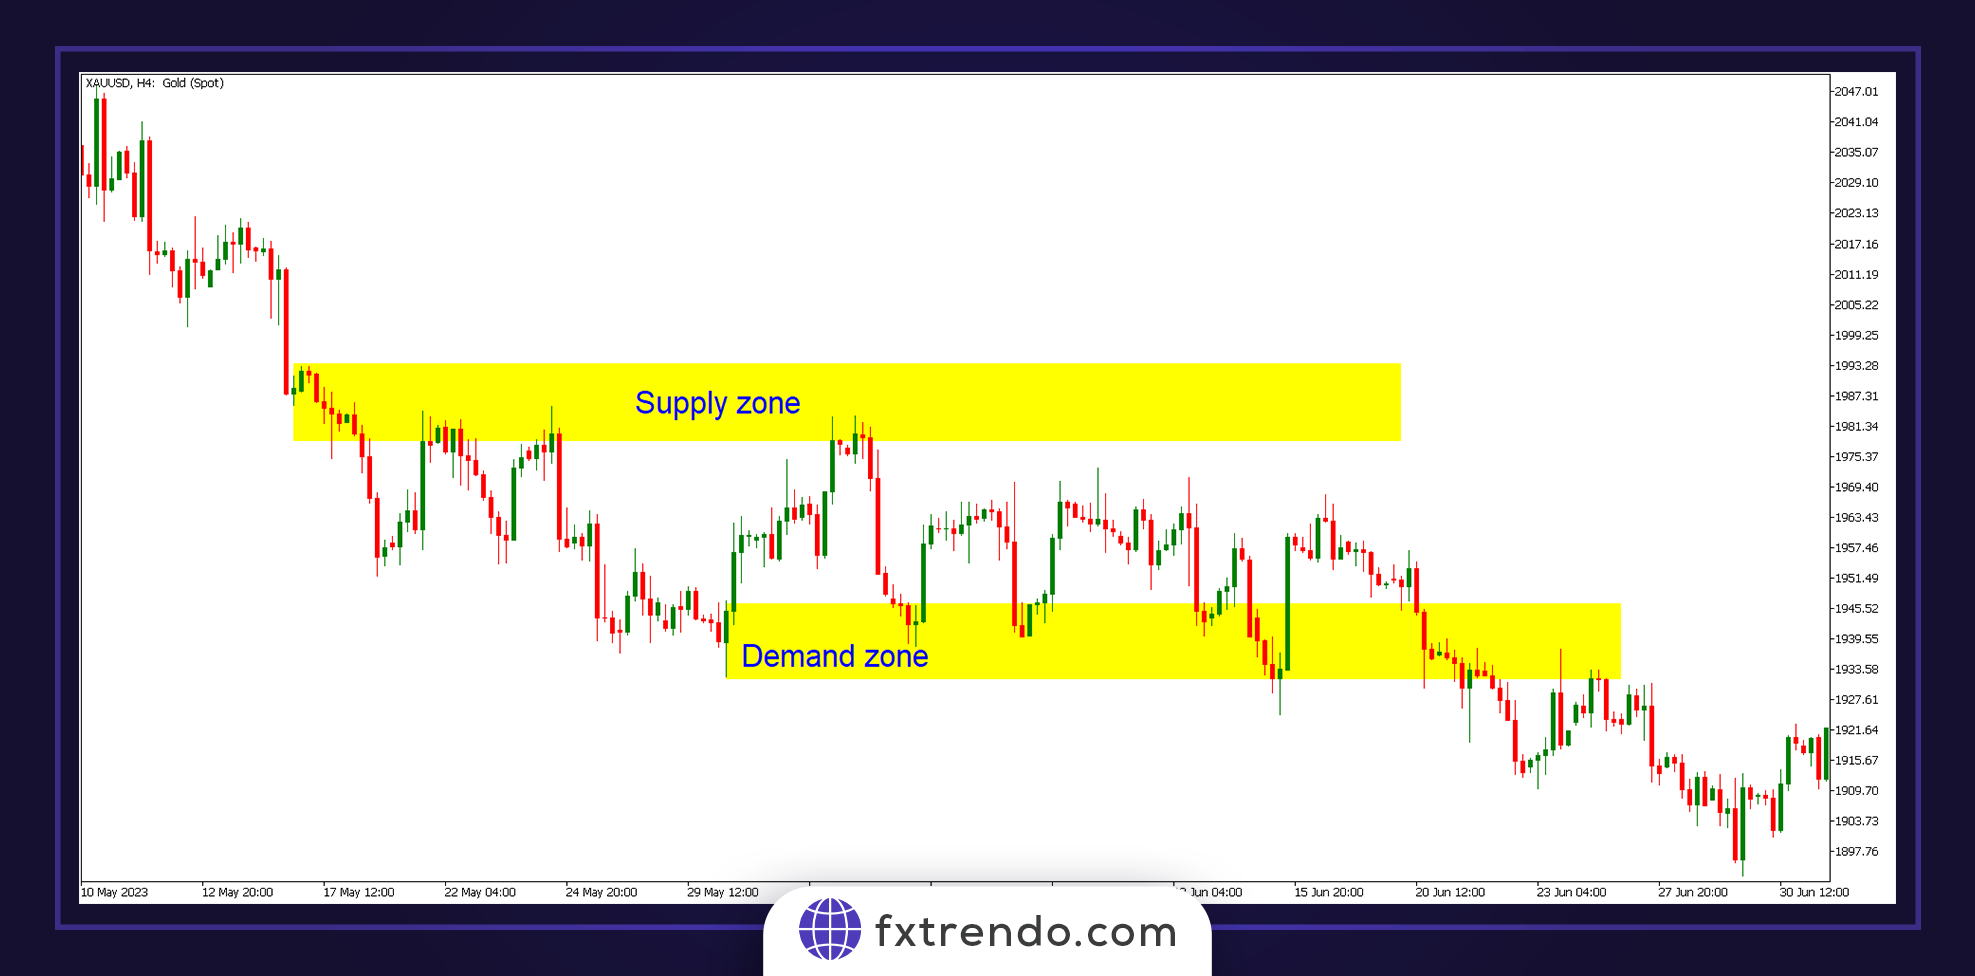
Note that the supply and demand price action seeks to identify a significant area of the price from which there is a possibility of price return, not a specific price. Therefore, traders in this style do not enter trades based on a certain price or a narrow level, such as support or resistance levels.
Important supply and demand patterns
First, you need to learn the following three concepts:
Rally:
A rapid upward movement or an uptrend is called a rally.
Drop:
A rapid downward movement or a downtrend is called Drop.
Base:
The source of movement or a neutral trend is called Base.
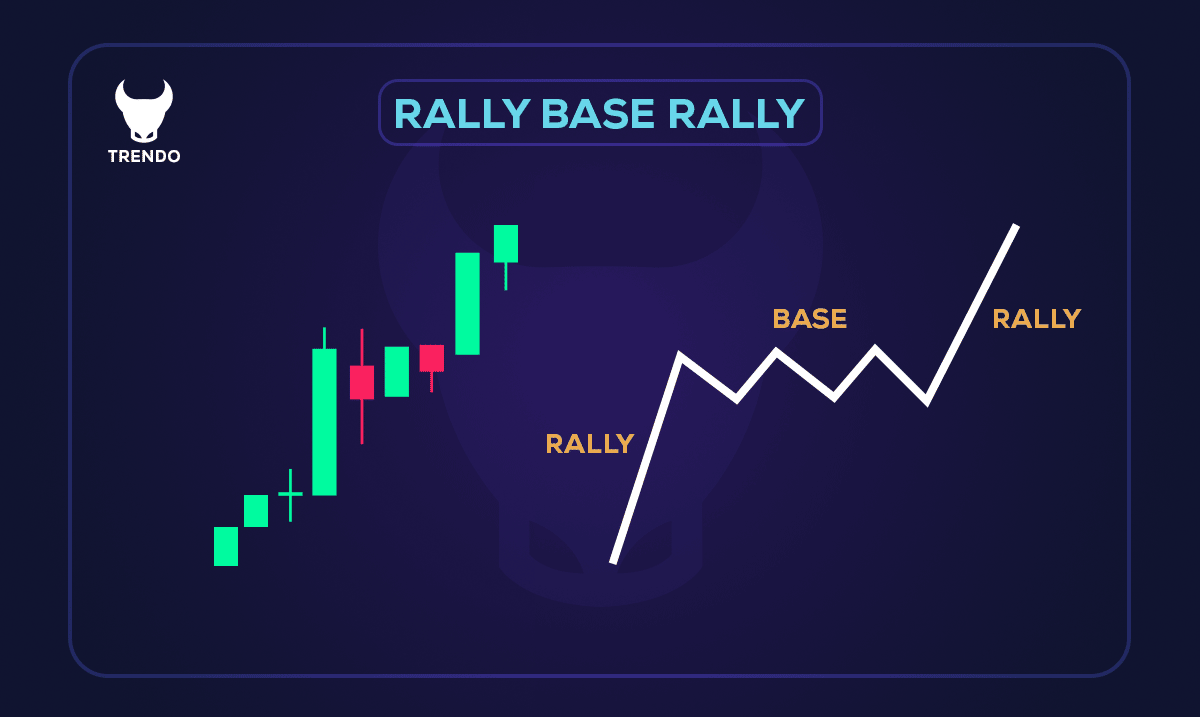
Rally-Base-Rally or RBR pattern
In this pattern, the price first increases, and after the Base movement, it enters the upward phase again. This pattern is in the trend continuing patterns category.
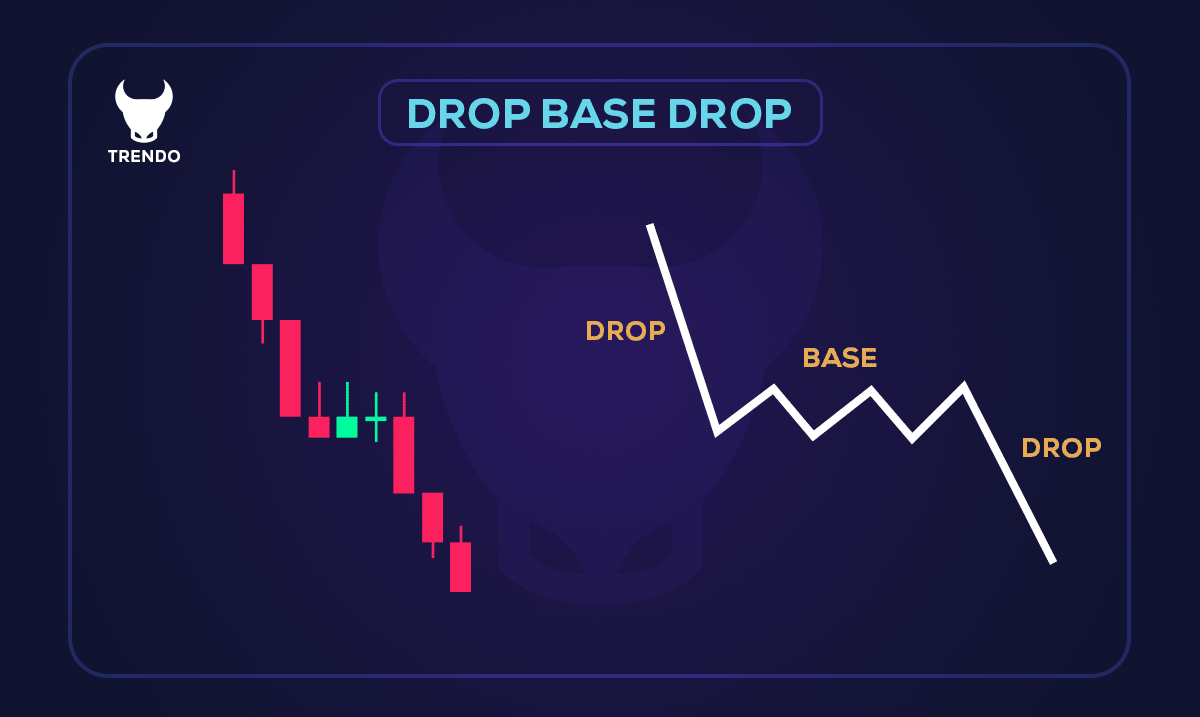
Drop-Base-Drop or DBD pattern
In this pattern, the price first decreases, and after the Base movement, it enters the downward phase again. This pattern is in the trend continuing patterns category.
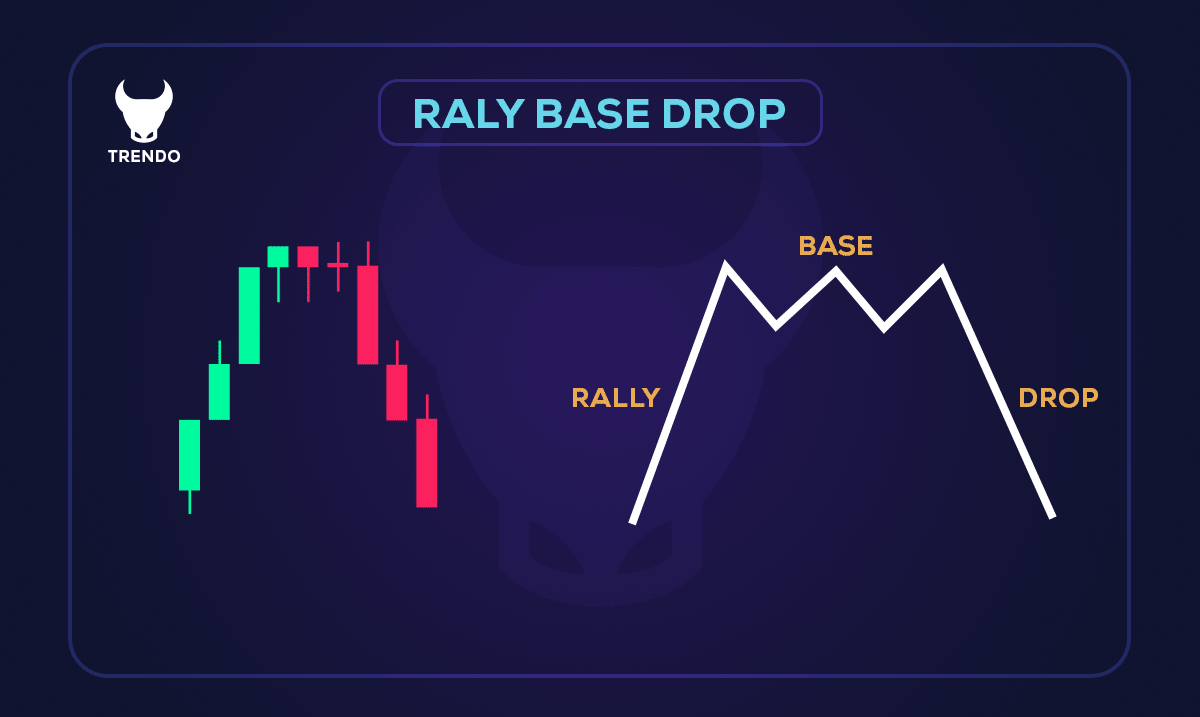
Rally-Base-Drop or RBD pattern
In this pattern, the price first increases, and after the Base movement, it enters the downward phase. This pattern is in the reversal patterns category.
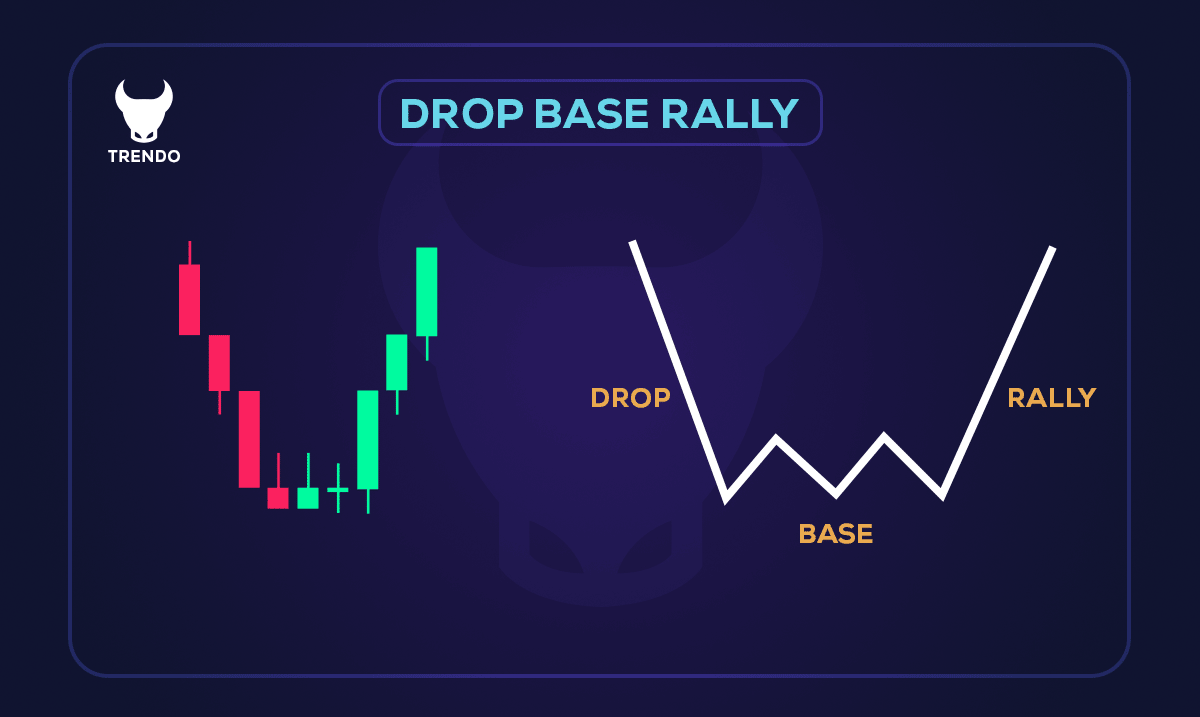
Drop-Base-Rally or DBR pattern
In this pattern, the price first decreases, and after the Base movement, it enters the upward phase. This pattern is in the reversal patterns category.
In this style, after defining the supply and demand areas or Bases, we wait for the price to return to those areas, and we trade the market’s return movement after the price reacts to these levels.
ICT style
ICT stands for Inner Circle Trader. Michael Huddleston, a professional forex trader, invented the ICT trading style. The primary purpose of the ICT strategy is to combine price action and the Smart Money concept to find the best and most accurate entry and exit points in trades. With the ICT technique’s help, traders understand the price behavior and identify the market structure effortlessly. The ICT strategy focuses on finding and using liquidity correctly and tries to help small traders avoid falling into market traps and trade with the market giants. The market structure is defined in four states in the ICT style, Consolidation, Retracement, Expansion, and Reversal.
Consolidation:
The range area means the balance point of the price and is created when the price does not tend to move strongly up or down. Professional traders do not enter the trade and wait for a new move when the market is ranging.
Retracement:
This movement occurs when the price returns a percentage of its previous movement. Outstanding traders always try to trade in the trend direction at the end of retracement movements.
Expansion:
This movement occurs when the price quickly leaves the range. The price’s rapid movement from one area shows the market leaders’ tendency to create a strong trend.
Reversal:
Price movement in the opposite direction of its previous movement is called reversal movement. Reversals are usually a sign of strong block orders.
In this article, we only intended to introduce the ICT style. There are different methods that everyone should check and test according to their trading personality and finally achieve their unique method to enter the trade based on this style. The easiest and best way to trade based on any style is to define and identify the trend according to that style’s rules and enter the trade in the trend direction by finding the retracement movements’ end.
RTM style
IF Myante and his colleagues created the RTM trading style. This trading style is based on the idea that everything is concluded in the price chart, and we don’t need anything but the price chart for trading. There are different patterns in this style, the most important are:
- Quasimodo Pattern (QM)
- Diamond pattern
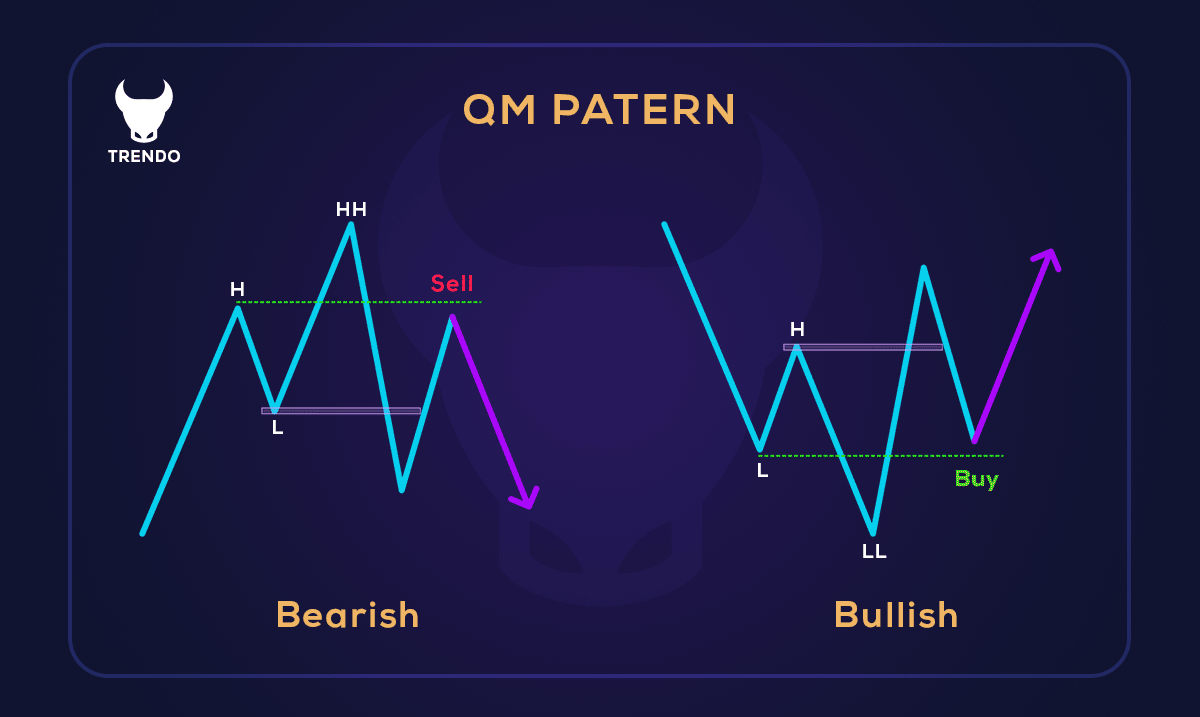
Quasimodo Pattern (QM)
Quasimodo Trading Setup (QM) is the most powerful RTM style pattern in which two opposite movements are created that cover each other, and this movement deceives both buyers and sellers. This reversal setup appears at the end of trends. In this case, it is called a QM range when two ceilings or two floors form.
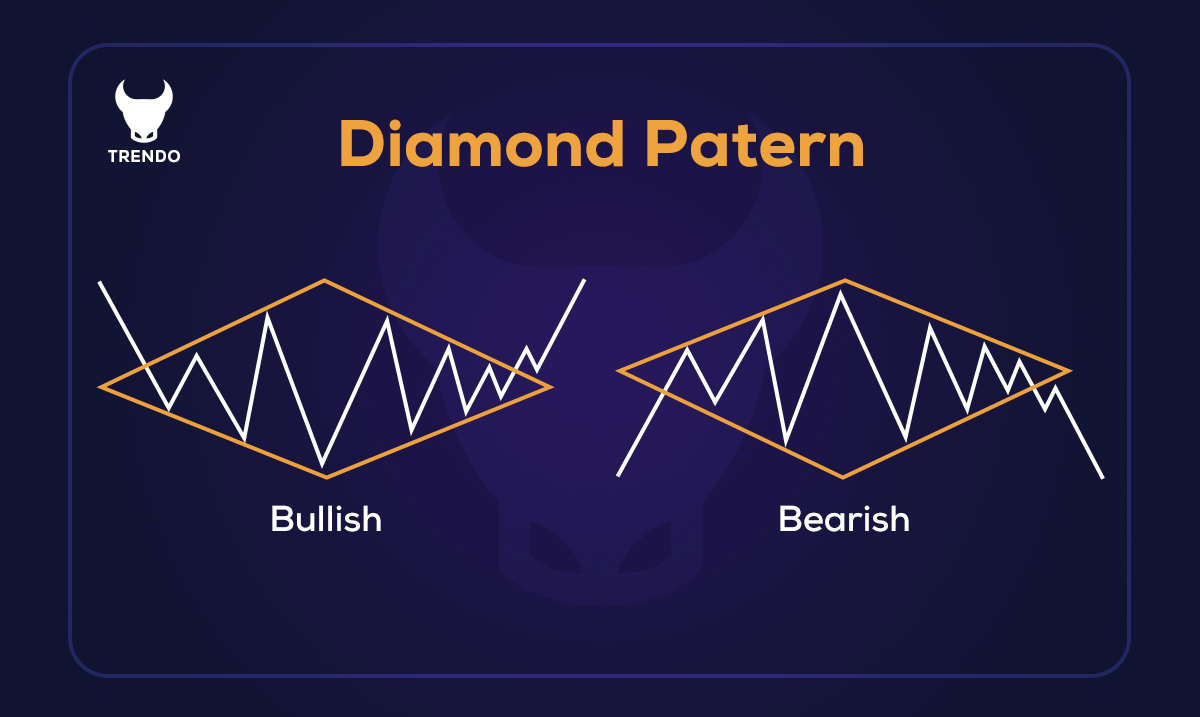
Diamond pattern
A Diamond trading setup is usually formed when a Quasimodo setup fails. This trading pattern is created by connecting two highs (HH) to a third high (HHH) and connecting them to a lower low (LL).
We only intended to introduce the RTM style, like the ICT style in this article. There are different methods that everyone should check and test according to their trading personality and finally achieve their unique method to enter the trade based on this style.
Further, we have divided the trading styles into four methods: day trading, swing trading, scalping, and hold based on a position’s duration, and we will discuss each one in detail. Stay tuned.
Day Trading
Day trading is a fast trading technique in the financial markets that involves entering and exiting positions within a trading day. The purpose of this strategy is to trade short-term price movements. This trading type requires a high concentration, discipline, and risk management. Here, we will discuss day trading, its benefits, and two strategies (one for beginners and one for advanced traders).
Read More: What is the Day Trading Strategy in Forex? Profit from Daily Fluctuations
Why day trading?
Day trading has various advantages, including the potential to make quick profits, not having to face the risk of leaving a position overnight, and the opportunity to take advantage of fluctuations during the day. However, day trading is also riskier and requires a significant time commitment, technical knowledge, and emotional control.
How to day trade successfully?
A trader must develop a strong trading plan, adhere to strict risk management rules, and constantly monitor market conditions for effective intraday trading. Utilizing a well-defined strategy is vital to trading in the forex market. Gold (XAUUSD) is one of the assets popular among day traders, but remember that due to costs such as spreads and commissions, choosing the best broker for gold trading is essential. Further, we introduce two day trading strategies, which are:
- Breakout Trading Strategy (Beginner)
- Ichimoku Kinko Hyo Indicator (Advanced)
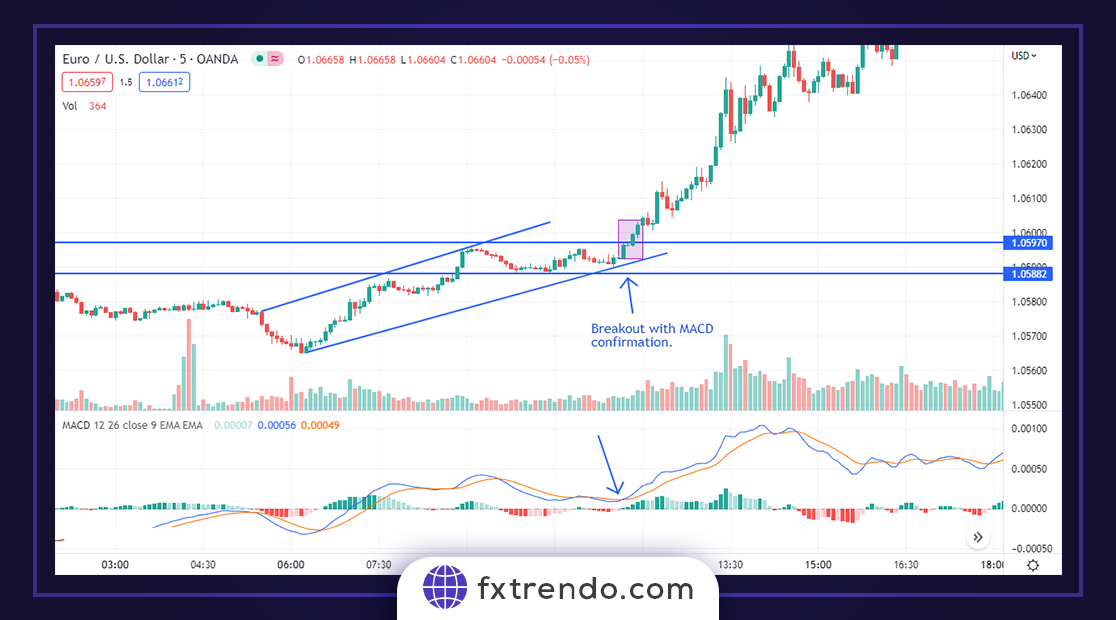
Breakout Trading Strategy (Beginner):
Breakout strategy for day trading is based on the change in a particular asset’s value relative to an important area along with an increase in trading volume. Typically, when an asset exceeds this price level, market volatility increases, leading to a price move in the breakout direction.
Entry point
Deciding the entry point in the breakout strategy is very simple, as it needs a bullish signal and the candle’s closing above the support level to buy. On the other hand, selling requires a bearish signal and the candle’s closing below the resistance level.
Exit point
A trader should analyze the asset’s recent performance to decide his price target. A trader can perform this process with great accuracy by using price patterns and determining floors and ceilings.
Stop-loss
A great way to set a stop-loss is to place an order below the breakout candle for a buy trade and above the breakout candle for a sell trade.
Take-profit
A reasonable target to take profit would be a risk-to-reward ratio of at least one to two.
Ichimoku Kinko Hyo Indicator (Advanced):
The Ichimoku Cloud Indicator a momentum-based tool that helps identify trend direction and support and resistance levels.
Entry point
We use the Tenkan Sen and Kijun Sen crossover lines to enter trade. When the Tenkan Sen crosses above the Kijun Sen, a bullish signal occurs, indicating a buy position above a support level.
Exit point
To define the exit point, a bearish signal appears when the descending Tenkan Sen crosses the Kijun Sen, indicating a sell position below resistance levels.
Stop-loss
To set a stop-loss order, measure the recent price swings average to decide the swing and distance required to breach a buy signal.
Take-profit
A reasonable target to take profit would be a risk-to-reward ratio of at least one to two.
Swing trading
Swing trading is a popular strategy that focuses on making a profit by keeping a position open for a few days to a few weeks. Swing traders seek to profit from natural market cycles using short-term trends and price fluctuations. Here, we will discuss swing trading, its benefits, and two strategies (one for beginners and one for advanced traders).
Read More:
What is the swing trade strategy in Forex? Profiting from medium-term volatility
Why swing trading?
Swing trading offers several advantages, including significant profit potential, a lower time commitment compared to day trading, and a balance between long-term investing and short-term trading. However, it also requires patience, discipline, and the ability to effectively analyze market trends.
How to swing trade successfully?
To excel in swing trading, a trader must develop a strong trading plan, stick to risk management principles, and understand technical and fundamental analysis. Applying defined strategies is also necessary to correctly detect market fluctuations. Further, we explain two strategies for swing trading.
- Moving average crossover strategy (beginner)
- Elliott Waves Strategy (Advanced)
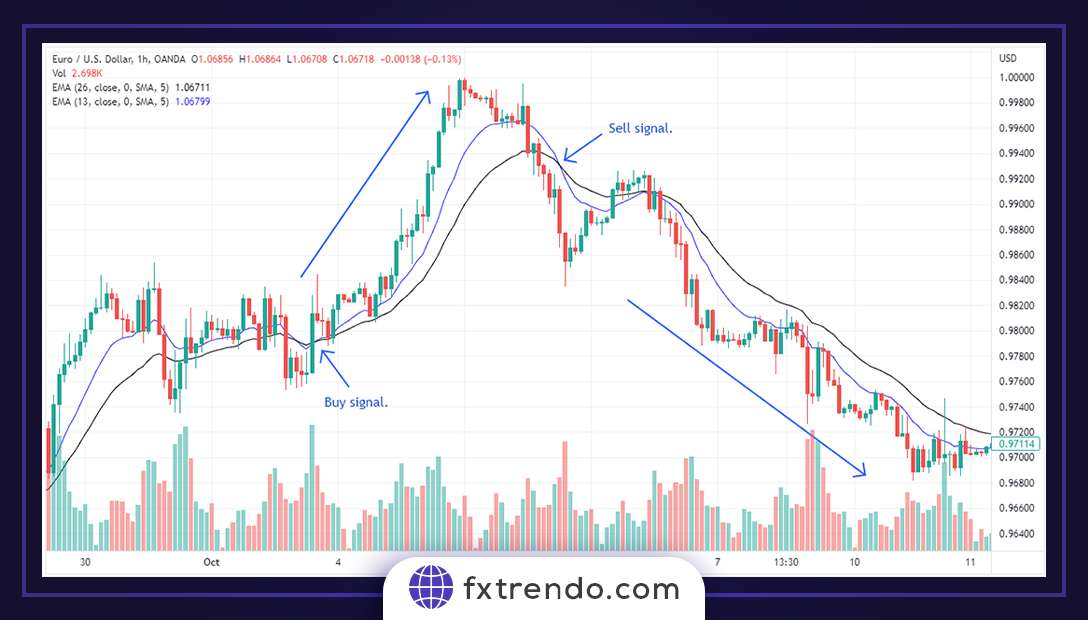
Moving Average Crossover Strategy (Beginner):
The Moving Average Crossover strategy is a popular method for swing trading beginners. This method relies on two short-term and long-term moving averages to create buy and sell signals.
Entry point
A trader enters a long position when the short-term moving average crosses above the long-term moving average, implying an uptrend’s beginning.
Exit point
A trader exits a position when the short-term moving average crosses below the long-term moving average, indicating a possible downtrend.
Stop-loss
You can place a stop-loss order below the recent swing to avoid big losses.
Take-profit
When the trader reaches a predetermined price target or observes a trend reversal signal, he can exit the trade.
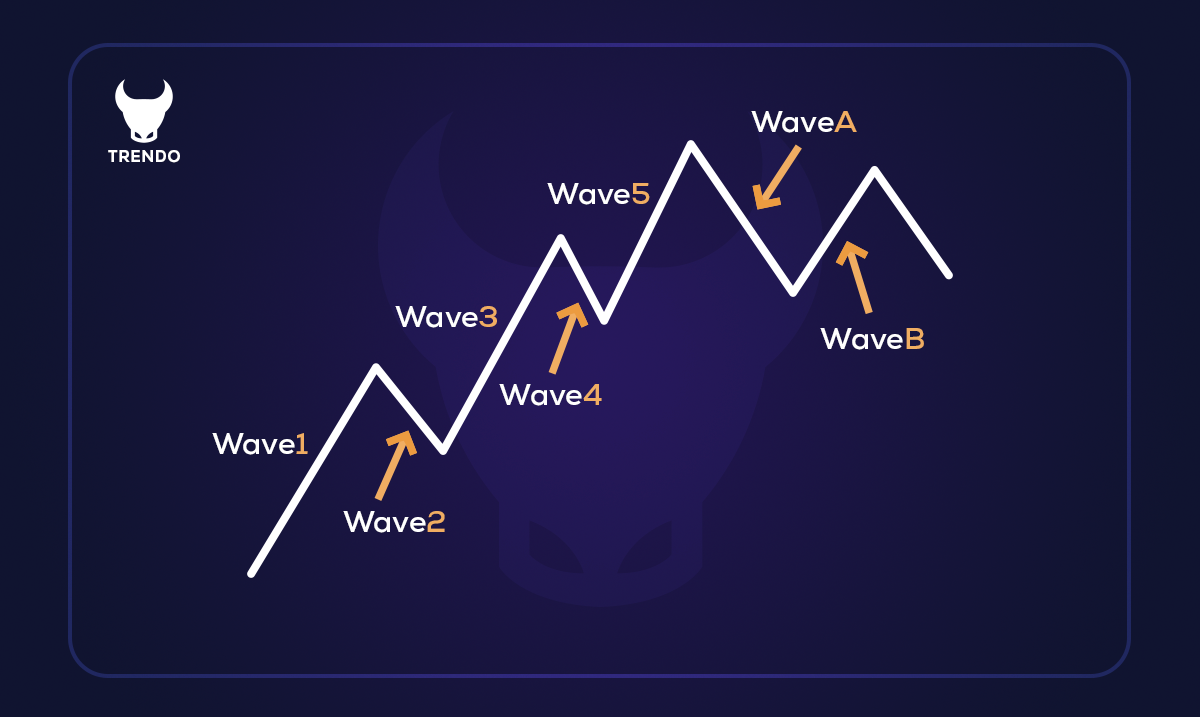
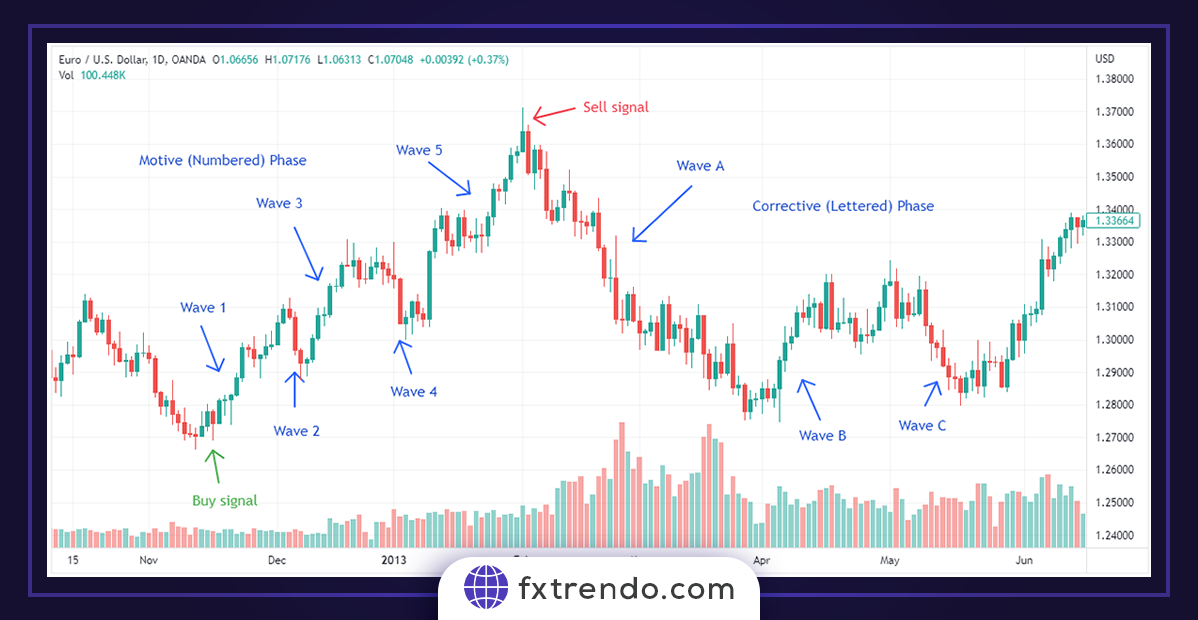
Elliott Waves (Advanced):
Elliott Waves Theory is an advanced method of technical analysis that aims to predict price movement based on recurring wave patterns caused by the investors’ and traders’ mentality or sentiments. This complex theory determines two types of waves: impulse waves and corrective waves.
Entry point
Traders using Elliott Wave Theory enter trades when they detect the beginning of a new impulse wave or the end of a corrective wave.
Exit point
Traders exit the position when they expect the impulse wave to end or a corrective wave is about to begin.
Stop-loss
To limit potential losses, traders can place a stop-loss order in an uptrend below the recent low and a downtrend above the recent high.
Take-profit
To exit the trade, one can act based on the previous impulse wave’s Fibonacci ratios or when the trader foresees the current wave pattern’s completion.
Scalping
Scalping is a strategy with many trades that aims to profit from small price movements in the market. This method involves entering and exiting several trades in a short timeframe by taking advantage of rapid market fluctuations. Here, we discuss what scalping is, its benefits, and two strategies (one for beginners and one for advanced traders).
Read More: Scalper and Scalping Strategy in Forex
Why scalping?
Scalp trading offers an opportunity for quick profits and limited exposure to market risk due to short holding periods. However, it requires strong discipline, fast decision-making skills, and the ability to manage multiple open positions simultaneously.
How to execute scalping effectively?
Successful scalping requires a strong trading plan, careful risk management, and a thorough understanding of technical indicators. Further, we introduce the beginner and advanced scalp trading strategies, which include:
- Parabolic SAR indicator (beginner)
- Bollinger Bands with Stochastic Indicator (advanced)
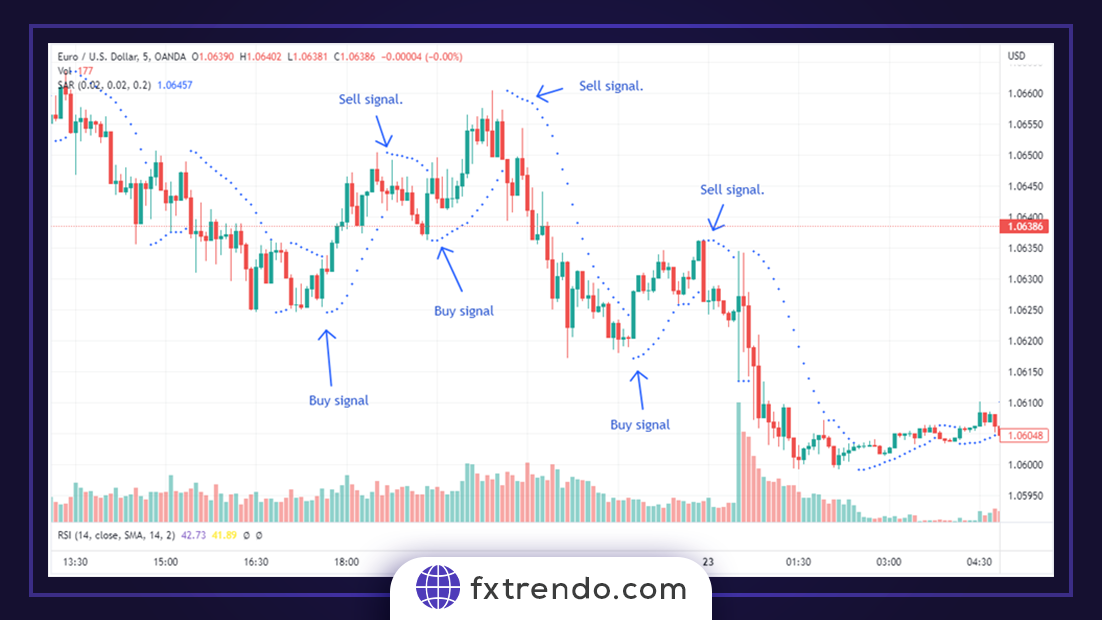
Parabolic SAR Indicator (Beginner):
The Parabolic SAR indicator is a popular tool for beginners in scalp trading. This method helps to identify possible entry and exit points by drawing points above or below the price candles and showing the trend’s direction.
Entry point
A trader enters a buy position when the Parabolic SAR points are below the price candles, implying an uptrend. On the contrary, we enter a sell position when the points are above the price candles and indicate a downtrend.
Exit point
The trader exits the trade when the Parabolic SAR points reverse their position, indicating a reversal trend.
Stop-loss
You can place a stop loss order at the last point of the Parabolic SAR and limit possible losses.
Take-profit
You can exit a trade when the trade reaches a predetermined price target or the Parabolic SAR shows a reversal trend.
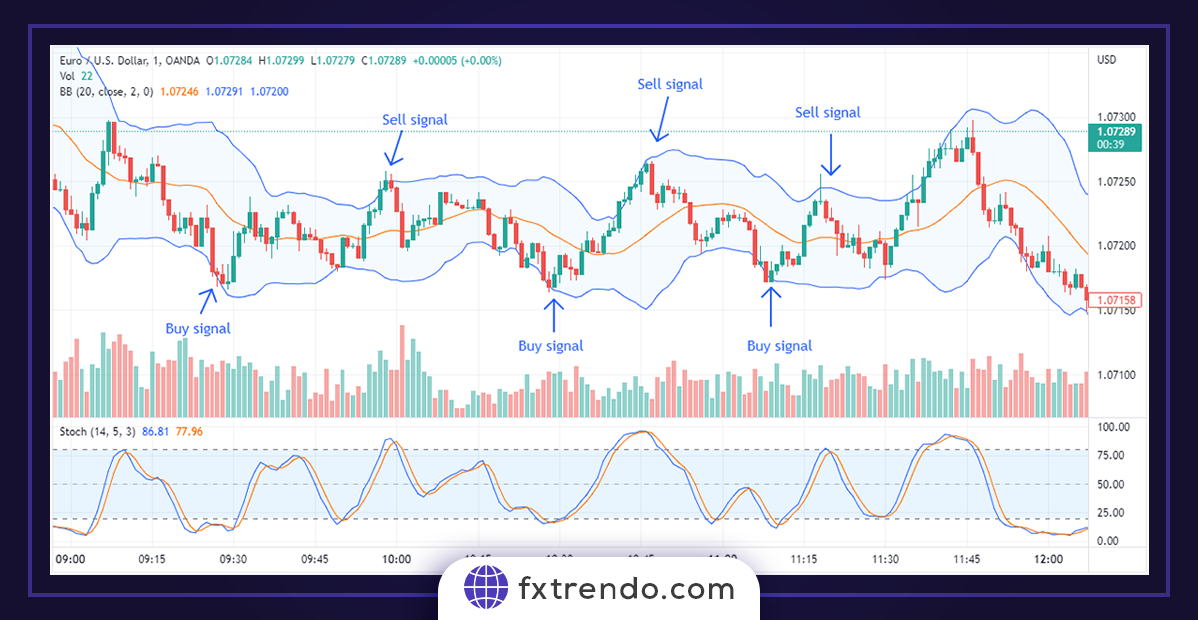
Bollinger Bands with Stochastic Indicator (Advanced):
Bollinger Bands and Stochastic Scalping Strategy focus on identifying possible reversals in an asset. This strategy is ideal for scalp traders who want to trade on small price movements to make a profit
Entry point
When the price penetrates below the Bollinger band and then closes above it, and the Stochastic indicator shows below 20, it is possible to enter into a buy trade, and when the price hits the upper band and after its reversal, the Stochastic indicator is above 80, it is possible to enter into a sell trade.
Exit point
Traders can profit up to the middle line of the Bollinger Bands. On the other hand, traders can close their positions when the price reaches the opposite band, as it often implies a change in the market trend.
Stop-loss
For risk management, we place a stop loss order three pips above the candlestick ceiling in the sell trade and three pips below the candlestick floor in the buy trade. If price movements are contrary to our expectations, this helps to limit possible losses.
Take-profit
A reasonable profit target would be three pips above the average price of recent swings. Traders can exit the trade once they reach this target. Remember that this strategy is scalping, and the goal is to profit from short price fluctuations. Therefore, managing risk and maintaining order when executing trades is necessary.
Hold strategy
Hold is a long-term investment strategy in which an investor buys stocks, bonds, or other assets and holds them for a long time despite market fluctuations. This approach relies on the thought that financial markets will provide a positive return on investment over time.
What is the Hold strategy?
A hold strategy involves buying a diversified mix of assets, such as stocks, bonds, or index funds, with the goal of long-term holding. Investors using this strategy typically ignore short-term market fluctuations and instead focus on the long-term increase possibility of their investments.
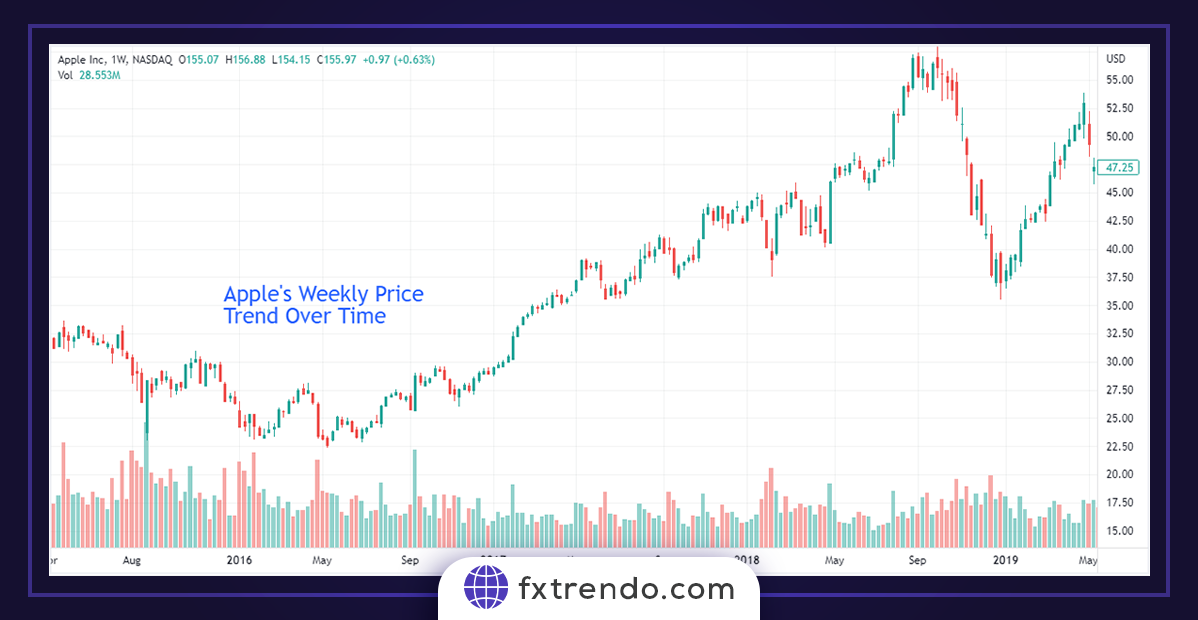
Why should you use a Hold strategy?
A hold strategy is based on the idea that, historically, financial markets have provided positive returns over long periods. Investors can benefit from compounded returns and avoid the risks and costs associated with frequent trading by holding trades for the long term. Further, this approach requires minimal time and effort to manage, making it suitable for investors who prefer a passive approach or have limited time to devote to active trading. Let’s suppose this is about Apple stock. An investor who believed in Apple’s powerful fundamental analysis could use a hold strategy. For example, if an investor had bought Apple stock in 2016 at around $28 per share, they would have seen a significant return on their investment over the years as the stock price rose to more than $150 per share by March 2023.
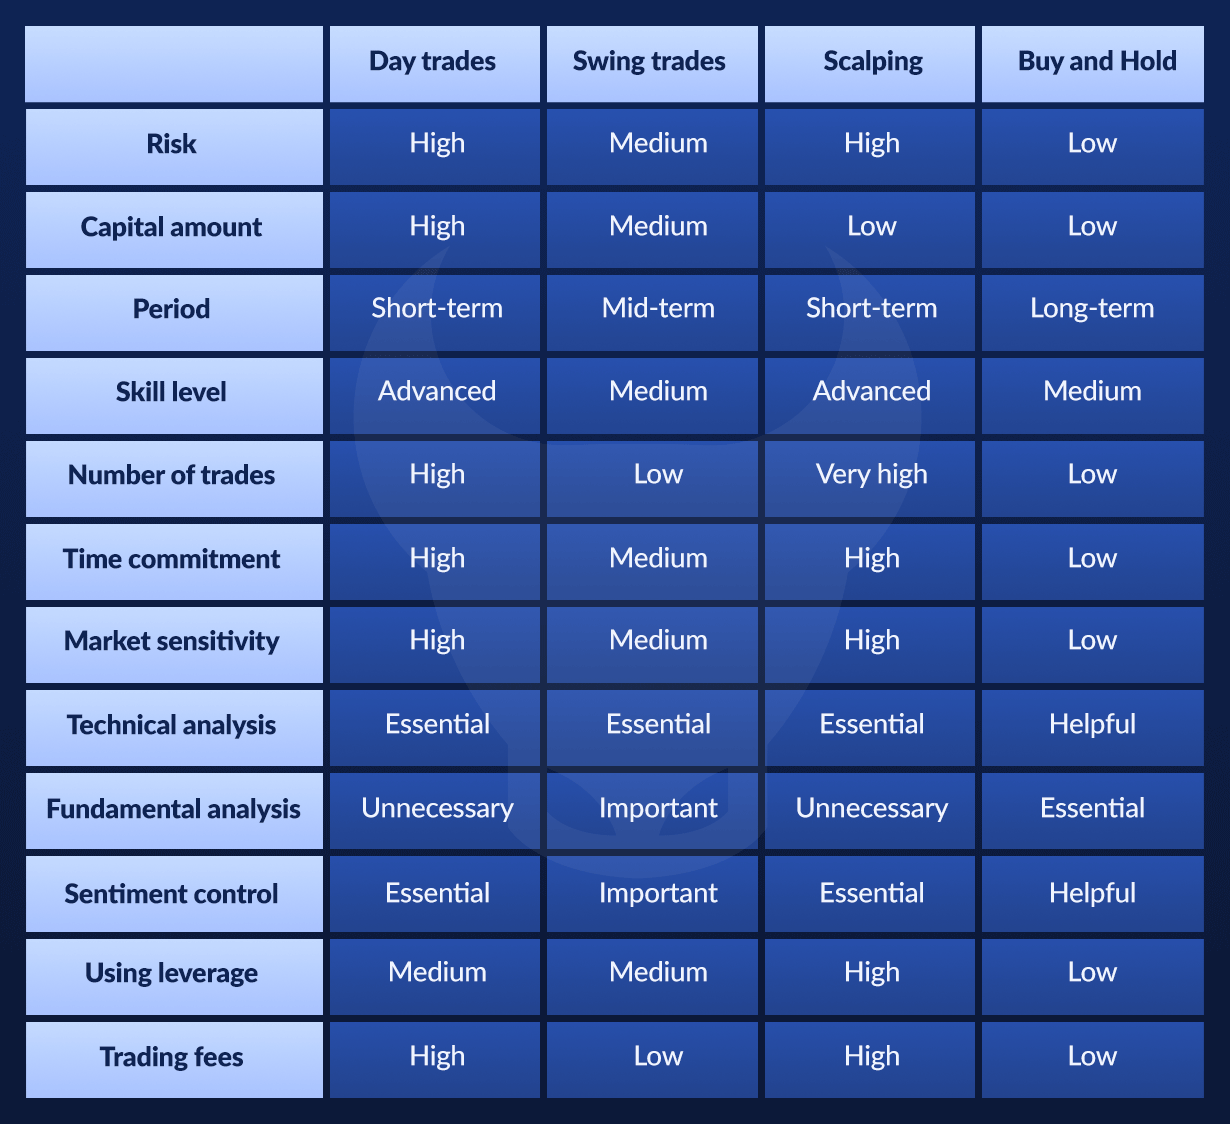
What trading strategies are best for you?
The winning trading strategy each individual depends on various factors such as financial goals, risk tolerance, time horizon, and investment knowledge. To help you choose the most suitable strategy, we’ve prepared a table with a brief overview of some of the most common trading methods.
Summary
There are various trading strategies, such as day trading, swing, scalping, and hold. Therefore, choosing the best strategy is tailored to the trader’s personal needs. Success in trading requires discipline, commitment to risk management principles, understanding the macroeconomy, and continuous learning. Traders can effectively navigate the trading world and achieve finan