


What Is the Crab Pattern in Trading? The Ultimate Guide to Trading Crab Pattern

Trading with the Harmonic Crab Pattern is done using Fibonacci ratios
In the tutorial article “The Ultimate Guide to Harmonic Pattern Trading Strategy ”, we understood the importance of harmonic patterns. Like other harmonic patterns, the crab pattern is also a reversal pattern that is used to identify the end of a trend. Stay tuned to learn more about this pattern.
The Crab Pattern, part of the Harmonic trading family, is known for its precision and reliability. But what exactly is it, and how can it benefit your trading strategy?
Whether you’re a seasoned trader or just starting out, understanding the Crab Pattern can give you an edge in the market. So, grab a cup of coffee, sit back, and let’s unravel the mysteries of the Crab Pattern together.
By the end of this guide, you’ll have a solid grasp of how to spot and trade this pattern like a pro. Ready to get started? Let’s dive in!
Contents
What are the Harmonic Patterns in Trading?
Harmonic patterns are a fascinating aspect of technical analysis in trading. They are specific formations that help traders predict future price movements by identifying geometric patterns in price charts.
These patterns are based on Fibonacci numbers, which are a series of numbers where each number is the sum of the two preceding ones. This might sound complex, but let’s break it down into simpler terms.
Imagine you’re looking at a price chart. Harmonic patterns help you see order in what might initially seem like chaotic price movements.
By recognizing these patterns, traders can make educated guesses about where prices might go next. This can be incredibly useful for making trading decisions.
Here are a few common harmonic patterns:
1. Gartley Pattern: Named after H.M. Gartley, this pattern looks like a series of peaks and valleys and is used to identify potential reversal points.
2. Butterfly Pattern: Similar to the Gartley but with different Fibonacci ratios, this pattern often appears at the end of a price move and signals a potential reversal.
3. Bat Pattern: Resembling a bat, this pattern helps traders spot potential reversal zones with specific Fibonacci levels.
4. Crab Pattern: Known for its precision, this pattern offers a high reward-to-risk ratio with distinct Fibonacci ratios.
5. ABCD Pattern: The simplest harmonic pattern, consisting of three movements and four points (A, B, C, and D), used to predict potential price reversals.
To use these patterns effectively, traders need to be familiar with Fibonacci retracement and extension levels. These levels help determine where the price might reverse or continue its trend.
What Is the Crab Pattern?
The Crab pattern is an advanced harmonic pattern used in trading to identify potential reversal points. Discovered by Scott Carney in 2000, this pattern is known for its precision and accuracy.
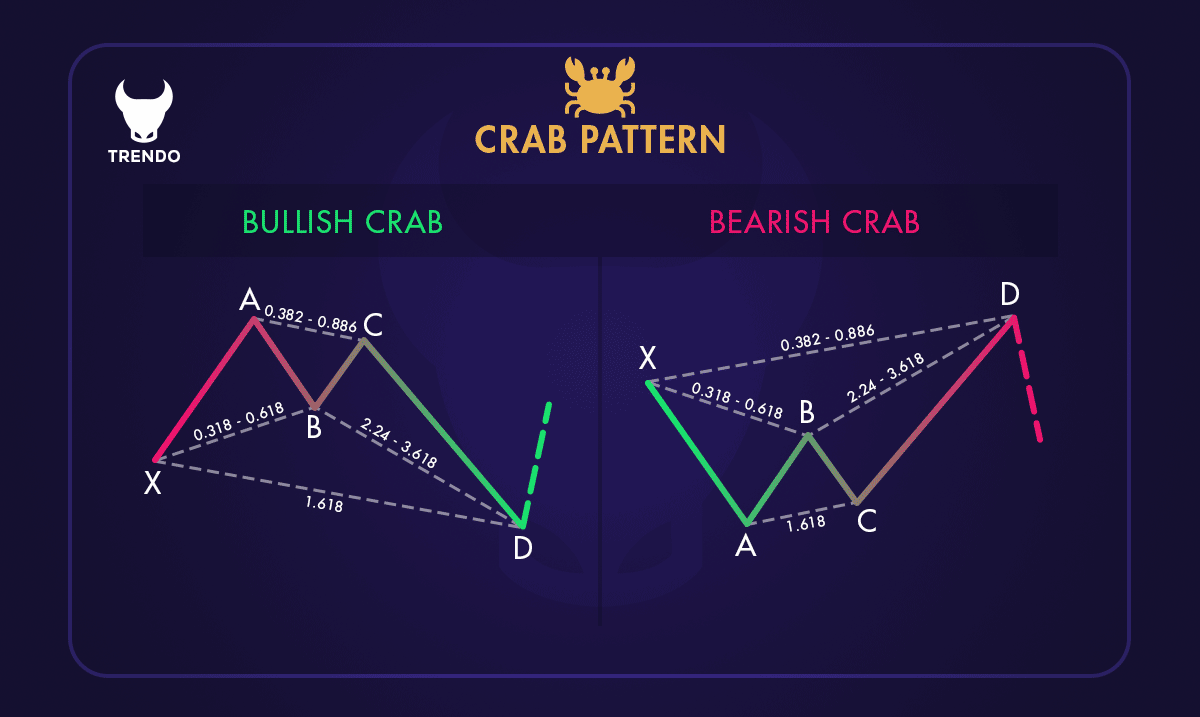
Two examples of the crab pattern
The Crab pattern consists of five points: X, A, B, C, and D, and four price swings: XA, AB, BC, and CD. The CD leg is significantly extended compared to the XA leg, helping traders pinpoint the Potential Reversal Zone (PRZ).
Here’s how to identify the Crab pattern:
1. XA Leg: The initial move, either bullish or bearish.
2. AB Leg: Retraces 38.2% to 61.8% of the XA leg.
3. BC Leg: Retraces 38.2% to 88.6% of the AB leg.
4. CD Leg: Extends 224% to 361.8% of the BC leg or 161.8% of the XA leg.
The key is to look for these specific Fibonacci ratios. When these ratios align, the pattern is valid, and traders can use it to predict potential price reversals.
Key Fibonacci Levels in the Crab Pattern
The Crab pattern relies on specific Fibonacci levels to identify potential reversal points. These levels act as critical support and resistance zones, guiding traders in making informed decisions. Here are the key Fibonacci levels involved in the Crab pattern:
1. XA Leg: The initial move in the pattern, which can be either bullish or bearish.
3. BC Leg: Retraces 38.2% to 88.6% of the AB leg, providing another potential reversal point.
4. CD Leg: The most extended part of the pattern, stretching 224% to 361.8% of the BC leg or 161.8% of the XA leg. This extension is crucial for identifying the Potential Reversal Zone (PRZ).
These Fibonacci levels help traders pinpoint where the price might reverse. When the price reaches these levels, it often signals a potential change in direction, allowing traders to enter or exit positions strategically.
Bullish vs. Bearish Crab Patterns
The Crab pattern is a versatile tool in trading, capable of signaling both bullish and bearish reversals. Understanding the differences between these two types can help traders make more informed decisions.
Bullish Crab Pattern
A bullish Crab pattern indicates a potential upward reversal. It typically forms after a significant downtrend, suggesting that the price might soon move higher. Here’s how to identify it:
1. Point X: The starting point of the pattern.
2. Point A: The highest point after X.
3. Point B: Retraces 38.2% to 61.8% of the XA leg.
4. Point C: Retraces 38.2% to 88.6% of the AB leg.
5. Point D: Extends 224% to 361.8% of the BC leg or 161.8% of the XA leg, marking the Potential Reversal Zone (PRZ).
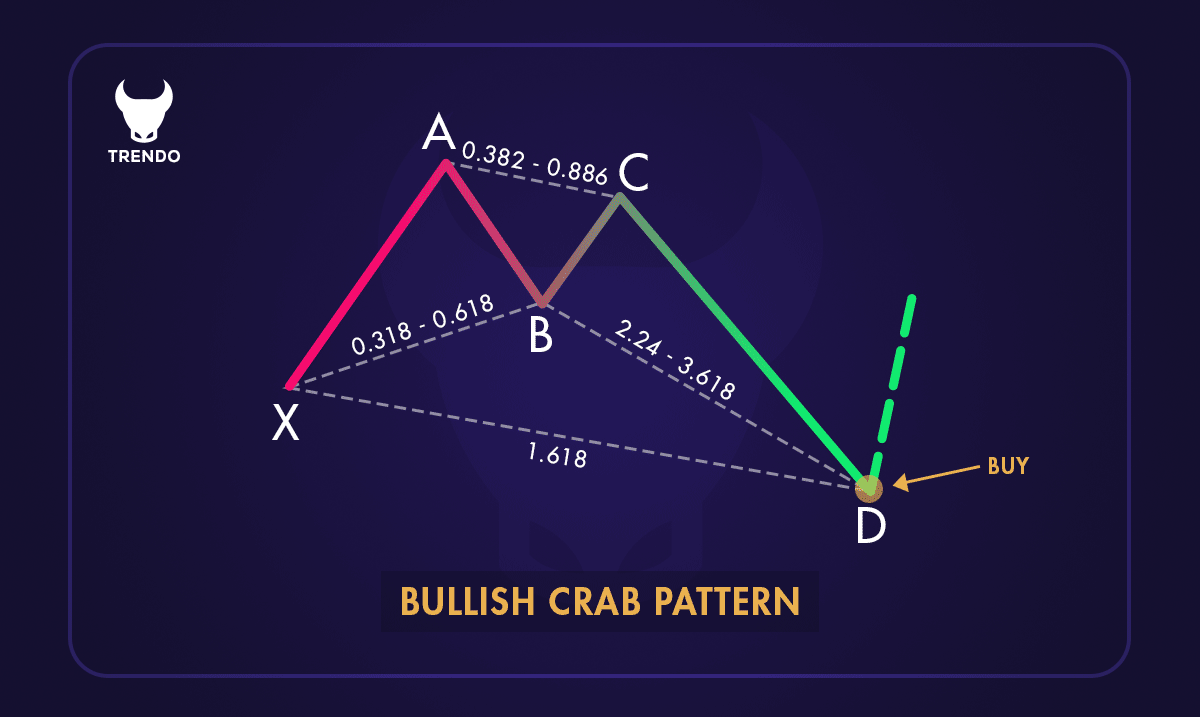
A Bullish Crab Pattern
In a bullish Crab pattern, point D is the lowest point, indicating a potential buying opportunity as the price is expected to rise from this level.
Bearish Crab Pattern
A bearish Crab pattern signals a potential downward reversal. It usually forms after a significant uptrend, suggesting that the price might soon move lower. Here’s how to identify it:
1. Point X: The starting point of the pattern.
2. Point A: The lowest point after X.
3. Point B: Retraces 38.2% to 61.8% of the XA leg.
4. Point C: Retraces 38.2% to 88.6% of the AB leg.
5. Point D: Extends 224% to 361.8% of the BC leg or 161.8% of the XA leg, marking the Potential Reversal Zone (PRZ).
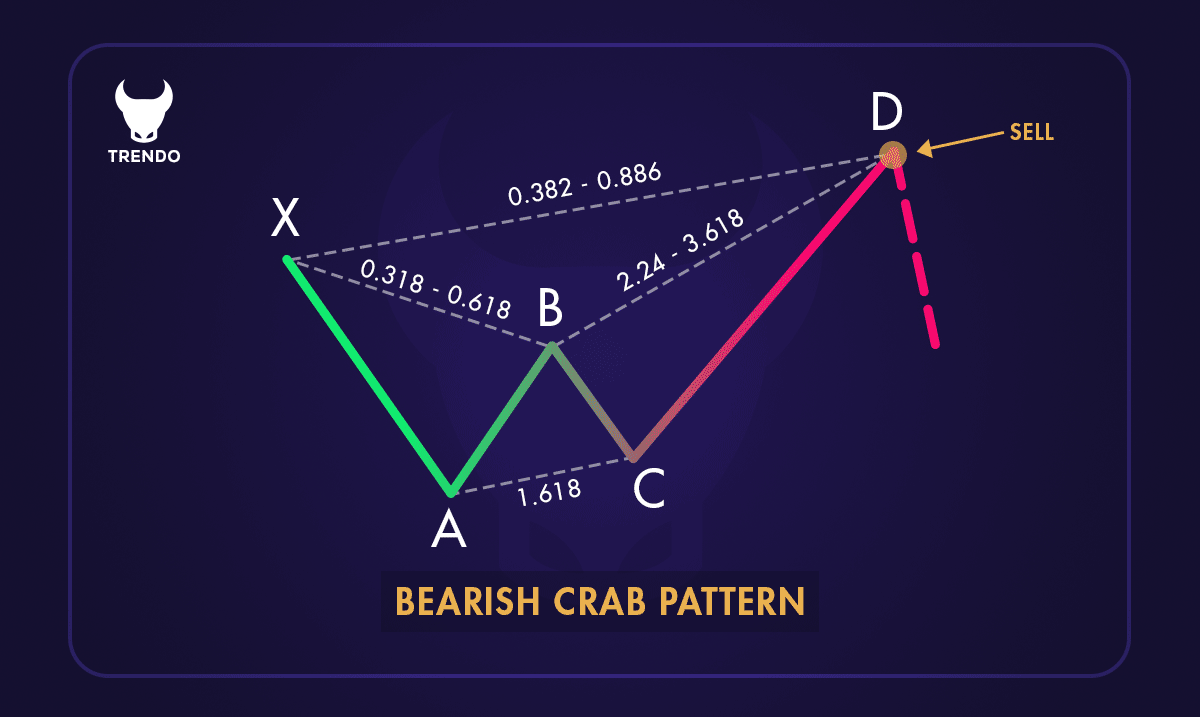
A Bearish Crab Pattern
Key Differences
Trend Direction: The bullish Crab pattern forms after a downtrend, while the bearish Crab pattern forms after an uptrend.
Reversal Points: In the bullish pattern, point D is the lowest point, signaling a buy. In the bearish pattern, point D is the highest point, signaling a sell.
By recognizing these patterns and their key Fibonacci levels, traders can better anticipate market reversals and make strategic trading decisions. Whether you’re looking to buy or sell, understanding the Crab pattern can provide valuable insights into market movements.
How to Identify the Crab Pattern on Charts?
Identifying the Crab pattern on charts involves recognizing specific price movements and Fibonacci levels. Here’s a step-by-step guide:
1. Locate the XA Leg: Identify the initial move from point X to point A, which can be upward or downward.
2. Measure the AB Leg: Look for a retracement from point A to point B, between 38.2% and 61.8% of the XA leg.
3. Identify the BC Leg: Find the move from point B to point C, retracing between 38.2% and 88.6% of the AB leg.
4. Determine the CD Leg: The final leg, from point C to point D, should extend 224% to 361.8% of the BC leg or 161.8% of the XA leg. This extension helps pinpoint the Potential Reversal Zone (PRZ).
5. Confirm the Pattern: Ensure all legs and their respective Fibonacci levels align correctly. When they do, the Crab pattern is valid.
6. Look for Reversal Signals: Watch for reversal signals at point D, where the price is expected to change direction, providing a potential trading opportunity.
By following these steps, you can effectively identify the Crab pattern on charts. This pattern helps traders anticipate market reversals and make informed trading decisions.
Advantages and Limitations of the Crab Pattern
The Crab pattern is a popular tool among traders for its precision and potential high rewards. However, like any trading strategy, it has its pros and cons. Understanding these can help traders use the pattern more effectively.
Advantages
1. High Accuracy: The Crab pattern is known for its precision in identifying potential reversal points. This accuracy can lead to more successful trades.
2. Excellent Risk-Reward Ratio: The pattern offers a favorable risk-reward ratio. Traders can set tight stop-loss levels and aim for significant profits, making it an attractive option.
3. Defined Take Profit Levels: The pattern provides clear take profit levels, helping traders plan their exits more effectively.
4. Versatility: The Crab pattern can be used in various markets, including stocks, forex, and commodities, making it a versatile tool for different trading environments.
Limitations
1. Complexity: The Crab pattern can be complicated for beginners to identify and trade. It requires a good understanding of Fibonacci levels and price movements.
2. Difficult to Spot: Finding the Crab pattern on charts can be challenging, especially in real-time trading. It requires patience and practice to recognize the pattern accurately.
3. No Clear Stop-Loss Level: Unlike some other patterns, the Crab pattern does not provide a clear stop-loss level. Traders often need to use additional price action analysis to determine the appropriate stop-loss point.
4. High Risk: While the potential rewards are high, the pattern also comes with significant risks. Incorrect identification or misinterpretation can lead to substantial losses.
How to Trade the Crab Pattern?
Trading the Crab Pattern can be a rewarding strategy if done correctly. Here’s a step-by-step guide to help you navigate this process:
1. Identify the Pattern: The first step is to spot the Crab Pattern on your chart. Look for the distinct “M” or “W” shape, which indicates potential market reversals. The pattern consists of five points: X, A, B, C, and D.
2. Draw the Pattern: Once you’ve identified the pattern, draw it on your chart. This helps you visualize the potential reversal zones. The key Fibonacci ratios to watch are the 1.618 extension of the XA leg and the 3.618 extension of the BC leg.
3. Wait for the Price to Reach Point D: The critical point in the Crab Pattern is point D, where the price is expected to reverse. Be patient and wait for the price to reach this level before making any moves.
4. Look for Trade Triggers: At point D, look for signals that confirm a reversal. This could be a candlestick pattern, an oscillator signal, or any other indicator you use in your trading strategy.
5. Enter the Trade: Once you have a confirmation signal, enter the trade. For a bullish Crab Pattern, go long (buy). For a bearish Crab Pattern, go short (sell).
6. Set Stop-Loss and Take-Profit Levels: To manage your risk, set a stop-loss order just beyond point D. This protects you from significant losses if the trade doesn’t go as planned. Also, set take-profit levels at key Fibonacci retracement levels, such as 0.382 or 0.618 of the AD leg.
7. Monitor and Manage the Trade: Keep an eye on the trade and be ready to adjust your stop-loss and take-profit levels as the market moves. This ensures you lock in profits and minimize losses.
By following these steps, you can effectively trade the Crab Pattern and potentially enhance your trading strategy. Remember, practice and patience are key to mastering any trading pattern.
Conclusion
Crab patterns are less common in the market compared to other harmonic patterns. However, when they do appear, they offer a high risk-to-reward ratio.
Identifying and trading these patterns requires experience and skill. Therefore, it’s essential to test your knowledge and skills in a demo account before trading in a real account.
Frequently Asked Questions
What is Crab in trading?
How accurate is the Crab pattern?
What is the Crab pattern in trading?
What is the Crab formation in trading?
Does harmonic trading really work?
What is the success rate of the Crab pattern?
Which harmonic pattern is the best?
What is the target of the Crab pattern?
Related Post
What are Price retracement and Reversal Trends, and how to identify them?
In this article, we introduce price retracement and reversal trends and will explain how to identify price retracement and price reversal in the trend.
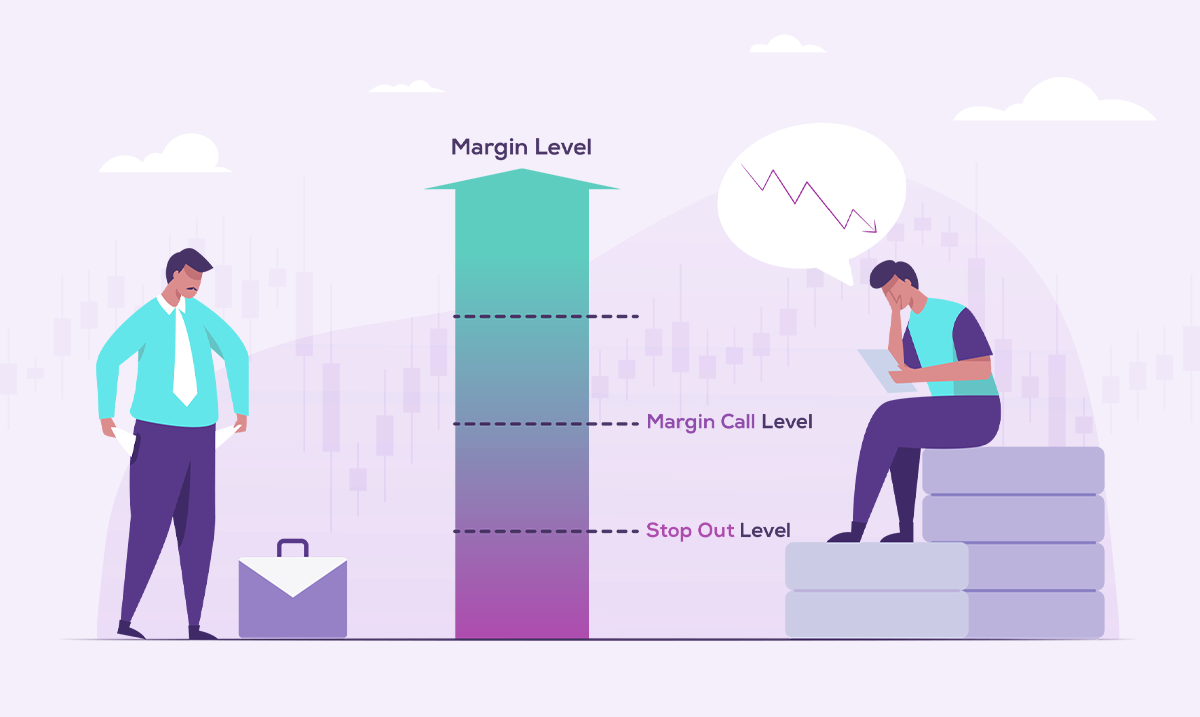
Margin call and Stop Out in Forex
Engaging in financial market trading comes with its unique set of rules. Among these, the concepts of Margin Call and Stop Out hold significant importance.
What is hedging in Forex, and how does this strategy compensate for trading risk?
Teaching the concept of hedging in forex trading and how to enter and exit these positions
most visited

")


 in Forex & How to Use it in Trading?")

